 🌊 Lakefront
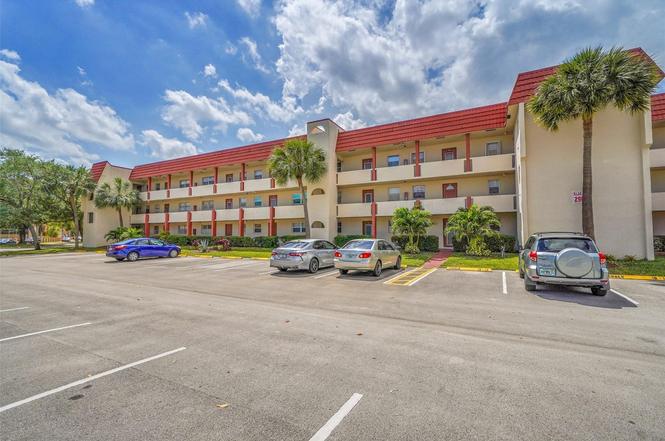
2901 Sunrise Lakes Dr #101 · Sunrise, FL
Flood risk No data
- FEMA flood zone
- —
- Chance of flooding over 30 yrs
- —
- Est. flood insurance / yr
- —
Fire risk No data
- Est. fire insurance / yr
- —
Heat risk No data
- Hot days now (above threshold)
- —
- Hot days in 30 yrs
- —
Wind risk No data
- Chance of severe wind over 30 yrs
- —
Air-quality risk No data
- Unhealthy air days now
- —
- Unhealthy air days in 30 yrs
- —
Risk factors via First Street. Map © Google.
Why this score? — see what drove the B grade
The composite is a weighted blend of 9 inputs, each scored 0–100. Each bar is that input's sub-score; the figure is the points it added to the 100-point composite (weight × sub-score).
- Cash flow +30.0/30.0
- 1% rule +10.0/10.0
- DSCR +10.0/10.0
- ARV discount +7.5/15.0
- Livability +4.2/5.0
- Schools +4.1/10.0
- Rent growth +2.7/5.0
- Condition / age +2.5/5.0
- Appreciation +0.0/10.0
$84,500
🖨 Deal sheet 📄 Offer letter ✓ Due diligence
Listing remarks
THIS SPACIOUS CORNER UNIT ON THE FIRST FLOOR FEATURES A THOUGHTFULLY DESIGNED SPLIT FLOOR PLAN WITH TWO BEDROOMS AND TWO BATHROOMS, IDEAL FOR 55+ LIVING. ENJOY THE CONVENIENCE OF AN ASSIGNED SPACE RIGHT IN FRONT OF THE UNIT, ALONG WITH PLENTY OF GUEST PARKING NEARBY. RESIDENTS CAN TAKE ADVANTAGE OF A VARIETY OF AMENITIES, SUCH AS A POOL, CLUBHOUSE, AND TENNIS COURTS, PROMOTING AN ACTIVE LIFESTYLE. WITH SHOPPING AND ENTERTAINMENT JUST A SHORT DISTANCE AWAY, THIS HOME OFFERS THE PERFECT BLEND OF COMFORT, CONVENIENCE, AND COMMUNITY. YOU'LL FEEL RIGHT AT HOME FROM THE MOMENT YOU MOVE IN. 20% MINIMUM DOWNPAYMENT PER ASSOCIATION AND 650 CREDIT SCORE.
Key facts
- Assigned space
- Guest parking
- Split floor plan
Tags
Property features AI
Finance
- Other: County road frontage with asphalt, publicly maintained road
- Financial info: No land lease
- HOA & community: Association: SUNRISE LAKES; Monthly HOA fee includes sewer, trash, water, and elevator; Community amenities include billiard room, clubhouse, fitness center, and picnic area; Maintenance provided; Senior community
Exterior
- Parking: One assigned parking space; Guest parking available
- Security: Security patrol
- Utilities: Public water; Public sewer; 150 Amp electric service; Cable available
- Home design: Condominium; One-level living; First-floor entry; East-facing
- Construction: CBS construction
- Exterior features: Open patio; Patio
Interior
- Kitchen: Electric range; Refrigerator
- Bedrooms: One main-level bedroom
- Flooring: Tile
- Bathrooms: Two full bathrooms (one on main level)
- Heating & cooling: Central electric heating; Central air conditioning; Ceiling fan(s)
- Interior features: Stacked bedroom layout; Unfurnished
- Laundry & utility: Shared laundry in common area
Neighborhood map
What this means for you Summary
Snapshot
- This is a 2-bed/2.0-bath condo listed at $84k.
Deal economics
- At list price, monthly cash flow is $437 ($5k/yr) — positive.
- The deal already cash-flows at list — no discount required.
- Meets the 1% rule at list price ($2k rent vs $84k).
- Recommended offer: $77k (9.0% below list) — sets the bar for market timing.
- Cap rate 12.5% vs local median 4.9% in Sunrise — top-decile yield for the area; either an underpriced asset or a hidden risk that comps aren't pricing in. Stress-test before assuming the spread holds.
Location & tenants
- Location reads 83/100 on livability (#56 in FL, #986 nationally) — a professional / high-income tenant draw. Strengths: commute A+, housing A+, health & safety A+; Watch: employment C-, amenities F.
- Broward (suburban): math 42% / reading 53% proficiency, ranked #46 of 73 in FL (top 63%) — families likely to look elsewhere, expect single-tenant / working-renter base with shorter leases.
- Market conditions: Rents flat; 559 active listings in the ZIP; 40 comparable units currently listed for rent nearby; rentals at typical pace (median 25d on market — plan ~3-4 weeks tenant-placement turnaround); 2,111 units permitted in Broward County in 2024 (1,265 in 5+ unit buildings).
- This rent runs 36% of the median local income ($72k/yr) — at the standard rent-burdened threshold; future hikes will face affordability resistance.
Forward outlook
- Local home prices are declining (-3.0%/yr); year-one equity from $584 of loan paydown is wiped out by about $3k of value loss. Plan a longer hold.
- Broward County population projected at +34% by 2050 — long-run rental-demand tailwind backs the buy-and-hold thesis.
- At projected returns (-3.0% appreciation + 0.6% rent growth), your $24k cash investment doubles in ~8 years — after that, you're playing with house money.
Negotiation context
- It's been on market 99 days — a 9% lower offer ($77k) is reasonable based on typical stale-listing flexibility.
- Current owner paid $57k; 48% above their basis — modest negotiation headroom, anchor on the comps not their cost.
Risks & watch-outs
- Watch-outs: property tax is 3.1% of price; HOA is 27% of rent.
Questions for the listing agent
- It's been on market 99 days. Have you received any prior offers? Is the seller open to a 9% concession, seller financing, or rate buy-down credit?
- Built in 1973 — when were the roof, HVAC, electrical panel, plumbing, and water heater last replaced?
- Property tax is high relative to price — has the assessment been appealed recently, and will the sale trigger a re-assessment?
- What does the HOA fee cover, when was the last increase, and are there any pending special assessments or reserve-fund shortfalls?
- Any open or pending special assessments — roof, HVAC, plumbing, elevator, façade? What's the per-unit balance and payoff schedule, and is the seller paying it off at close or rolling it to the buyer?
- Why hasn't it sold? Are there any deal-killer items the seller is aware of (foundation, flood, title, zoning, code violations)?
- Is there a deadline driving the sale (1031 exchange, divorce, estate, relocation)? That informs how much negotiation room exists.
- This sits on a lake — are riparian / water-frontage rights deeded with the parcel? Any dock permits, shoreline easements, or HOA water-use restrictions?
- What's the documented flood / surge / shoreline-erosion history here (FEMA AND non-FEMA — e.g., storm surge, creek backup, septic-field saturation)?
- Any water-quality or seasonal algae-bloom issues that affect tenant satisfaction or short-term-rental demand?
- What's the average days-on-market for RENTAL listings here right now (not sales)? A rising rental-DOM trend means longer vacancies and softer asking-rent achievability than the comps imply.
- What's the recent tenant-quality profile in this submarket — average credit score on applications, eviction rate, late-payment / NSF rate, and stable-employment percentage? A property-management company in the area should have these aggregated.
- How much new apartment / multifamily construction is in the pipeline within 1–3 miles? Heavy new supply (>2% of stock underway) typically softens rents 12–24 months out; light construction supports rent growth.
Investment metrics
- 1% rule
- 2.57% ✓
- Cap rate
- 12.50%
- Cash-on-cash
- 22.18%
- DSCR
- 1.99
- GRM
- 3.2
CMA / ARV
No comps found within radius.
Projected returns pro-forma
-3.0% appreciation · 0.6% rent growth · sell at horizon
- IRR
- 10.6%
- Equity multiple
- 1.40×
- Total profit
- $9,494
- Equity at exit
- $12,599
- IRR
- 16.3%
- Equity multiple
- 2.10×
- Total profit
- $25,950
- Equity at exit
- $7,306
Cash invested: $23,660 (down + closing). Projections, not guarantees.
Landlord ↔ Tenant lean methodology
- Overall (STATE)
- 87 Strongly Landlord-Friendly
- State Florida
- 87 Strongly Landlord-Friendly · R+3
- County
- — inherits STATE
- City
- — inherits STATE
ZIP-level market 33322
- Home prices YoY
- -33.3%
- Rents YoY
- 0.6%
- Active inventory
- 559
- Price-to-rent
- 3.2×
Monthly cashflow live
- Estimated rent
- $2,174 high interval (Pro) →
- Mortgage (P&I)
- −$443
- Tax from tax record
- −$216 /mo · $2,594/yr
- Insurance
- −$35
- HOA
- −$586
- Vacancy / Maint / Mgmt
- −$457
- Net cashflow
- $437
Break-even live
UW: 25.0% down · 7.5% · 30yr · 1.5% tax · 5.0% vac · 8.0% maint · 8.0% mgmt
Financing live
Cash to close
- Down payment
- $21,125
- Closing costs
- $2,535
- Reserves months
- —
- Total cash needed
- —
Loan-product check · same deal, 3 products live
Conventional
25% down · 7.5% · 30yr
- Down + closing
- —
- Monthly P&I
- —
- Monthly cashflow
- —
- DSCR
- —
- Eligible?
- —
Personal DTI + credit; lowest rate.
DSCR
20% down · 8.5% · 30yr
- Down + closing
- —
- Monthly P&I
- —
- Monthly cashflow
- —
- DSCR
- —
- Eligible?
- —
No personal income docs; deal must DSCR.
Hard money
10% down · 12.0% · 12mo
- Down + closing
- —
- Monthly P&I
- —
- Monthly cashflow
- —
- DSCR
- —
- Eligible?
- —
Short-term bridge; refi at stabilization.
Rent comps 40 comps
| Address | Beds | Baths | Sqft | Rent | $/sqft | DOM | Units | Dist |
|---|---|---|---|---|---|---|---|---|
| 3048 Sunrise Lakes Dr E Unit 411 Sunrise, FL | 1.0 | 1.0 | 725 | $1,600 | $2.21 | 3d | 1 | 0.25mi |
| 3048 Sunrise Lakes Dr E Unit 411 Sunrise, FL | 1.0 | 1.0 | 725 | $1,650 | $2.28 | 21d | 1 | 0.25mi |
| 3048 E Sunrise Lakes Dr #412 Sunrise, FL | 1.0 | 1.0 | 725 | $1,400 | $1.93 | 22d | 1 | 0.25mi |
| 7891 Sunrise Lakes Dr N Sunrise, FL | 2.0 | 2.0 | 850 | $2,500 | $2.94 | 24d | 1 | 0.30mi |
| 8100 Sunrise Lakes Blvd Sunrise, FL | 1.0–2.0 | 1.0–2.0 | 745 | $2,200 | $2.95 | 11d | 2 | 0.39mi |
| 8110 Sunrise Lakes Blvd #307 Sunrise, FL | 1.0 | 1.0 | 640 | $1,500 | $2.34 | 17d | 1 | 0.42mi |
| 8110 Sunrise Lakes Blvd #307 Sunrise, FL | 1.0 | 1.0 | 640 | $1,500 | $2.34 | 2d | 1 | 0.42mi |
| 8135 Sunrise Lakes Blvd Sunrise, FL | 1.0–2.0 | 1.0–2.0 | 745 | $1,550 | $2.08 | 24d | 2 | 0.42mi |
| 8135 Sunrise Lakes Blvd #302 Sunrise, FL | 2.0 | 2.0 | 850 | $1,550 | $1.82 | 11d | 1 | 0.44mi |
| 8225 Sunrise Lakes Blvd #303 Sunrise, FL | 2.0 | 2.0 | 850 | $1,600 | $1.88 | 3d | 1 | 0.49mi |
| 8310 NW 24th Pl Sunrise, FL | 2.0 | 1.0 | 900 | $2,400 | $2.67 | 19d | 1 | 0.51mi |
| 8053 W Oakland Park Blvd Unit 1-204 Sunrise, FL | 1.0 | 1.0 | 735 | $2,450 | $3.33 | 24d | 1 | 0.52mi |
| 8053 W Oakland Park Blvd Unit 6-301 Sunrise, FL | 2.0 | 2.0 | 1124 | $3,411 | $3.03 | 24d | 1 | 0.52mi |
| 8053 W Oakland Park Blvd Unit 5-305 Sunrise, FL | 1.0 | 1.0 | 846 | $2,702 | $3.19 | 24d | 1 | 0.52mi |
| 8053 W Oakland Park Blvd Unit 6-307 Sunrise, FL | 1.0 | 1.0 | 727 | $2,618 | $3.60 | 24d | 1 | 0.52mi |
| 8053 W Oakland Park Blvd Sunrise, FL | 1.0 | 1.0 | 846 | $2,779 | $3.28 | 24d | 1 | 0.52mi |
| 8053 W Oakland Park Blvd Unit 1-201 Sunrise, FL | 2.0 | 2.0 | 1107 | $3,223 | $2.91 | 24d | 1 | 0.52mi |
| 8053 W Oakland Park Blvd Unit 5-101 Sunrise, FL | 1.0 | 1.0 | 986 | $3,354 | $3.40 | 24d | 1 | 0.52mi |
| 8220 Sunrise Lakes Blvd #309 Sunrise, FL | 2.0 | 2.0 | 850 | $1,650 | $1.94 | 24d | 1 | 0.53mi |
| 8285 Sunrise Lakes Blvd #208 Sunrise, FL | 1.0 | 1.0 | 640 | $1,400 | $2.19 | 7d | 1 | 0.55mi |
| 8285 Sunrise Lakes Blvd #208 Sunrise, FL | 1.0 | 1.0 | 640 | $1,400 | $2.19 | 24d | 1 | 0.55mi |
| 3220 NW 84th Ave Sunrise, FL | 2.0 | 2.0 | 1115 | $2,150 | $1.93 | 24d | 1 | 0.55mi |
| 8300 Sunrise Lakes Blvd #212 Sunrise, FL | 2.0 | 2.0 | 850 | $1,900 | $2.24 | 3d | 1 | 0.58mi |
| 8083-8093 W Oakland Park Blvd Sunrise, FL | 1.0–3.0 | 1.0–2.0 | 1054 | $3,226 | $3.06 | 24d | 37 | 0.60mi |
| 3232 NW 84th Ave Sunrise, FL | 2.0 | 2.0 | 1115 | $2,000 | $1.79 | 24d | 1 | 0.62mi |
| 3244 NW 84th Ave Sunrise, FL | 2.0 | 2.0 | 1115 | $2,300 | $2.06 | 24d | 1 | 0.62mi |
| 3200 NW 84th Ave Sunrise, FL | 2.0 | 2.0 | 1115 | $2,100 | $1.88 | 24d | 1 | 0.62mi |
| 7461 NW 23rd St Sunrise, FL | 2.0 | 1.0 | 896 | $2,550 | $2.85 | 14d | 1 | 0.63mi |
| 8350 Sunrise Lakes Blvd #204 Sunrise, FL | 2.0 | 2.0 | 850 | $1,600 | $1.88 | 24d | 1 | 0.64mi |
| 8400 Sunrise Lakes Blvd #106 Sunrise, FL | 1.0 | 1.0 | 640 | $1,400 | $2.19 | 24d | 1 | 0.67mi |
| 8400 Sunrise Lakes Blvd #106 Sunrise, FL | 1.0 | 1.0 | 640 | $1,400 | $2.19 | 7d | 1 | 0.67mi |
| 2534 NW 73rd Ave Sunrise, FL | 1.0 | 1.0 | 950 | $1,750 | $1.84 | 24d | 1 | 0.70mi |
| 8465 Sunrise Lakes Blvd #106 Sunrise, FL | 1.0 | 1.0 | 640 | $1,450 | $2.27 | 24d | 1 | 0.71mi |
| 6885 NW 27th Ct Sunrise, FL | 2.0 | 1.0 | 923 | $2,090 | $2.26 | 12d | 1 | 0.76mi |
| 8500 Sunrise Lakes Blvd #111 Sunrise, FL | 2.0 | 2.0 | 850 | $1,850 | $2.18 | 15d | 1 | 0.76mi |
| 8500 Sunrise Lakes Blvd #111 Sunrise, FL | 2.0 | 2.0 | 850 | $1,850 | $2.18 | 10d | 1 | 0.76mi |
| 7620 NW 21st St Sunrise, FL | 3.0 | 2.0 | 1082 | $2,750 | $2.54 | 15d | 1 | 0.76mi |
| 3648 NW 83rd Ln Sunrise, FL | 2.0 | 1.0 | 885 | $2,000 | $2.26 | 24d | 1 | 0.77mi |
| 3648 NW 83rd Ln Sunrise, FL | 2.0 | 1.0 | 987 | $2,100 | $2.13 | 14d | 1 | 0.77mi |
| 8595 Sunrise Lakes Blvd Sunrise, FL | 1.0 | 1.0 | 640 | $1,550 | $2.42 | 21d | 2 | 0.80mi |
HOA detail condo
- Monthly dues
- $586 · $7,032/yr
- Likely covers
- pool
- Assessments
- None detected in remarks — confirm with the listing agent.
Listing history 20 events
-
2026-06-18days on market $84,500 Active 99 DOM
-
2026-06-17days on market $84,500 Active 98 DOM
-
2026-06-16days on market $84,500 Active 97 DOM
-
2026-06-15days on market $84,500 Active 96 DOM
-
2026-06-13days on market $84,500 Active 94 DOM
-
2026-06-09days on market $84,500 Active 90 DOM
-
2026-06-07days on market $84,500 Active 88 DOM
-
2026-06-04days on market $84,500 Active 85 DOM
-
2026-06-03days on market $84,500 Active 84 DOM
-
2026-06-02days on market $84,500 Active 83 DOM
-
2026-06-01days on market $84,500 Active 82 DOM
-
2026-05-31days on market $84,500 Active 81 DOM
-
2026-05-08price $84,500
-
2026-04-13price $90,000
-
2026-03-24price $95,000
-
2025-10-08$102,500 Active
-
2005-04-28soldstatus $57,000
-
1998-02-23soldstatus $20,000
-
1993-09-24soldstatus $29,000
-
1993-09-01soldstatus $29,000
ⓘ Source: listings_history table (triggers on properties + properties_extension) + one-shot
backfill from property_details.listing_events for pre-trigger history.
Tax reassessment forecast FL · Resets to sale price
- Current annual tax
- $2,594 · $216/mo
- Projected year-2 tax
- $2,594 · $216/mo
- Expected delta
- $0/yr ($0/mo · 0.0%)
ⓘ Screening estimate from a state-policy table — verify with the county assessor before closing.
Nearby sold comps map
Loading sold comps map…
Walkable amenities ~0.75 mi
Loading nearby amenities…
Taxation est. · year 1
- Rental income
- $26,093
- − Mortgage interest
- −$4,733
- − Property taxes
- −$2,594
- − Insurance
- −$422
- − Repairs & maintenance
- −$2,087
- − Management
- −$2,087
- − HOA
- −$7,032
- − Depreciation
- −$2,458
- Taxable income
- $4,679
- Est. tax owed @ 24.0%
- −$1,123
- After-tax cash flow
- $4,125/yr
For passive investors: Depreciation is non-cash, so a rental often shows a tax loss while cash-flowing — sheltering income. Rental losses are passive: they offset passive income freely, and up to $25,000/yr can offset ordinary (W-2) income if you actively participate and your MAGI is under $100k (phasing out to $0 by $150k); unused losses carry forward. On sale, claimed depreciation is recaptured at up to 25%, and gains may owe capital-gains tax (a 1031 exchange can defer both). Figures are a year-1 estimate at your 24.0% rate — not tax advice; consult a CPA.
Schools (NCES district)
- District
- Broward
- NCES district ID
- 1200180
- Math proficiency
- 42% ▼ -18.00%
- Reading proficiency
- 53% ▼ -5.00%
- Median HH income
- $52,139
- Composite
- 40.88/100
- National rank
- #3621
- State rank
- #46 of 73 in FL
Livability — Sunrise
- Score
- 83/100
- State rank
- #56
- US rank
- #986
Category grades
Schools grade is shown separately in the Schools card above.
Census & demographics
- Census place
- Sunrise, FL
- County
- Broward County · 1,963,430 people
- City population
- 77,492
- Metro
- Miami-Fort Lauderdale-Pompano Beach, FL
- Population (ZIP)
- 41,128
- Household income
- $71,755
- Rent vs Own
- Severe rent burden
- 931.0
Population outlook (Broward County) Hauer SSP2
- Today (2025)
- 2,207,033 people
- By 2030
- 2,360,704 · +7.0%
- By 2040
- 2,661,208 · +20.6%
- By 2050
- 2,946,698 · +33.5%
- By 2075
- 3,602,273 · +63.2%
- By 2100
- 3,970,984 · +79.9%
Race, ethnicity, and origin ACS 2023
- Neighborhood character
- Highly diverse neighborhood (Simpson 0.72)
- Race & ethnicity
- Hispanic / Latino 35% White 32% Black 24% Two or more races 22% Asian 4%
- Hispanic origin (detail)
- Puerto Rican 5% Cuban 6% Dominican 2% Salvadoran 1%
- Common ancestry
- Hispanic 5% Romanian 2% Scotch-Irish 2%
- Foreign-born
- 41% · Canada, Jamaica, South Korea
- Languages at home
- 58% English-only · Spanish 30% French/Haitian/Cajun 6% Other Indo-European 1%
Political lean MEDSL · Broward
- 2024 margin
- D (+17.0) · D 58.0% · R 41.0%
- 2008→2024 swing
- -17.8pp toward R · 2008: 34.7pp · 2024: 17.0pp
- All cycles
- 2024: D+17.0 2020: D+29.8 2016: D+35.0 2012: D+34.9 2008: D+34.7
Not yet ingested
- Civics
- —
Market trends
- HPI YoY
- ▼ -203.34%
- Current HPI
- 407.5452
- Rent YoY
- ▲ 0.60%
- Metro
- Miami-Fort Lauderdale-Pompano Beach, FL
- State GDP YoY
- ▲ 3.28%
- F500 in state
- 36
Industry mix (Fortune 500 HQ in FL)
| Industry | F500 HQs | Revenue |
|---|---|---|
| Industrial Technology | 2 | $29B |
|
||
| Insurance | 2 | $17B |
|
||
| Retail | 1 | $60B |
|
||
| Technology Distribution | 1 | $58B |
|
||
| Homebuilding | 1 | $35B |
|
||
| Technology Manufacturing | 1 | $35B |
|
||
Price history
+191.4% since first listed8 events — show timeline
- 2026-05-08 Price Changed $84,500 Beaches MLS
- 2026-04-13 Price Changed $90,000 Beaches MLS
- 2026-03-24 Price Changed $95,000 Beaches MLS
- 2025-10-08 Listed $102,500 Beaches MLS
- 2005-04-28 Sold (Public Records) $57,000 Public Records
- 1998-02-23 Sold (Public Records) $20,000 Public Records
- 1993-09-24 Sold (Public Records) $29,000 Public Records
- 1993-09-01 Sold (Public Records) $29,000 Public Records
Property tax history
+12.1%/yrLatest (2025): $2,594 · -9.6% YoY. Source: county tax records.
Cash-flow waterfall
monthlySold comps — $/sqft
last 12 mo · ≤1 miLoading sold comps…