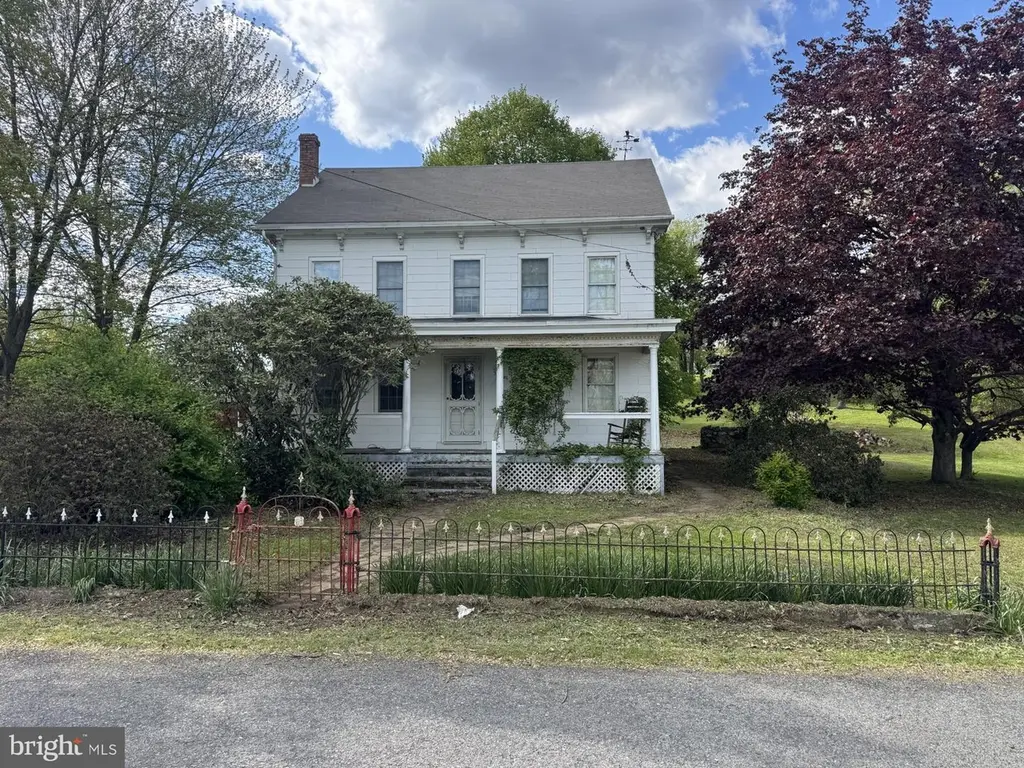
167 Llewellyn Rd · Llewellyn, PA
Flood risk 1/10 · Minimal
- FEMA flood zone
- X (unshaded)
- Chance of flooding over 30 yrs
- 0.0%
- Est. flood insurance / yr
- $473 – $860
Fire risk 3/10 · Minor
- Est. fire insurance / yr
- $511 – $949
Heat risk 4/10 · Minor
- Hot days now (above 95°F)
- 7 days/yr
- Hot days in 30 yrs
- 15 days/yr
Wind risk 4/10 · Minor
- Chance of severe wind over 30 yrs
- 8.0%
Air-quality risk 2/10 · Minimal
- Unhealthy air days now
- 1 days/yr
- Unhealthy air days in 30 yrs
- 3 days/yr
Risk factors via First Street. Map © Google.
Why this score? — see what drove the D grade
The composite is a weighted blend of 9 inputs, each scored 0–100. Each bar is that input's sub-score; the figure is the points it added to the 100-point composite (weight × sub-score).
- ARV discount +15.0/15.0
- Cash flow +7.1/30.0
- 1% rule +5.5/10.0
- Rent growth +3.9/5.0
- Schools +3.0/10.0
- Livability +2.5/5.0
- Condition / age +2.5/5.0
- DSCR +1.3/10.0
- Appreciation +0.0/10.0
$149,000
🖨 Deal sheet (PDF) 📄 Offer letter ✓ Due diligence
Listing remarks
4 Bedroom farmhouse sitting on 1.2 Acres in a great neighborhood on Llewellyn Rd. Modern Kitchen and 2 modern bathrooms, one on each floor. 1st Floor laundry. Large yard with off street parking. House functions as it should. Will need some updates. Yard is private for outside living. Minutes from town.
Key facts
- 1.2 acre lot
- 4 parking spots
- Built 1900
Property features AI
Exterior
- Parking: Four total garage/parking spaces; Driveway with two spaces; Two off-street spaces
- Utilities: Public water; Public sewer; Oil hot water; Heating fuel: oil
- Home design: Detached single-family home; Estimated original construction with major remodel in 1975; Above-grade finished living area reported (estimated)
- Construction: Frame construction; Shingle roof; Foundation: permanent stone
- Exterior features: Not in a federal flood zone; No tidal water on the lot
Interior
- Kitchen: Kitchen (appliance details not provided)
- Bedrooms: Four bedrooms on the upper level; Rooms listed include: Dining Room, Family Room, Kitchen, Laundry, Attic
- Bathrooms: Two full bathrooms (one on main level, one on upper level)
- Heating & cooling: Baseboard hot water heating; Window air conditioning units (electric)
- Interior features: 2+ access exits; Unfinished basement
- Laundry & utility: Laundry room
Neighborhood map
What this means for you Summary
Snapshot
- This is a 4-bed/1.0-bath single-family listed at $149k.
Deal economics
- At list price, monthly cash flow is $-209 ($-3k/yr) — negative.
- To cash-flow at today's rent, offer at most $144k (3.7% below list).
- Meets the 1% rule at list price ($2k rent vs $149k).
- Recommended offer: $144k (3.7% below list) — sets the bar for cash-flow.
Location & tenants
- Location reads: area grade D — affects rentability + tenant quality, not the cash-flow math above.
- Minersville Area SD (town): math 21% / reading 50% proficiency, ranked #420 of 539 in PA (top 78%) — families likely to look elsewhere, expect single-tenant / working-renter base with shorter leases.
- Market conditions: Rents rising fast (+5.7%/yr); 177 active listings in the ZIP; 1 comparable units currently listed for rent nearby; 169 units permitted in Schuylkill County in 2024 (0 in 5+ unit buildings).
Forward outlook
- Local home prices are declining (-3.0%/yr); year-one equity from $1k of loan paydown is wiped out by about $4k of value loss. Plan a longer hold.
- Schuylkill County population projected at -16% by 2050 — secular population decline; favor cash flow + early exit over multi-decade hold.
Negotiation context
- Only 5 days on market — expect competitive offers; lowballing is unlikely to land.
Risks & watch-outs
- Watch-outs: property tax is 4.8% of price; built in 1900 — expect roof / HVAC / electrical / plumbing capex.
Questions for the listing agent
- What do current leases actually rent for vs. the listed asking? Can we see a recent rent roll and the last 12 months of T-12 income?
- Built in 1900 — when were the roof, HVAC, electrical panel, plumbing, and water heater last replaced?
- Property tax is high relative to price — has the assessment been appealed recently, and will the sale trigger a re-assessment?
- Is there a deadline driving the sale (1031 exchange, divorce, estate, relocation)? That informs how much negotiation room exists.
- The area grade is low — what's the realistic commute time and amenity access for the typical tenant pool here? Any planned neighborhood developments (good or bad) we should know about?
- What's the average days-on-market for RENTAL listings here right now (not sales)? A rising rental-DOM trend means longer vacancies and softer asking-rent achievability than the comps imply.
- What's the recent tenant-quality profile in this submarket — average credit score on applications, eviction rate, late-payment / NSF rate, and stable-employment percentage? A property-management company in the area should have these aggregated.
- How much new for-sale + rental construction is in the pipeline within 1–3 miles? Heavy new supply typically softens prices + rents 12–24 months out; constrained supply supports both.
Investment metrics
- 1% rule
- 1.05% ✓
- Cap rate
- 4.61%
- Cash-on-cash
- -6.02%
- DSCR
- 0.73
- GRM
- 8.0
CMA / ARV
- ARV (median comp)
- $201,794
- List price
- $149,000
- Delta
- -26.16%
- Verdict
- UNDERPRICED
- Comps
- 20 within 1.0 mi
Show comp detail 12 sales within ~0.75 mi
| Address | Dist | Beds/Ba | Sqft | Sold | Price | $/sf | Match |
|---|---|---|---|---|---|---|---|
| 215 S 4th St | 0.73mi | 4/1.5 | 1,586 (-7%) | 5mo | $115,000 | $73 | 48 |
| 521 S 3rd St | 0.49mi | 4/2.0 | 1,620 (-5%) | 21mo | $47,000 | $29 | 47 |
| 2 E Edgar Lewis St | 0.69mi | 3/1.5 (-1) | 1,600 (-6%) | 5mo | $243,000 | $152 | 47 |
| 237 Laurel St | 0.72mi | 3/1.0 (-1) | 1,800 (+6%) | 10mo | $154,900 | $86 | 44 |
| 447-449 S 3rd St | 0.52mi | 4/2.5 | 1,525 (-10%) | 11mo | $124,000 | $81 | 43 |
| 423 Lytle St | 0.56mi | 5/2.0 (+1) | 1,500 (-12%) | 4mo | $158,000 | $105 | 42 |
| 401 Church St | 0.71mi | 5/2.0 (+1) | 1,656 (-3%) | 15mo | $99,900 | $60 | 41 |
| 532 Pine Hill St | 0.48mi | 3/1.5 (-1) | 1,820 (+7%) | 23mo | $113,500 | $62 | 40 |
| 227 Linden St | 0.69mi | 3/1.5 (-1) | 1,635 (-4%) | 21mo | $160,720 | $98 | 37 |
| 419 Coal St | 0.66mi | 3/1.5 (-1) | 1,490 (-13%) | 10mo | $165,000 | $111 | 33 |
| 1160 Bunting St | 0.65mi | 4/2.0 | 1,942 (+14%) | 16mo | $240,000 | $124 | 29 |
| 1484 Bunting St | 0.75mi | 4/2.0 | 1,945 (+14%) | 21mo | $315,000 | $162 | 20 |
Match score weights: distance 35% · size 25% · config 20% · recency 20%. Top-matched comps best support the ARV.
Projected returns pro-forma
-3.0% appreciation · 5.7% rent growth · sell at horizon
- IRR
- -22.1%
- Equity multiple
- 0.21×
- Total profit
- $-32,852
- Equity at exit
- $22,216
- IRR
- -8.5%
- Equity multiple
- 0.38×
- Total profit
- $-25,783
- Equity at exit
- $12,883
Cash invested: $41,720 (down + closing). Projections, not guarantees.
Landlord ↔ Tenant lean methodology
- Overall (STATE)
- 62 Landlord-Friendly
- State Pennsylvania
- 62 Landlord-Friendly · EVEN
- County
- — inherits STATE
- City
- — inherits STATE
ZIP-level market 17901
- Home prices YoY
- -21.2%
- Rents YoY
- 5.7%
- Active inventory
- 177
- Price-to-rent
- 8.0×
Monthly cashflow live
- Estimated rent
- $1,560 medium interval (Pro) →
- Mortgage (P&I)
- −$781
- Tax from tax record
- −$598 /mo · $7,175/yr
- Insurance
- −$62
- HOA
- −$0
- Vacancy / Maint / Mgmt
- −$328
- Net cashflow
- $-209
Break-even live
Sensitivity live
| Price | -10% $305 | -5% $254 | +0% $-209 | +5% $-252 | +10% $-294 |
|---|---|---|---|---|---|
| Rent | -10% $-333 | -5% $-271 | +0% $-209 | +5% $-148 | +10% $-86 |
| Rate | -1.0pp $-134 | -0.5pp $-171 | base $-209 | +0.5pp $-248 | +1.0pp $-287 |
UW: 25.0% down · 7.5% · 30yr · 1.5% tax · 5.0% vac · 8.0% maint · 8.0% mgmt
Financing live
Cash to close
- Down payment
- $37,250
- Closing costs
- $4,470
- Reserves months
- —
- Total cash needed
- —
Loan-product check · same deal, 3 products live
Conventional
25% down · 7.5% · 30yr
- Down + closing
- —
- Monthly P&I
- —
- Monthly cashflow
- —
- DSCR
- —
- Eligible?
- —
Personal DTI + credit; lowest rate.
DSCR
20% down · 8.5% · 30yr
- Down + closing
- —
- Monthly P&I
- —
- Monthly cashflow
- —
- DSCR
- —
- Eligible?
- —
No personal income docs; deal must DSCR.
Hard money
10% down · 12.0% · 12mo
- Down + closing
- —
- Monthly P&I
- —
- Monthly cashflow
- —
- DSCR
- —
- Eligible?
- —
Short-term bridge; refi at stabilization.
Rent comps 1 comps
| Address | Beds | Baths | Sqft | Rent | $/sqft | DOM | Units | Dist |
|---|---|---|---|---|---|---|---|---|
| 504 Laurel St Minersville, PA | 3.0 | 2.0 | 1059 | $1,150 | $1.09 | 44d | 1 | 0.51mi |
Listing history 2 events
-
2026-05-18$149,000 Active 303-char remark
-
2026-05-03historical $149,000 303-char remark
ⓘ Source: listings_history table (triggers on properties + properties_extension) + one-shot
backfill from property_details.listing_events for pre-trigger history.
Tax reassessment forecast PA · Partial reset (capped growth)
- Current annual tax
- $7,175 · $598/mo
- Projected year-2 tax
- $7,175 · $598/mo
- Expected delta
- $0/yr ($0/mo · -0.0%)
ⓘ Screening estimate from a state-policy table — verify with the county assessor before closing.
Climate risk First Street
- Flood 1/10 Low FEMA zone X (unshaded) · 0% chance over 30 yrs
- Wildfire 3/10 Moderate
- Heat 4/10 Moderate 7 d/yr ≥95°F today · 15 d/yr by 30 yrs out
- Wind 4/10 Moderate 8% chance of damaging wind over 30 yrs
- Air quality 2/10 Low 1 unhealthy d/yr today · 3 by 30 yrs out
Nearby sold comps map
Loading sold comps map…
Walkable amenities ~0.75 mi
Loading nearby amenities…
Taxation est. · year 1
- Rental income
- $18,714
- − Mortgage interest
- −$8,346
- − Property taxes
- −$7,175
- − Insurance
- −$745
- − Repairs & maintenance
- −$1,497
- − Management
- −$1,497
- − Depreciation
- −$4,335
- Taxable loss
- −$4,881
- Est. tax savings @ 24.0%
- +$1,171
- After-tax cash flow
- $-1,341/yr
For passive investors: Depreciation is non-cash, so a rental often shows a tax loss while cash-flowing — sheltering income. Rental losses are passive: they offset passive income freely, and up to $25,000/yr can offset ordinary (W-2) income if you actively participate and your MAGI is under $100k (phasing out to $0 by $150k); unused losses carry forward. On sale, claimed depreciation is recaptured at up to 25%, and gains may owe capital-gains tax (a 1031 exchange can defer both). Figures are a year-1 estimate at your 24.0% rate — not tax advice; consult a CPA.
Schools (NCES district)
- District
- Minersville Area SD
- NCES district ID
- 4215510
- Math proficiency
- 21% ▼ -12.00%
- Reading proficiency
- 50% ▼ -8.00%
- Median HH income
- $40,865
- Composite
- 29.77/100
- National rank
- #6433
- State rank
- #420 of 539 in PA
Livability — Llewellyn
No livability data for this city. (Only ~50 U.S. cities are tracked.)
Census & demographics
- County
- Schuylkill County · 22,371 people
- Metro
- Pottsville, PA
- Population (ZIP)
- 22,371
- Household income
- $62,484
- Rent vs Own
- Severe rent burden
- 622.0
Population outlook (Schuylkill County) Hauer SSP2
- Today (2025)
- 137,447 people
- By 2030
- 133,121 · -3.1%
- By 2040
- 124,172 · -9.7%
- By 2050
- 115,611 · -15.9%
- By 2075
- 100,796 · -26.7%
- By 2100
- 86,667 · -36.9%
Race, ethnicity, and origin ACS 2023
- Neighborhood character
- Predominantly White (90%)
- Race & ethnicity
- White 90% Hispanic / Latino 5% Two or more races 3% Black 2%
- Common ancestry
- Romanian 9% Iranian 5% Subsaharan African 3%
- Foreign-born
- 1% · Canada
- Languages at home
- 96% English-only · Spanish 2% German/W. Germanic 1% French/Haitian/Cajun 1%
Political lean MEDSL · Schuylkill
- 2024 margin
- Solid R (+42.1) · D 28.5% · R 70.6%
- 2008→2024 swing
- -33.4pp toward R · 2008: -8.7pp · 2024: -42.1pp
- All cycles
- 2024: R+42.1 2020: R+39.9 2016: R+43.4 2012: R+13.4 2008: R+8.7
Not yet ingested
- Civics
- —
Market trends
- HPI YoY
- ▼ -54.14%
- Current HPI
- 200.6516
- Rent YoY
- ▲ 5.70%
- Metro
- Pottsville, PA
- State GDP YoY
- ▲ 1.68%
- F500 in state
- 34
Industry mix (Fortune 500 HQ in PA)
| Industry | F500 HQs | Revenue |
|---|---|---|
| Healthcare | 2 | $309B |
|
||
| Insurance | 2 | $27B |
|
||
| Telecommunications / Media | 1 | $124B |
|
||
| Industrial Distribution | 1 | $22B |
|
||
| Financial Services | 1 | $20B |
|
||
| Chemicals / Materials | 1 | $18B |
|
||
Price history
+0.0% since first listed3 events — show timeline
- 2026-05-22 Pending — BRIGHT MLS
- 2026-05-18 Listed $149,000 BRIGHT MLS
- 2026-05-03 Coming Soon $149,000 BRIGHT MLS
Property tax history
+12.1%/yrLatest (2026): $7,175 · +187.9% YoY. Source: county tax records.
Cash-flow waterfall
monthlySold comps — $/sqft
last 12 mo · ≤1 miLoading sold comps…