 Fourplex
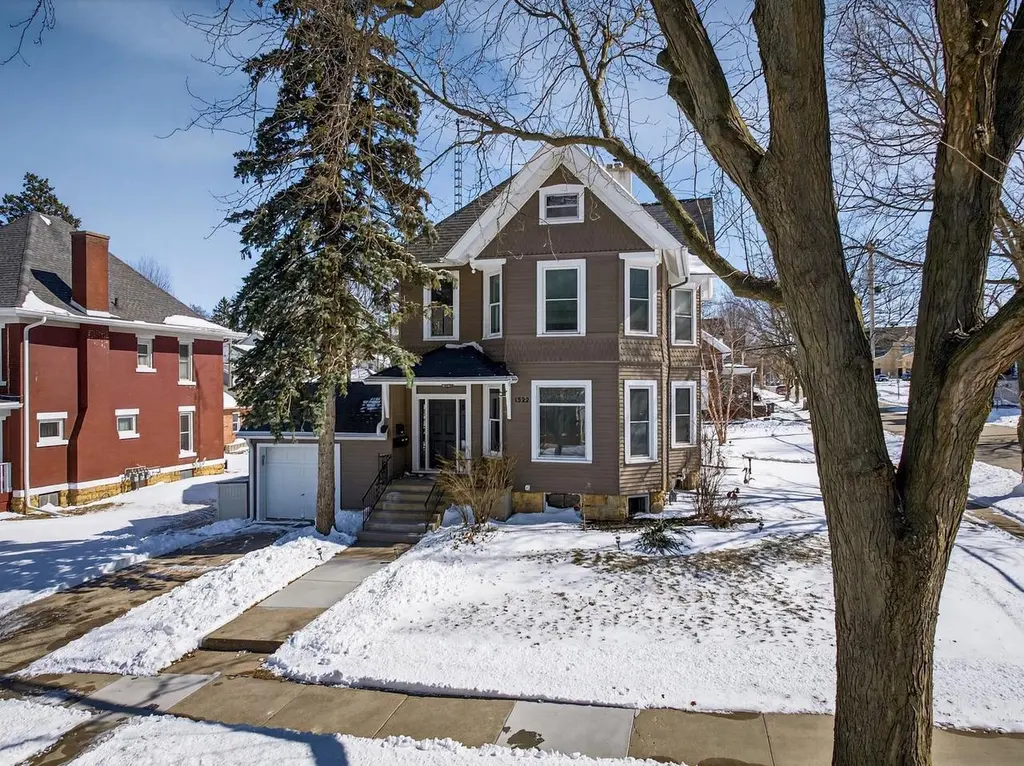
1322 17th Ave · Monroe, WI
Flood risk No data
- FEMA flood zone
- —
- Chance of flooding over 30 yrs
- —
- Est. flood insurance / yr
- —
Fire risk No data
- Est. fire insurance / yr
- —
Heat risk No data
- Hot days now (above threshold)
- —
- Hot days in 30 yrs
- —
Wind risk No data
- Chance of severe wind over 30 yrs
- —
Air-quality risk No data
- Unhealthy air days now
- —
- Unhealthy air days in 30 yrs
- —
Risk factors via First Street. Map © Google.
Why this score? — see what drove the B- grade
The composite is a weighted blend of 9 inputs, each scored 0–100. Each bar is that input's sub-score; the figure is the points it added to the 100-point composite (weight × sub-score).
- Cash flow +29.2/30.0
- DSCR +10.0/10.0
- 1% rule +8.2/10.0
- ARV discount +7.5/15.0
- Livability +4.2/5.0
- Condition / age +3.8/5.0
- Schools +3.1/10.0
- Rent growth +2.5/5.0
- Appreciation +0.0/10.0
$375,000
🖨 Deal sheet 📄 Offer letter ✓ Due diligence
Multi-family units
County records classify this as Multi-Family (2-4 Unit). Listing-text estimate: 4 units. confirmed
Listing remarks
Turnkey 4-unit multifamily in Monroe, WI?ideal for owner-occupant or investor. This ?house hack? opportunity features a spacious main-floor 2BR/1BA unit with updated kitchen, office, large living/dining area, private deck, forced air heat and central air. Three upper 1BR/1BA units offer strong rental income with electric baseboard heat and separately metered utilities. Well-maintained property within walking distance to downtown Monroe and Monroe Middle School. Live in one unit and offset your mortgage with rental income. Excellent cash flow potential, flexible investment strategy, and desirable location make this a standout multifamily property.
Key facts
- Private deck
- Cash flow potential
- Updated kitchen
Tags
Neighborhood map
What this means for you Summary
Snapshot
- This is a 1×2.0bd/1.0ba + 3×1.0bd/1.0ba units multifamily listed at $375k. Condition is rated good.
Deal economics
- At list price, monthly cash flow is $1k ($16k/yr) — positive. Per door: $327/mo.
- The deal already cash-flows at list — no discount required.
- Meets the 1% rule at list price ($5k rent vs $375k).
- Cap rate 10.5% vs local median 2.7% in Monroe — top-decile yield for the area; either an underpriced asset or a hidden risk that comps aren't pricing in. Stress-test before assuming the spread holds.
Location & tenants
- Location reads 84/100 on livability (#32 in WI, #627 nationally) — a professional / high-income tenant draw. Strengths: crime A+, cost of living A+, housing A+; Watch: commute F.
- Monroe School District (town): math 36% / reading 36% proficiency, ranked #215 of 342 in WI (top 63%) — families likely to look elsewhere, expect single-tenant / working-renter base with shorter leases.
- Zoned schools: Monroe High (math 27% / reading 32%, grade F, #228 of 483 statewide, top 52%, 729 students, 37% FRL) — zoned schools at 37% FRL track the district average.
- Market conditions: 132 active listings in the ZIP; 62 units permitted in Green County in 2024 (0 in 5+ unit buildings).
Forward outlook
- Local home prices are declining (-3.0%/yr); year-one equity from $3k of loan paydown is wiped out by about $11k of value loss. Plan a longer hold.
- Green County population projected to shrink 6% by 2050 — rents likely to lag national; underwrite the cash flow, not the appreciation.
- At projected returns (-3.0% appreciation + 3.0% rent growth), your $105k cash investment doubles in ~8 years — after that, you're playing with house money.
Negotiation context
- Only 8 days on market — expect competitive offers; lowballing is unlikely to land.
Risks & watch-outs
- Watch-outs: built in 1874 — expect roof / HVAC / electrical / plumbing capex.
Questions for the listing agent
- Can we see the unit-by-unit rent roll, current vacancy, and any below-market leases? What's the average tenancy length?
- What capital expenditures (roof, boiler, parking lot, exteriors) have been made in the last 5 years, and what's planned in the next 2?
- Built in 1874 — when were the roof, HVAC, electrical panel, plumbing, and water heater last replaced?
- Is there a deadline driving the sale (1031 exchange, divorce, estate, relocation)? That informs how much negotiation room exists.
- What's the average days-on-market for RENTAL listings here right now (not sales)? A rising rental-DOM trend means longer vacancies and softer asking-rent achievability than the comps imply.
- What's the recent tenant-quality profile in this submarket — average credit score on applications, eviction rate, late-payment / NSF rate, and stable-employment percentage? A property-management company in the area should have these aggregated.
- How much new apartment / multifamily construction is in the pipeline within 1–3 miles? Heavy new supply (>2% of stock underway) typically softens rents 12–24 months out; light construction supports rent growth.
Investment metrics
- 1% rule
- 1.32% ✓
- Cap rate
- 10.48%
- Cash-on-cash
- 14.95%
- DSCR
- 1.67
- GRM
- 6.3
CMA / ARV
No comps found within radius.
Projected returns pro-forma
-3.0% appreciation · 3.0% rent growth · sell at horizon
- IRR
- 5.5%
- Equity multiple
- 1.22×
- Total profit
- $22,609
- Equity at exit
- $55,914
- IRR
- 15.0%
- Equity multiple
- 2.21×
- Total profit
- $127,253
- Equity at exit
- $32,423
Cash invested: $105,000 (down + closing). Projections, not guarantees.
Landlord ↔ Tenant lean methodology
- Overall (STATE)
- 73 Landlord-Friendly
- State Wisconsin
- 73 Landlord-Friendly · R+2
- County
- — inherits STATE
- City
- — inherits STATE
ZIP-level market 53566
- Home prices YoY
- -32.3%
- Active inventory
- 132
- Price-to-rent
- 25.3×
Monthly cashflow live
- Estimated rent
- $4,936 high interval (Pro) →
- Mortgage (P&I)
- −$1,967
- Tax est. 1.5%
- −$469 /mo · $5,625/yr
- Insurance
- −$156
- HOA
- −$0
- Vacancy / Maint / Mgmt
- −$1,037
- Net cashflow
- $1,308
Break-even live
4-unit breakdown (identical units grouped — click to expand)
| Units | Beds | Baths | Est. rent |
|---|---|---|---|
| 1× unit | 2.0 | 1 | $1,234 |
| 3× units | 1.0 | 1 | $3,702 |
| #2 | 1.0 | 1 | $1,234 |
| #3 | 1.0 | 1 | $1,234 |
| #4 | 1.0 | 1 | $1,234 |
| Total (4 units) | $4,936 | ||
UW: 25.0% down · 7.5% · 30yr · 1.5% tax · 5.0% vac · 8.0% maint · 8.0% mgmt
Financing live
Cash to close
- Down payment
- $93,750
- Closing costs
- $11,250
- Reserves months
- —
- Total cash needed
- —
Loan-product check · same deal, 3 products live
Conventional
25% down · 7.5% · 30yr
- Down + closing
- —
- Monthly P&I
- —
- Monthly cashflow
- —
- DSCR
- —
- Eligible?
- —
Personal DTI + credit; lowest rate.
DSCR
20% down · 8.5% · 30yr
- Down + closing
- —
- Monthly P&I
- —
- Monthly cashflow
- —
- DSCR
- —
- Eligible?
- —
No personal income docs; deal must DSCR.
Hard money
10% down · 12.0% · 12mo
- Down + closing
- —
- Monthly P&I
- —
- Monthly cashflow
- —
- DSCR
- —
- Eligible?
- —
Short-term bridge; refi at stabilization.
Listing history 2 events
-
2026-03-27status Pending
-
2026-03-19$375,000 Active
ⓘ Source: listings_history table (triggers on properties + properties_extension) + one-shot
backfill from property_details.listing_events for pre-trigger history.
Nearby sold comps map
Loading sold comps map…
Walkable amenities ~0.75 mi
Loading nearby amenities…
Taxation est. · year 1
- Rental income
- $59,232
- − Mortgage interest
- −$21,006
- − Property taxes
- −$5,625
- − Insurance
- −$1,875
- − Repairs & maintenance
- −$4,739
- − Management
- −$4,739
- − Depreciation
- −$10,909
- Taxable income
- $10,340
- Est. tax owed @ 24.0%
- −$2,482
- After-tax cash flow
- $13,213/yr
For passive investors: Depreciation is non-cash, so a rental often shows a tax loss while cash-flowing — sheltering income. Rental losses are passive: they offset passive income freely, and up to $25,000/yr can offset ordinary (W-2) income if you actively participate and your MAGI is under $100k (phasing out to $0 by $150k); unused losses carry forward. On sale, claimed depreciation is recaptured at up to 25%, and gains may owe capital-gains tax (a 1031 exchange can defer both). Figures are a year-1 estimate at your 24.0% rate — not tax advice; consult a CPA.
Condition & rehab AI · 12 photos
This well-maintained 4-unit multifamily property in Monroe, WI is move-in ready with updated kitchens and bathrooms. It offers strong rental income potential and is located within walking distance to downtown and schools.
Value-add opportunities
- Both Paint exterior — Enhances curb appeal and can increase both resale and rental value
- Both Clean gutters — Improves drainage and can increase both resale and rental value
Renovation cost estimate screening
Value-add ROI direction
- Both Paint exterior — Enhances curb appeal and can increase both resale and rental value ↑
- Both Clean gutters — Improves drainage and can increase both resale and rental value ↑
ⓘ Cost ranges are severity-bucket heuristics (US national rule-of-thumb). Get contractor quotes + a written scope before underwriting a rehab budget.
Schools (NCES district)
- District
- Monroe School District
- NCES district ID
- 5509840
- Math proficiency
- 36% ▼ -14.00%
- Reading proficiency
- 36% ▼ -6.00%
- Median HH income
- $47,721
- Composite
- 30.97/100
- National rank
- #6102
- State rank
- #215 of 342 in WI
Livability — Monroe
- Score
- 84/100
- State rank
- #32
- US rank
- #627
Category grades
Schools grade is shown separately in the Schools card above.
Census & demographics
- Census place
- Monroe, WI
- City population
- 14,772
- Population (ZIP)
- 14,772
Population outlook (Green County) Hauer SSP2
- Today (2025)
- 37,753 people
- By 2030
- 37,767 · +0.0%
- By 2040
- 37,101 · -1.7%
- By 2050
- 35,339 · -6.4%
- By 2075
- 30,749 · -18.6%
- By 2100
- 23,786 · -37.0%
Race, ethnicity, and origin ACS 2023
- Neighborhood character
- Predominantly White (90%)
- Race & ethnicity
- White 90% Hispanic / Latino 6% Two or more races 4% Black 1%
- Hispanic origin (detail)
- Mexican 6%
- Common ancestry
- Portuguese 12% Romanian 3% Lithuanian 1%
- Foreign-born
- 2% · Canada
- Languages at home
- 95% English-only · Spanish 4%
Political lean MEDSL · Green
- 2024 margin
- Toss-up / Even · D 49.5% · R 49.2% · Other 1.3%
- 2008→2024 swing
- -25.5pp toward R · 2008: 25.8pp · 2024: 0.3pp
- All cycles
- 2024: D+0.3 2020: D+3.2 2016: D+2.3 2012: D+17.3 2008: D+25.8
Not yet ingested
- Civics
- —
Market trends
- HPI YoY
- ▼ -104.34%
- Current HPI
- 219.1142
- Rent YoY
- —
- Metro
- —
- State GDP YoY
- ▲ 2.10%
- F500 in state
- 20
Industry mix (Fortune 500 HQ in WI)
| Industry | F500 HQs | Revenue |
|---|---|---|
| Industrial Machinery | 4 | $23B |
|
||
| Industrial Technology | 2 | $36B |
|
||
| Insurance | 1 | $36B |
|
||
| Professional Services | 1 | $19B |
|
||
| Utilities | 1 | $9B |
|
||
| Consumer Goods | 1 | $3B |
|
||
Price history
2 events — show timeline
- 2026-03-27 Pending — SCWMLS
- 2026-03-19 Listed $375,000 SCWMLS
Cash-flow waterfall
monthlySold comps — $/sqft
last 12 mo · ≤1 miLoading sold comps…