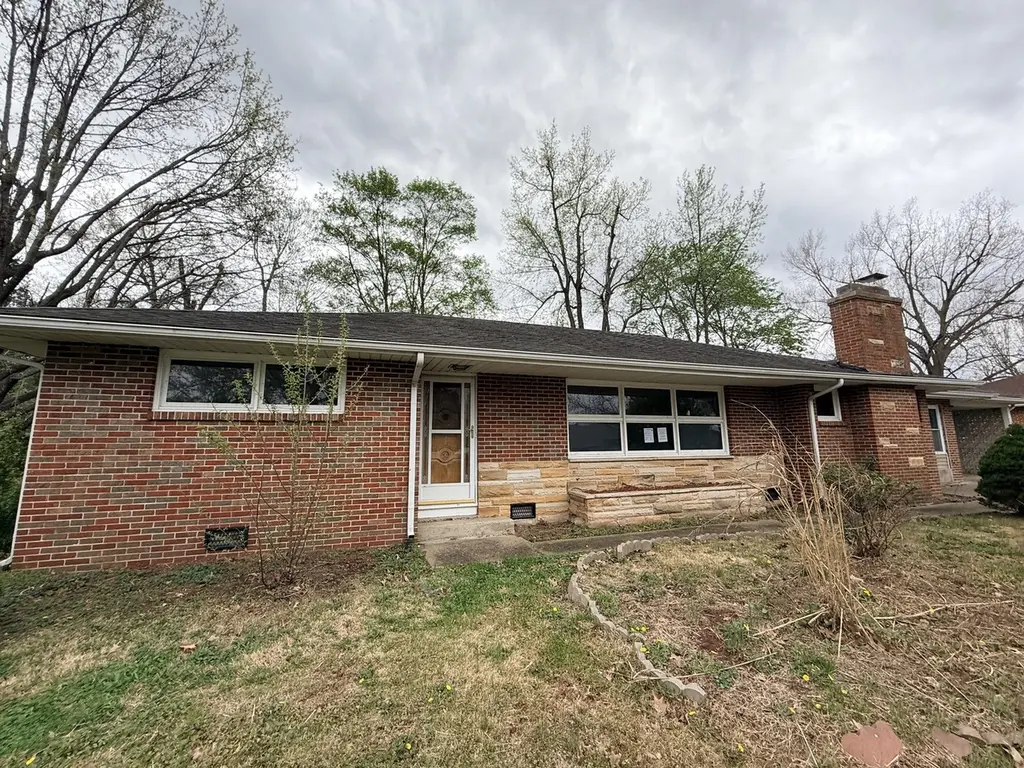
192 Circle Dr · Herrin, IL
Flood risk 1/10 · Minimal
- FEMA flood zone
- X (unshaded)
- Chance of flooding over 30 yrs
- 0.0%
- Est. flood insurance / yr
- $507 – $1,088
Fire risk 3/10 · Minor
- Est. fire insurance / yr
- $804 – $1,492
Heat risk 5/10 · Moderate
- Hot days now (above 107°F)
- 7 days/yr
- Hot days in 30 yrs
- 20 days/yr
Wind risk 2/10 · Minimal
- Chance of severe wind over 30 yrs
- 3.0%
Air-quality risk 2/10 · Minimal
- Unhealthy air days now
- 0 days/yr
- Unhealthy air days in 30 yrs
- 2 days/yr
Risk factors via First Street. Map © Google.
Why this score? — see what drove the B- grade
The composite is a weighted blend of 9 inputs, each scored 0–100. Each bar is that input's sub-score; the figure is the points it added to the 100-point composite (weight × sub-score).
- Cash flow +30.0/30.0
- 1% rule +10.0/10.0
- DSCR +10.0/10.0
- ARV discount +7.5/15.0
- Livability +3.2/5.0
- Rent growth +2.5/5.0
- Condition / age +2.5/5.0
- Schools +2.1/10.0
- Appreciation +0.0/10.0
$90,000
🖨 Deal sheet 📄 Offer letter ✓ Due diligence
Listing remarks MLS
Three bedroom, 1.5 bath large ranch style home with complete fenced in backyard. This home includes a large living room and eat in kitchen, formal dining room, and bonus sun room.
Key facts
- 0.28 acre lot
- Garage
- Built 1956
Neighborhood map
What this means for you Summary
Snapshot
- This is a 3-bed/1.5-bath single-family listed at $90k.
Deal economics
- At list price, monthly cash flow is $398 ($5k/yr) — positive.
- The deal already cash-flows at list — no discount required.
- Meets the 1% rule at list price ($2k rent vs $90k).
- Recommended offer: $89k (1.5% below list) — sets the bar for market timing.
- Cap rate 11.6% vs local median 8.5% in Herrin — top-decile yield for the area; either an underpriced asset or a hidden risk that comps aren't pricing in. Stress-test before assuming the spread holds.
Location & tenants
- Location reads 64/100 on livability (#667 in IL) — a middle-class / working-renter tenant base. Strengths: cost of living A+, housing A+, health & safety B; Watch: crime D-, amenities F, commute F.
- Herrin CUSD 4 (suburban): math 22% / reading 27% proficiency, ranked #364 of 620 in IL (top 59%) — low school quality limits family demand, transient renter base, plan for 1-2y turnover.
- Zoned schools: Herrin High School (math 22% / reading 32%, grade F, #218 of 693 statewide, top 35%, 686 students, 0% FRL) — zoned schools average 0% FRL vs 56% district-wide (56 pts lower); this property's tenant base skews higher-income than the district average.
- Market conditions: 91 active listings in the ZIP; 130 units permitted in Williamson County in 2024 (5 in 5+ unit buildings).
Forward outlook
- Local home prices are declining (-3.0%/yr); year-one equity from $622 of loan paydown is wiped out by about $3k of value loss. Plan a longer hold.
- At projected returns (-3.0% appreciation + 3.0% rent growth), your $25k cash investment doubles in ~7 years — after that, you're playing with house money.
Negotiation context
- It's been on market 27 days — a 2% lower offer ($89k) is reasonable based on typical stale-listing flexibility.
- 10 sale attempts since 23y ago with the ask held roughly flat each time — persistent listings suggest the price (not the market) is what's stuck; bring a comps-based counter.
Risks & watch-outs
- Watch-outs: property tax is 4.1% of price; built in 1956 — expect roof / HVAC / electrical / plumbing capex.
- Climate carrying-cost: extreme-heat days projected 7→20/yr by 2055 (HVAC capex compounding) — expect insurance premiums to compound above CPI over the hold.
Questions for the listing agent
- Built in 1956 — when were the roof, HVAC, electrical panel, plumbing, and water heater last replaced?
- Property tax is high relative to price — has the assessment been appealed recently, and will the sale trigger a re-assessment?
- Is there a deadline driving the sale (1031 exchange, divorce, estate, relocation)? That informs how much negotiation room exists.
- Schools are D-rated, which usually means shorter tenancies and higher turnover. Who's the typical renter profile here, and what's been the actual vacancy rate?
- Crime grade is D in this area — have there been break-ins, vandalism, or insurance claims at this property in the last 3 years? What carrier currently insures it and at what premium?
- What's the average days-on-market for RENTAL listings here right now (not sales)? A rising rental-DOM trend means longer vacancies and softer asking-rent achievability than the comps imply.
- What's the recent tenant-quality profile in this submarket — average credit score on applications, eviction rate, late-payment / NSF rate, and stable-employment percentage? A property-management company in the area should have these aggregated.
- How much new for-sale + rental construction is in the pipeline within 1–3 miles? Heavy new supply typically softens prices + rents 12–24 months out; constrained supply supports both.
Investment metrics
- 1% rule
- 1.71% ✓
- Cap rate
- 11.60%
- Cash-on-cash
- 18.97%
- DSCR
- 1.84
- GRM
- 4.9
CMA / ARV
- ARV (on-the-fly)
- $219,360
- Comps found
- 12
Show comp detail 12 sales within ~0.75 mi
| Address | Dist | Beds/Ba | Sqft | Sold | Price | $/sf | Match |
|---|---|---|---|---|---|---|---|
| 659 Copper Creek Ln | 0.17mi | 3/2.0 | 1,730 (-5%) | 3mo | $267,500 | $155 | 79 |
| 1205 Wildflower Ln | 0.20mi | 4/2.0 (+1) | 1,898 (+4%) | 2mo | $304,000 | $160 | 75 |
| 805 Hilldale Ave | 0.19mi | 3/2.0 | 1,746 (-4%) | 8mo | $174,900 | $100 | 75 |
| 1117 E Ash St | 0.35mi | 3/2.5 | 1,840 (+1%) | 6mo | $65,001 | $35 | 74 |
| 1204 Prestwicke Dr | 0.59mi | 3/2.0 | 1,853 (+1%) | 1mo | $262,500 | $142 | 67 |
| 1104 E Poplar St | 0.36mi | 3/1.5 | 1,664 (-9%) | 4mo | $199,900 | $120 | 65 |
| 1216 S 17th St | 0.69mi | 3/2.0 | 1,832 (+0%) | 2mo | $153,400 | $84 | 64 |
| 401 E Cross St | 0.53mi | 3/2.0 | 1,888 (+3%) | 5mo | $202,500 | $107 | 64 |
| 521 S 5th St | 0.38mi | 4/2.0 (+1) | 1,896 (+4%) | 8mo | $150,000 | $79 | 62 |
| 605 Legacy Dr | 0.47mi | 4/2.0 (+1) | 1,967 (+8%) | 2mo | $258,000 | $131 | 57 |
| 416 Park Ln | 0.17mi | 4/2.0 (+1) | 1,584 (-13%) | 9mo | $152,000 | $96 | 56 |
| 411 Prince Ln | 0.74mi | 4/2.0 (+1) | 1,691 (-8%) | 2mo | $244,250 | $144 | 44 |
Match score weights: distance 35% · size 25% · config 20% · recency 20%. Top-matched comps best support the ARV.
Projected returns pro-forma
-3.0% appreciation · 3.0% rent growth · sell at horizon
- IRR
- 10.9%
- Equity multiple
- 1.43×
- Total profit
- $10,932
- Equity at exit
- $13,419
- IRR
- 20.1%
- Equity multiple
- 2.70×
- Total profit
- $42,770
- Equity at exit
- $7,782
Cash invested: $25,200 (down + closing). Projections, not guarantees.
Landlord ↔ Tenant lean methodology
- Overall (STATE)
- 43 Moderately Tenant-Leaning
- State Illinois
- 43 Moderately Tenant-Leaning · D+7
- County
- — inherits STATE
- City
- — inherits STATE
ZIP-level market 62948
- Home prices YoY
- -34.1%
- Active inventory
- 91
- Price-to-rent
- 4.9×
Monthly cashflow live
- Estimated rent
- $1,536 medium interval (Pro) →
- Mortgage (P&I)
- −$472
- Tax from tax record
- −$306 /mo · $3,671/yr
- Insurance
- −$38
- HOA
- −$0
- Vacancy / Maint / Mgmt
- −$323
- Net cashflow
- $398
Break-even live
UW: 25.0% down · 7.5% · 30yr · 1.5% tax · 5.0% vac · 8.0% maint · 8.0% mgmt
Financing live
Cash to close
- Down payment
- $22,500
- Closing costs
- $2,700
- Reserves months
- —
- Total cash needed
- —
Loan-product check · same deal, 3 products live
Conventional
25% down · 7.5% · 30yr
- Down + closing
- —
- Monthly P&I
- —
- Monthly cashflow
- —
- DSCR
- —
- Eligible?
- —
Personal DTI + credit; lowest rate.
DSCR
20% down · 8.5% · 30yr
- Down + closing
- —
- Monthly P&I
- —
- Monthly cashflow
- —
- DSCR
- —
- Eligible?
- —
No personal income docs; deal must DSCR.
Hard money
10% down · 12.0% · 12mo
- Down + closing
- —
- Monthly P&I
- —
- Monthly cashflow
- —
- DSCR
- —
- Eligible?
- —
Short-term bridge; refi at stabilization.
Listing history 41 events
-
2026-06-19days on market $90,000 Active 27 DOM
-
2026-06-18days on market $90,000 Active 26 DOM
-
2026-06-17days on market $90,000 Active 25 DOM
-
2026-06-16days on market $90,000 Active 24 DOM
-
2026-06-15days on market $90,000 Active 23 DOM
-
2026-06-14days on market $90,000 Active 21 DOM
-
2026-06-13days on market $90,000 Active 20 DOM
-
2026-06-10days on market $90,000 Active 18 DOM
-
2026-06-09days on market $90,000 Active 17 DOM
-
2026-06-08days on market $90,000 Active 16 DOM
-
2026-06-07days on market $90,000 Active 15 DOM
-
2026-06-03days on market $90,000 Active 11 DOM
-
2026-06-02statusdays on market $90,000 Active 10 DOM
-
2026-04-25status Pending
-
2026-04-15$90,000 Active
-
2025-04-25historical
-
2025-04-25historical
-
2025-04-25status Active
-
2025-03-26status Pending
-
2024-06-18Active
-
2022-11-28soldstatus $143,500
-
2022-11-22soldstatus $143,500 Closed 179-char remark
Show marketing remark (179 chars)
Three bedroom, 1.5 bath large ranch style home with complete fenced in backyard. This home includes a large living room and eat in kitchen, formal dining room, and bonus sun room.
-
2022-11-22soldstatus $143,500 179-char remark
Show marketing remark (179 chars)
Three bedroom, 1.5 bath large ranch style home with complete fenced in backyard. This home includes a large living room and eat in kitchen, formal dining room, and bonus sun room.
-
2022-08-29historical Under Contract 179-char remark
Show marketing remark (179 chars)
Three bedroom, 1.5 bath large ranch style home with complete fenced in backyard. This home includes a large living room and eat in kitchen, formal dining room, and bonus sun room.
-
2022-08-25price $139,150 179-char remark
Show marketing remark (179 chars)
Three bedroom, 1.5 bath large ranch style home with complete fenced in backyard. This home includes a large living room and eat in kitchen, formal dining room, and bonus sun room.
-
2022-08-11$142,900 Active 179-char remark
Show marketing remark (179 chars)
Three bedroom, 1.5 bath large ranch style home with complete fenced in backyard. This home includes a large living room and eat in kitchen, formal dining room, and bonus sun room.
-
2022-08-11$139,150 179-char remark
Show marketing remark (179 chars)
Three bedroom, 1.5 bath large ranch style home with complete fenced in backyard. This home includes a large living room and eat in kitchen, formal dining room, and bonus sun room.
-
2021-08-06historical
-
2015-04-29soldstatus $112,500
-
2015-04-29soldstatus $112,500
-
2015-03-25$115,000
-
2015-03-25$115,000
-
2012-11-06soldstatus $85,000
-
2012-11-06soldstatus $85,000
-
2012-11-05soldstatus $85,000
-
2012-05-01$85,000
-
2012-05-01$85,000
-
2012-04-07historical
-
2004-09-07soldstatus $75,000
-
2004-09-03soldstatus $75,000
-
2003-11-20$80,000
ⓘ Source: listings_history table (triggers on properties + properties_extension) + one-shot
backfill from property_details.listing_events for pre-trigger history.
Tax reassessment forecast IL · Partial reset (capped growth)
- Current annual tax
- $3,671 · $306/mo
- Projected year-2 tax
- $3,671 · $306/mo
- Expected delta
- $0/yr ($0/mo · 0.0%)
ⓘ Screening estimate from a state-policy table — verify with the county assessor before closing.
Climate risk First Street
- Flood 1/10 Low FEMA zone X (unshaded) · 0% chance over 30 yrs
- Wildfire 3/10 Moderate
- Heat 5/10 Major 7 d/yr ≥107°F today · 20 d/yr by 30 yrs out
- Wind 2/10 Low 3% chance of damaging wind over 30 yrs
- Air quality 2/10 Low 0 unhealthy d/yr today · 2 by 30 yrs out
Nearby sold comps map
Loading sold comps map…
Walkable amenities ~0.75 mi
Loading nearby amenities…
Taxation est. · year 1
- Rental income
- $18,437
- − Mortgage interest
- −$5,041
- − Property taxes
- −$3,671
- − Insurance
- −$450
- − Repairs & maintenance
- −$1,475
- − Management
- −$1,475
- − Depreciation
- −$2,618
- Taxable income
- $3,707
- Est. tax owed @ 24.0%
- −$890
- After-tax cash flow
- $3,891/yr
For passive investors: Depreciation is non-cash, so a rental often shows a tax loss while cash-flowing — sheltering income. Rental losses are passive: they offset passive income freely, and up to $25,000/yr can offset ordinary (W-2) income if you actively participate and your MAGI is under $100k (phasing out to $0 by $150k); unused losses carry forward. On sale, claimed depreciation is recaptured at up to 25%, and gains may owe capital-gains tax (a 1031 exchange can defer both). Figures are a year-1 estimate at your 24.0% rate — not tax advice; consult a CPA.
Schools (NCES district)
- District
- Herrin CUSD 4
- NCES district ID
- 1718810
- Math proficiency
- 22% ▼ -11.00%
- Reading proficiency
- 27% ▼ -17.00%
- Median HH income
- $38,824
- Composite
- 20.56/100
- National rank
- #8558
- State rank
- #364 of 620 in IL
Livability — Herrin
- Score
- 64/100
- State rank
- #667
- US rank
- #13670
Category grades
Schools grade is shown separately in the Schools card above.
Census & demographics
- Census place
- Herrin, IL
- City population
- 12,728
- Population (ZIP)
- 12,728
Population outlook (Williamson County) Hauer SSP2
- Today (2025)
- 69,553 people
- By 2030
- 70,090 · +0.8%
- By 2040
- 70,345 · +1.1%
- By 2050
- 69,394 · -0.2%
- By 2075
- 63,590 · -8.6%
- By 2100
- 51,154 · -26.5%
Race, ethnicity, and origin ACS 2023
- Neighborhood character
- Predominantly White (85%)
- Race & ethnicity
- White 85% Two or more races 8% Black 5% Hispanic / Latino 4% Native American 1%
- Common ancestry
- Romanian 4% Lithuanian 3% Slovak 2%
- Foreign-born
- 3% · Canada
- Languages at home
- 95% English-only · Spanish 3%
Political lean MEDSL · Williamson
- 2024 margin
- Solid R (+38.8) · D 30.0% · R 68.8% · Other 1.3%
- 2008→2024 swing
- -24.0pp toward R · 2008: -14.8pp · 2024: -38.8pp
- All cycles
- 2024: R+38.8 2020: R+37.3 2016: R+41.2 2012: R+25.0 2008: R+14.8
Not yet ingested
- Civics
- —
Market trends
- HPI YoY
- ▼ -67.82%
- Current HPI
- 131.1617
- Rent YoY
- —
- Metro
- —
- State GDP YoY
- ▲ 1.59%
- F500 in state
- 60
Industry mix (Fortune 500 HQ in IL)
| Industry | F500 HQs | Revenue |
|---|---|---|
| Insurance | 4 | $201B |
|
||
| Consumer Goods | 4 | $87B |
|
||
| Industrial Machinery | 3 | $64B |
|
||
| Healthcare | 2 | $55B |
|
||
| Retail / Pharmacy | 1 | $148B |
|
||
| Agriculture / Food | 1 | $86B |
|
||
Price history
+12.5% since first listed28 events — show timeline
- 2026-04-25 Pending — MRED as Distributed by MLS Grid
- 2026-04-15 Listed $90,000 MRED as Distributed by MLS Grid
- 2025-04-25 Listing Removed — MRED as Distributed by MLS Grid
- 2025-04-25 Listing Removed — RMLSA as Distributed by MLS Grid
- 2025-04-25 Relisted — RMLSA as Distributed by MLS Grid
- 2025-03-26 Pending — RMLSA as Distributed by MLS Grid
- 2024-06-18 Listed — RMLSA as Distributed by MLS Grid
- 2022-11-28 Sold (Public Records) $143,500 Public Records
- 2022-11-22 Sold (MLS) $143,500 MRED as Distributed by MLS Grid
- 2022-11-22 Sold (MLS) $143,500 RMLSA as Distributed by MLS Grid
- 2022-08-29 Contingent — RMLSA as Distributed by MLS Grid
- 2022-08-25 Price Changed $139,150 RMLSA as Distributed by MLS Grid
- 2022-08-11 Listed $139,150 MRED as Distributed by MLS Grid
- 2022-08-11 Listed $142,900 RMLSA as Distributed by MLS Grid
- 2021-08-06 Listing Removed — RMLSA as Distributed by MLS Grid
- 2015-04-29 Sold (MLS) $112,500 RMLSA as Distributed by MLS Grid
- 2015-04-29 Sold (MLS) $112,500 MRED as Distributed by MLS Grid
- 2015-03-25 Listed $115,000 RMLSA as Distributed by MLS Grid
- 2015-03-25 Listed $115,000 MRED as Distributed by MLS Grid
- 2012-11-06 Sold (MLS) $85,000 MRED as Distributed by MLS Grid
- 2012-11-06 Sold (MLS) $85,000 RMLSA as Distributed by MLS Grid
- 2012-11-05 Sold (Public Records) $85,000 Public Records
- 2012-05-01 Listed $85,000 MRED as Distributed by MLS Grid
- 2012-05-01 Listed $85,000 RMLSA as Distributed by MLS Grid
- 2012-04-07 Listing Removed — MRED as Distributed by MLS Grid
- 2004-09-07 Sold (Public Records) $75,000 Public Records
- 2004-09-03 Sold (MLS) $75,000 RMLSA as Distributed by MLS Grid
- 2003-11-20 Listed $80,000 RMLSA as Distributed by MLS Grid
Property tax history
+3.1%/yrLatest (2025): $3,671 · +3.6% YoY. Source: county tax records.
Cash-flow waterfall
monthlySold comps — $/sqft
last 12 mo · ≤1 miLoading sold comps…