112 Dufour St · Moreauville, LA
Flood risk No data
- FEMA flood zone
- —
- Chance of flooding over 30 yrs
- —
- Est. flood insurance / yr
- —
Fire risk No data
- Est. fire insurance / yr
- —
Heat risk No data
- Hot days now (above threshold)
- —
- Hot days in 30 yrs
- —
Wind risk No data
- Chance of severe wind over 30 yrs
- —
Air-quality risk No data
- Unhealthy air days now
- —
- Unhealthy air days in 30 yrs
- —
Risk factors via First Street. Map © Google.
Why this score? — see what drove the B+ grade
The composite is a weighted blend of 9 inputs, each scored 0–100. Each bar is that input's sub-score; the figure is the points it added to the 100-point composite (weight × sub-score).
- Cash flow +30.0/30.0
- 1% rule +10.0/10.0
- DSCR +10.0/10.0
- Appreciation +10.0/10.0
- ARV discount +7.5/15.0
- Livability +3.2/5.0
- Rent growth +2.5/5.0
- Condition / age +2.2/5.0
- Schools +2.1/10.0
$30,000
🖨 Deal sheet (PDF) 📄 Offer letter ✓ Due diligence
Listing remarks
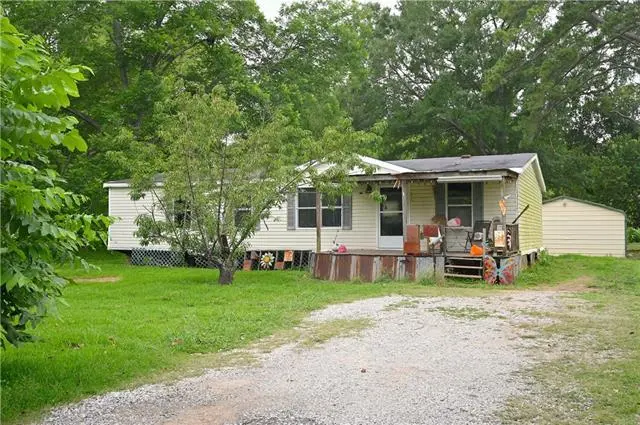
Investment opportunity in a quiet country setting just outside the city limits! This 1999 double-wide mobile home offers 3 bedrooms and 2 bathrooms with plenty of space and potential for improvement. The property includes a small storage shed and covered parking located in the backyard, adding convenience and functionality. While the home does need repairs and updating, it presents an excellent opportunity for investors, landlords, or buyers looking to renovate and add value. Enjoy the peaceful surroundings of country living while still being within easy reach of town amenities. Call for your private showing today!
Key facts
- Covered parking
- Small storage shed
- 0.3 acre lot
Tags
Property features AI
Exterior
- Parking: Carport
- Home design: Manufactured home
- Construction: Vinyl siding; Composition roof
- Exterior features: Workshop; Bounding street: Main Street
Interior
- Kitchen: Kitchen (details not specified)
- Bedrooms: Two bedrooms
- Bathrooms: Two full bathrooms
- Heating & cooling: Central heating; Central air; Window unit(s) for cooling
- Interior features: Living room; Dining room; Kitchen; Bedroom 1; Bedroom 2
- Laundry & utility: Laundry room
Neighborhood map
What this means for you Summary
Snapshot
- This is a 3-bed/2.0-bath manufactured listed at $30k. Condition is rated fair.
Deal economics
- At list price, monthly cash flow is $620 ($7k/yr) — positive.
- The deal already cash-flows at list — no discount required.
- Meets the 1% rule at list price ($1k rent vs $30k).
Location & tenants
- Location reads 63/100 on livability (#204 in LA) — a middle-class / working-renter tenant base. Strengths: cost of living A+, housing A, crime A-; Watch: health & safety C-, amenities F, commute F.
- Avoyelles Parish (rural): math 22% / reading 30% proficiency, ranked #56 of 98 in LA (top 57%) — low school quality limits family demand, transient renter base, plan for 1-2y turnover; 75% free/reduced lunch — lower-income household profile, screen leases tightly.
- Zoned schools: Plaucheville Elementary School (math 22% / reading 36%, grade F, #348 of 646 statewide, top 54%, 610 students, 55% FRL); Avoyelles High School (math 18% / reading 25%, grade F, #177 of 265 statewide, top 67%, 536 students, 53% FRL) — zoned schools average 54% FRL vs 75% district-wide (21 pts lower); this property's tenant base skews higher-income than the district average.
- Market conditions: 15 active listings in the ZIP; 15 units permitted in Avoyelles Parish in 2024 (0 in 5+ unit buildings).
Forward outlook
- In year one you build about $3k of equity ($207 loan paydown + $3k appreciation (10.0% local appreciation)).
- Avoyelles County population projected at -18% by 2050 — secular population decline; favor cash flow + early exit over multi-decade hold.
- At projected returns (10.0% appreciation + 3.0% rent growth), your $8k cash investment doubles in ~1 year — after that, you're playing with house money.
- By year 9, paydown + projected appreciation supports a ~$33k cash-out refi (75% LTV) — recoverable capital for the next deal without selling this one.
Negotiation context
- Only 2 days on market — expect competitive offers; lowballing is unlikely to land.
- 2 sale attempts since 17y ago with the ask held roughly flat each time — persistent listings suggest the price (not the market) is what's stuck; bring a comps-based counter.
Questions for the listing agent
- Have any recent inspections been done? Can we get a copy of the seller's disclosures and any deferred-maintenance estimates?
- Is there a deadline driving the sale (1031 exchange, divorce, estate, relocation)? That informs how much negotiation room exists.
- Schools are D-rated, which usually means shorter tenancies and higher turnover. Who's the typical renter profile here, and what's been the actual vacancy rate?
- What's the average days-on-market for RENTAL listings here right now (not sales)? A rising rental-DOM trend means longer vacancies and softer asking-rent achievability than the comps imply.
- What's the recent tenant-quality profile in this submarket — average credit score on applications, eviction rate, late-payment / NSF rate, and stable-employment percentage? A property-management company in the area should have these aggregated.
- How much new for-sale + rental construction is in the pipeline within 1–3 miles? Heavy new supply typically softens prices + rents 12–24 months out; constrained supply supports both.
Investment metrics
- 1% rule
- 3.49% ✓
- Cap rate
- 31.10%
- Cash-on-cash
- 88.59%
- DSCR
- 4.94
- GRM
- 2.4
CMA / ARV
No comps found within radius.
Projected returns pro-forma
10.0% appreciation · 3.0% rent growth · sell at horizon
- IRR
- 97.8%
- Equity multiple
- 7.65×
- Total profit
- $55,850
- Equity at exit
- $27,026
- IRR
- 93.0%
- Equity multiple
- 16.89×
- Total profit
- $133,441
- Equity at exit
- $58,283
Cash invested: $8,400 (down + closing). Projections, not guarantees.
Landlord ↔ Tenant lean methodology
- Overall (STATE)
- 90 Strongly Landlord-Friendly
- State Louisiana
- 90 Strongly Landlord-Friendly · R+12
- County
- — inherits STATE
- City
- — inherits STATE
ZIP-level market 71355
- Home prices YoY
- 8.2%
- Active inventory
- 15
- Price-to-rent
- 2.4×
Monthly cashflow live
- Estimated rent
- $1,047 medium interval (Pro) →
- Mortgage (P&I)
- −$157
- Tax est. 1.5%
- −$38 /mo · $450/yr
- Insurance
- −$12
- HOA
- −$0
- Vacancy / Maint / Mgmt
- −$220
- Net cashflow
- $620
Break-even live
Sensitivity live
| Price | -10% $641 | -5% $630 | +0% $620 | +5% $610 | +10% $599 |
|---|---|---|---|---|---|
| Rent | -10% $537 | -5% $579 | +0% $620 | +5% $661 | +10% $703 |
| Rate | -1.0pp $635 | -0.5pp $628 | base $620 | +0.5pp $612 | +1.0pp $604 |
UW: 25.0% down · 7.5% · 30yr · 1.5% tax · 5.0% vac · 8.0% maint · 8.0% mgmt
Financing live
Cash to close
- Down payment
- $7,500
- Closing costs
- $900
- Reserves months
- —
- Total cash needed
- —
Loan-product check · same deal, 3 products live
Conventional
25% down · 7.5% · 30yr
- Down + closing
- —
- Monthly P&I
- —
- Monthly cashflow
- —
- DSCR
- —
- Eligible?
- —
Personal DTI + credit; lowest rate.
DSCR
20% down · 8.5% · 30yr
- Down + closing
- —
- Monthly P&I
- —
- Monthly cashflow
- —
- DSCR
- —
- Eligible?
- —
No personal income docs; deal must DSCR.
Hard money
10% down · 12.0% · 12mo
- Down + closing
- —
- Monthly P&I
- —
- Monthly cashflow
- —
- DSCR
- —
- Eligible?
- —
Short-term bridge; refi at stabilization.
Listing history 2 events
-
2026-06-07remarks 622-char remark
-
2026-06-07$30,000 Pending 2 DOM
ⓘ Source: listings_history table (triggers on properties + properties_extension) + one-shot
backfill from property_details.listing_events for pre-trigger history.
Nearby sold comps map
Loading sold comps map…
Walkable amenities ~0.75 mi
Loading nearby amenities…
Taxation est. · year 1
- Rental income
- $12,569
- − Mortgage interest
- −$1,680
- − Property taxes
- −$450
- − Insurance
- −$150
- − Repairs & maintenance
- −$1,005
- − Management
- −$1,005
- − Depreciation
- −$873
- Taxable income
- $7,404
- Est. tax owed @ 24.0%
- −$1,777
- After-tax cash flow
- $5,664/yr
For passive investors: Depreciation is non-cash, so a rental often shows a tax loss while cash-flowing — sheltering income. Rental losses are passive: they offset passive income freely, and up to $25,000/yr can offset ordinary (W-2) income if you actively participate and your MAGI is under $100k (phasing out to $0 by $150k); unused losses carry forward. On sale, claimed depreciation is recaptured at up to 25%, and gains may owe capital-gains tax (a 1031 exchange can defer both). Figures are a year-1 estimate at your 24.0% rate — not tax advice; consult a CPA.
Condition & rehab AI · 12 photos
This 1999 double-wide mobile home requires moderate renovations to improve its condition and increase its value. The kitchen and bathrooms need significant updates, while the exterior siding and landscaping require attention. With proper renovations, this home has the potential to become a move-in-ready investment property.
Repairs flagged
- Major Kitchen cabinets — Severe wear and tear, need replacement.
- Major Bathroom fixtures — Worn and outdated, need replacement.
- Moderate Exterior siding — Weathered and discolored, needs repainting or replacement.
- Minor Landscaping — Overgrown and needs trimming and planting.
Value-add opportunities
- Resale New kitchen cabinets and countertops — Modernizing the kitchen will attract more buyers.
- Resale New bathroom fixtures and fixtures — Updating bathrooms will improve the home's appeal.
- Both Paint interior walls and exterior siding — Fresh paint will improve the home's curb appeal and interior.
- Both Landscaping and yard maintenance — A well-maintained yard will enhance the home's curb appeal and attract more renters.
Renovation cost estimate screening
| Repair item | Severity | Est. cost |
|---|---|---|
| Kitchen cabinets · Severe wear and tear, need replacement. | Major | $15,000–50,000 |
| Bathroom fixtures · Worn and outdated, need replacement. | Major | $15,000–50,000 |
| Exterior siding · Weathered and discolored, needs repainting or replacement. | Moderate | $3,000–15,000 |
| Landscaping · Overgrown and needs trimming and planting. | Minor | $500–3,000 |
| Total estimated repair cost · 4 items | $33,500–118,000 |
Value-add ROI direction
- Resale New kitchen cabinets and countertops — Modernizing the kitchen will attract more buyers. ↑
- Resale New bathroom fixtures and fixtures — Updating bathrooms will improve the home's appeal. ↑
- Both Paint interior walls and exterior siding — Fresh paint will improve the home's curb appeal and interior. ↑
- Both Landscaping and yard maintenance — A well-maintained yard will enhance the home's curb appeal and attract more renters. ↑
ⓘ Cost ranges are severity-bucket heuristics (US national rule-of-thumb). Get contractor quotes + a written scope before underwriting a rehab budget.
Schools (NCES district)
- District
- Avoyelles Parish
- NCES district ID
- 2200150
- Math proficiency
- 22% ▼ -32.00%
- Reading proficiency
- 30% ▼ -29.00%
- Median HH income
- $33,891
- Composite
- 21.32/100
- National rank
- #8378
- State rank
- #56 of 98 in LA
Livability — Moreauville
- Score
- 63/100
- State rank
- #204
- US rank
- #16003
Category grades
Schools grade is shown separately in the Schools card above.
Census & demographics
- Census place
- Moreauville, LA
- Population (ZIP)
- 2,192
Population outlook (Avoyelles County) Hauer SSP2
- Today (2025)
- 39,084 people
- By 2030
- 37,784 · -3.3%
- By 2040
- 35,049 · -10.3%
- By 2050
- 32,225 · -17.5%
- By 2075
- 25,695 · -34.3%
- By 2100
- 18,985 · -51.4%
Race, ethnicity, and origin ACS 2023
- Neighborhood character
- Predominantly White (86%)
- Race & ethnicity
- White 86% Black 12% Two or more races 2%
- Common ancestry
- Lithuanian 32% Italian 2% Slovak 1%
- Foreign-born
- 1%
- Languages at home
- 89% English-only · French/Haitian/Cajun 11%
Political lean MEDSL · Avoyelles
- 2024 margin
- Solid R (+43.1) · D 27.8% · R 71.0% · Other 1.2%
- 2008→2024 swing
- -20.1pp toward R · 2008: -23.1pp · 2024: -43.1pp
- All cycles
- 2024: R+43.1 2020: R+40.8 2016: R+37.0 2012: R+27.0 2008: R+23.1
Not yet ingested
- Civics
- —
Market trends
- HPI YoY
- ▲ 13.03%
- Current HPI
- 172.85
- Rent YoY
- —
- Metro
- —
- State GDP YoY
- ▲ 3.29%
- F500 in state
- 10
Industry mix (Fortune 500 HQ in LA)
| Industry | F500 HQs | Revenue |
|---|---|---|
| Telecommunications | 2 | $23B |
|
||
| Utilities | 1 | $12B |
|
||
| Wholesale / Distribution | 1 | $5B |
|
||
| Advertising | 1 | $2B |
|
||
Price history
+43.5% since first listed3 events — show timeline
- 2026-06-05 Pending — AcadianaMLS
- 2026-06-03 Listed $30,000 AcadianaMLS
- 2009-04-03 Listed $20,900 AcadianaMLS
Cash-flow waterfall
monthlySold comps — $/sqft
last 12 mo · ≤1 miLoading sold comps…