4215 NE 62nd Ave · Minnehaha, WA
Flood risk 1/10 · Minimal
- FEMA flood zone
- X (unshaded)
- Chance of flooding over 30 yrs
- 0.0%
- Est. flood insurance / yr
- $507 – $1,088
Fire risk 1/10 · Minimal
- Est. fire insurance / yr
- $604 – $1,122
Heat risk 3/10 · Minor
- Hot days now (above 91°F)
- 7 days/yr
- Hot days in 30 yrs
- 15 days/yr
Wind risk 1/10 · Minimal
- Chance of severe wind over 30 yrs
- —
Air-quality risk 9/10 · Severe
- Unhealthy air days now
- 15 days/yr
- Unhealthy air days in 30 yrs
- 15 days/yr
Risk factors via First Street. Map © Google.
Why this score? — see what drove the D- grade
The composite is a weighted blend of 9 inputs, each scored 0–100. Each bar is that input's sub-score; the figure is the points it added to the 100-point composite (weight × sub-score).
- ARV discount +15.0/15.0
- Cash flow +7.1/30.0
- Schools +4.3/10.0
- Livability +4.2/5.0
- Rent growth +3.0/5.0
- Condition / age +2.5/5.0
- 1% rule +1.7/10.0
- DSCR +1.3/10.0
- Appreciation +0.0/10.0
$292,500
🖨 Deal sheet (PDF) 📄 Offer letter ✓ Due diligence
Listing remarks MLS
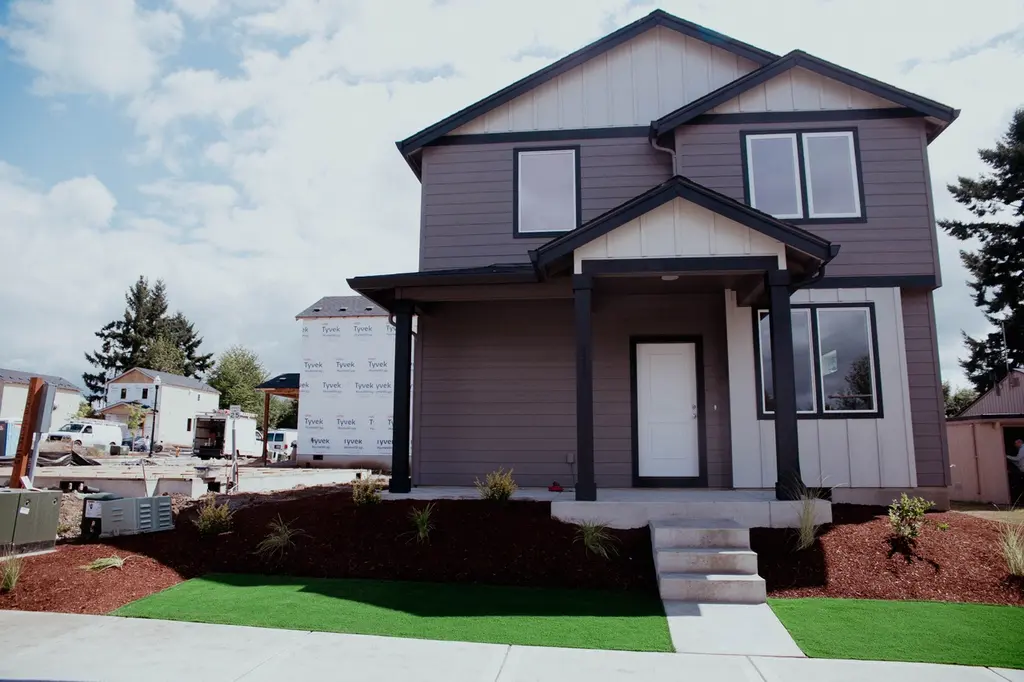
Evergreen Habitat for Humanity is excited to share this new development, 62nd Avenue Homes, featuring gorgeous two-story builds located in Vancouver. These affordable homes features 3 bedroom and 2.5 bathroom layouts with modern fixtures and new appliances such as an oven and dishwasher. Two exterior/interior styles are available: Light or Dark. Please note this listing is available through Evergreen Habitat for Humanity Homeownership Program. Up to $125,000 of financial assistance available for income-qualifying homebuyer applicants. Review our Homeowner Program eligibility guidelines and sign-up for an in-person orientation to get started on your application.
Key facts
- New oven
- New dishwasher
- New microwave
Tags
Neighborhood map
What this means for you Summary
Snapshot
- This is a 3-bed/2.5-bath single-family listed at $292k.
Deal economics
- At list price, monthly cash flow is $-417 ($-5k/yr) — negative.
- To cash-flow at today's rent, offer at most $219k (25.2% below list).
- To meet the 1% rule (rent ≥ 1% of price), the offer needs to be $196k (32.8% below list).
- Recommended offer: $196k (32.8% below list) — sets the bar for 1% rule.
- Cap rate 4.6% vs local median 2.8% in Minnehaha — top-decile yield for the area; either an underpriced asset or a hidden risk that comps aren't pricing in. Stress-test before assuming the spread holds.
Location & tenants
- Location reads 83/100 on livability (#47 in WA, #847 nationally) — a professional / high-income tenant draw. Strengths: commute A+, employment A+, housing A+; Watch: amenities F, cost of living D-.
- Vancouver School District (suburban): math 43% / reading 53% proficiency, ranked #156 of 291 in WA (top 54%) — families likely to look elsewhere, expect single-tenant / working-renter base with shorter leases.
- Market conditions: Rents rising (+2.0%/yr); 266 active listings in the ZIP; 40 comparable units currently listed for rent nearby; rentals leasing fast (median 5d on market — plan ~1-2 weeks tenant-placement turnaround); solid renter incomes; 3,547 units permitted in Clark County in 2024 (1,361 in 5+ unit buildings).
- This rent runs 31% of the median local income ($77k/yr) — at the standard rent-burdened threshold; future hikes will face affordability resistance.
Forward outlook
- Local home prices are declining (-3.0%/yr); year-one equity from $2k of loan paydown is wiped out by about $9k of value loss. Plan a longer hold.
- Clark County population projected at +29% by 2050 — long-run rental-demand tailwind backs the buy-and-hold thesis.
Negotiation context
- It's been on market 229 days — a 12% lower offer ($257k) is reasonable based on typical stale-listing flexibility.
Questions for the listing agent
- What do current leases actually rent for vs. the listed asking? Can we see a recent rent roll and the last 12 months of T-12 income?
- It's been on market 229 days. Have you received any prior offers? Is the seller open to a 33% concession, seller financing, or rate buy-down credit?
- Why hasn't it sold? Are there any deal-killer items the seller is aware of (foundation, flood, title, zoning, code violations)?
- Is there a deadline driving the sale (1031 exchange, divorce, estate, relocation)? That informs how much negotiation room exists.
- The area grade is low — what's the realistic commute time and amenity access for the typical tenant pool here? Any planned neighborhood developments (good or bad) we should know about?
- What's the average days-on-market for RENTAL listings here right now (not sales)? A rising rental-DOM trend means longer vacancies and softer asking-rent achievability than the comps imply.
- What's the recent tenant-quality profile in this submarket — average credit score on applications, eviction rate, late-payment / NSF rate, and stable-employment percentage? A property-management company in the area should have these aggregated.
- How much new for-sale + rental construction is in the pipeline within 1–3 miles? Heavy new supply typically softens prices + rents 12–24 months out; constrained supply supports both.
Investment metrics
- 1% rule
- 0.67% ✗
- Cap rate
- 4.58%
- Cash-on-cash
- -6.11%
- DSCR
- 0.73
- GRM
- 12.4
CMA / ARV
- ARV (median comp)
- $389,806
- List price
- $292,500
- Delta
- -24.96%
- Verdict
- UNDERPRICED
- Comps
- 20 within 1.0 mi
Show comp detail 12 sales within ~0.75 mi
| Address | Dist | Beds/Ba | Sqft | Sold | Price | $/sf | Match |
|---|---|---|---|---|---|---|---|
| 6207 NE 43rd St | 0.02mi | 3/3.0 | 1,499 (+2%) | 2mo | $275,000 | $183 | 93 |
| 4307 NE 62nd Ave | 0.04mi | 3/3.0 | 1,499 (+2%) | 2mo | $275,000 | $183 | 92 |
| 6220 NE 43rd St | 0.06mi | 3/3.0 | 1,499 (+2%) | 1mo | $275,000 | $183 | 91 |
| 6212 NE 43rd St | 0.06mi | 3/3.0 | 1,499 (+2%) | 2mo | $275,000 | $183 | 91 |
| 5904 NE 40th St | 0.17mi | 3/2.0 | 1,362 (-8%) | 2mo | $413,000 | $303 | 76 |
| 5909 NE 33rd Cir | 0.49mi | 3/2.0 | 1,467 (-0%) | 1mo | $374,000 | $255 | 74 |
| 4002 NE 64th Ave | 0.13mi | 3/3.0 | 1,300 (-12%) | 0mo | $400,000 | $308 | 72 |
| 5911 NE 54th St | 0.60mi | 3/3.0 | 1,448 (-2%) | 1mo | $425,000 | $294 | 66 |
| 6019 NE 55th Cir | 0.64mi | 3/2.5 | 1,555 (+6%) | 2mo | $455,000 | $293 | 59 |
| 5514 NE 66th Pl | 0.69mi | 3/2.0 | 1,361 (-8%) | 1mo | $409,995 | $301 | 52 |
| 5518 NE 66th Pl | 0.70mi | 3/2.0 | 1,353 (-8%) | 1mo | $409,995 | $303 | 51 |
| 5519 NE 66th Pl | 0.74mi | 3/2.0 | 1,361 (-8%) | 2mo | $429,995 | $316 | 49 |
Match score weights: distance 35% · size 25% · config 20% · recency 20%. Top-matched comps best support the ARV.
Projected returns pro-forma
-3.0% appreciation · 2.05% rent growth · sell at horizon
- IRR
- -27.8%
- Equity multiple
- 0.07×
- Total profit
- $-75,828
- Equity at exit
- $43,613
- IRR
- -30.2%
- Equity multiple
- -0.32×
- Total profit
- $-107,739
- Equity at exit
- $25,290
Cash invested: $81,900 (down + closing). Projections, not guarantees.
Landlord ↔ Tenant lean methodology
- Overall (STATE)
- 28 Tenant-Leaning
- State Washington
- 28 Tenant-Leaning · D+8
- County
- — inherits STATE
- City
- — inherits STATE
ZIP-level market 98661
- Rents YoY
- 2.0%
- Active inventory
- 266
- Price-to-rent
- 12.4×
Monthly cashflow live
- Estimated rent
- $1,965 high interval (Pro) →
- Mortgage (P&I)
- −$1,534
- Tax from tax record
- −$313 /mo · $3,762/yr
- Insurance
- −$122
- HOA
- −$0
- Vacancy / Maint / Mgmt
- −$413
- Net cashflow
- $-417
Break-even live
Sensitivity live
| Price | -10% $-252 | -5% $-334 | +0% $-417 | +5% $-500 | +10% $-583 |
|---|---|---|---|---|---|
| Rent | -10% $-572 | -5% $-495 | +0% $-417 | +5% $-340 | +10% $-262 |
| Rate | -1.0pp $-270 | -0.5pp $-343 | base $-417 | +0.5pp $-493 | +1.0pp $-570 |
UW: 25.0% down · 7.5% · 30yr · 1.5% tax · 5.0% vac · 8.0% maint · 8.0% mgmt
Financing live
Cash to close
- Down payment
- $73,125
- Closing costs
- $8,775
- Reserves months
- —
- Total cash needed
- —
Loan-product check · same deal, 3 products live
Conventional
25% down · 7.5% · 30yr
- Down + closing
- —
- Monthly P&I
- —
- Monthly cashflow
- —
- DSCR
- —
- Eligible?
- —
Personal DTI + credit; lowest rate.
DSCR
20% down · 8.5% · 30yr
- Down + closing
- —
- Monthly P&I
- —
- Monthly cashflow
- —
- DSCR
- —
- Eligible?
- —
No personal income docs; deal must DSCR.
Hard money
10% down · 12.0% · 12mo
- Down + closing
- —
- Monthly P&I
- —
- Monthly cashflow
- —
- DSCR
- —
- Eligible?
- —
Short-term bridge; refi at stabilization.
Rent comps 40 comps
| Address | Beds | Baths | Sqft | Rent | $/sqft | DOM | Units | Dist |
|---|---|---|---|---|---|---|---|---|
| 4317 NE 66th Ave Vancouver, WA | 1.0–4.0 | 1.0–2.0 | 943 | $1,818 | $1.93 | 4d | 22 | 0.23mi |
| 4555 NE 66th Ave Vancouver, WA | 2.0 | 1.0–2.0 | 962 | $6,375 | $6.63 | 2d | 15 | 0.28mi |
| 4721 NE 66th Ave Vancouver, WA | 1.0–2.0 | 1.0 | 824 | $1,525 | $1.85 | 3d | 2 | 0.32mi |
| 6727 NE Vancouver Mall Dr Vancouver, WA | 2.0–3.0 | 1.0–2.0 | 952 | $1,999 | $2.10 | 2d | 6 | 0.37mi |
| 7104 NE 43rd St Unit 1UNIT C Vancouver, WA | 2.0 | 1.5 | 1000 | $1,995 | $2.00 | 5d | 1 | 0.39mi |
| 3409 NE 62nd Ave Vancouver, WA | 1.0–2.0 | 1.0–2.0 | 918 | $1,575 | $1.72 | 3d | 3 | 0.40mi |
| 5404 NE 45th St Vancouver, WA | 3.0 | 2.0 | 1276 | $2,795 | $2.19 | 8d | 1 | 0.41mi |
| 6820 NE Vancouver Mall Dr Unit A-D Vancouver, WA | 2.0 | 1.5 | 1000 | $1,795 | $1.79 | 24d | 1 | 0.43mi |
| 5750 NE 34th St Vancouver, WA | 3.0 | 1.5 | 980 | $1,995 | $2.04 | 3d | 1 | 0.44mi |
| 4714 NE 72nd Ave Vancouver, WA | 1.0–3.0 | 1.0–2.0 | 1020 | $2,195 | $2.15 | 3d | 10 | 0.44mi |
| 3400 NE 66th Ave Vancouver, WA | 2.0 | 1.0 | 980 | $1,449 | $1.48 | 24d | 1 | 0.47mi |
| 3341 NE 57th Ave Unit 3 Vancouver, WA | 2.0 | 2.0 | 950 | $1,700 | $1.79 | 24d | 1 | 0.51mi |
| 3331 NE 57th Ave Unit 4 Vancouver, WA | 2.0 | 2.0 | 1080 | $1,695 | $1.57 | 5d | 1 | 0.52mi |
| 4701 NE 72nd Ave Vancouver, WA | 1.0–3.0 | 1.0–2.0 | 1000 | $2,225 | $2.23 | 2d | 23 | 0.52mi |
| 3214 NE 62nd Ave Vancouver, WA | 2.0 | 1.0–1.5 | 1074 | $1,512 | $1.41 | 24d | 1 | 0.54mi |
| 3331 NE 57th Ave Apt 8 Vancouver, WA | 2.0 | 2.0 | 1080 | $1,695 | $1.57 | 15d | 1 | 0.54mi |
| 5406 NE 34th St Unit A2 Vancouver, WA | 2.0 | 1.5 | 1014 | $1,995 | $1.97 | 5d | 1 | 0.56mi |
| 5406 NE 34th St Unit A1 Vancouver, WA | 3.0 | 1.5 | 1124 | $2,095 | $1.86 | 5d | 1 | 0.56mi |
| 5406 NE 34th St Unit A2 Vancouver, WA | 2.0 | 1.5 | 1014 | $2,095 | $2.07 | 24d | 1 | 0.56mi |
| 5000 NE 72nd Ave Vancouver, WA | 1.0–2.0 | 1.0–2.0 | 895 | $1,955 | $2.18 | 2d | 9 | 0.56mi |
| 6422 NE Fourth Plain Blvd Vancouver, WA | 2.0 | 1.0 | 930 | $1,299 | $1.40 | 3d | 1 | 0.61mi |
| 7300 NE Vancouver Mall Dr Vancouver, WA | 1.0–2.0 | 1.0–2.0 | 997 | $1,795 | $1.80 | 5d | 7 | 0.62mi |
| 5302 NE 72nd Ave Vancouver, WA | 1.0–2.0 | 1.0–2.0 | 808 | $1,875 | $2.32 | 2d | 8 | 0.63mi |
| 5313 NE 68th Ave Unit D34 Vancouver, WA | 2.0 | 2.0 | 1004 | $1,625 | $1.62 | 22d | 1 | 0.66mi |
| 5313 NE 68th Ave Unit G59 Vancouver, WA | 3.0 | 2.0 | 1212 | $1,825 | $1.51 | 24d | 1 | 0.66mi |
| 5114 NE 34th St Vancouver, WA | 2.0 | 2.0 | 998 | $1,595 | $1.60 | 24d | 1 | 0.68mi |
| 7609 NE Vancouver Mall Dr Vancouver, WA | 2.0 | 2.0 | 1041 | $1,869 | $1.80 | 3d | 1 | 0.68mi |
| 2909 NE 57th Ave Vancouver, WA | 2.0 | 1.5 | 1024 | $1,939 | $1.89 | 2d | 3 | 0.68mi |
| 7070 NE 54th St Vancouver, WA | 1.0–2.0 | 1.0–2.0 | 820 | $1,715 | $2.09 | 2d | 4 | 0.70mi |
| 5917 NE 58th St Vancouver, WA | 1.0–3.0 | 1.0–2.0 | 1162 | $2,075 | $1.78 | 8d | 3 | 0.72mi |
| 7600 NE Vancouver Mall Dr Vancouver, WA | 2.0 | 1.5 | 1180 | $2,195 | $1.86 | 22d | 1 | 0.72mi |
| 4701 NE 77th Ave Unit D16 Vancouver, WA | 3.0 | 2.5 | 1487 | $2,250 | $1.51 | 3d | 1 | 0.75mi |
| 5500 NE Fourth Plain Blvd Vancouver, WA | 1.0–2.0 | 1.0–2.0 | 768 | $1,659 | $2.16 | 3d | 4 | 0.79mi |
| 5301 Plomondon St Unit A6 Vancouver, WA | 2.0 | 2.5 | 1491 | $1,995 | $1.34 | 22d | 1 | 0.81mi |
| 7608 NE 52nd St Vancouver, WA | 3.0 | 2.5 | 1337 | $2,350 | $1.76 | 3d | 1 | 0.83mi |
| 4918 Plomondon St Vancouver, WA | 2.0 | 2.0 | 1000 | $1,695 | $1.70 | 8d | 1 | 0.84mi |
| NE 47 NE 47th Ct Vancouver, WA | 3.0 | 2.5 | 1475 | $2,850 | $1.93 | 2d | 5 | 0.86mi |
| 5811 NE 56th Pl Vancouver, WA | 3.0 | 2.5 | 1608 | $2,495 | $1.55 | 24d | 1 | 0.87mi |
| 4501 NE 51st St Vancouver, WA | 2.0 | 1.0 | 900 | $1,399 | $1.55 | 24d | 1 | 0.87mi |
| 3017 NE Whitman Ave Vancouver, WA | 2.0 | 2.0 | 879 | $1,795 | $2.04 | 5d | 1 | 0.89mi |
Listing history 6 events
-
2026-06-01days on market $292,500 Active 229 DOM
-
2026-05-31days on market $292,500 Active 228 DOM
-
2026-03-17price $292,500 669-char remark
Show marketing remark (669 chars)
Evergreen Habitat for Humanity is excited to share this new development, 62nd Avenue Homes, featuring gorgeous two-story builds located in Vancouver. These affordable homes features 3 bedroom and 2.5 bathroom layouts with modern fixtures and new appliances such as an oven and dishwasher. Two exterior/interior styles are available: Light or Dark. Please note this listing is available through Evergreen Habitat for Humanity Homeownership Program. Up to $125,000 of financial assistance available for income-qualifying homebuyer applicants. Review our Homeowner Program eligibility guidelines and sign-up for an in-person orientation to get started on your application.
-
2026-01-07price $285,000 669-char remark
Show marketing remark (669 chars)
Evergreen Habitat for Humanity is excited to share this new development, 62nd Avenue Homes, featuring gorgeous two-story builds located in Vancouver. These affordable homes features 3 bedroom and 2.5 bathroom layouts with modern fixtures and new appliances such as an oven and dishwasher. Two exterior/interior styles are available: Light or Dark. Please note this listing is available through Evergreen Habitat for Humanity Homeownership Program. Up to $125,000 of financial assistance available for income-qualifying homebuyer applicants. Review our Homeowner Program eligibility guidelines and sign-up for an in-person orientation to get started on your application.
-
2025-10-15$460,000 Active 669-char remark
Show marketing remark (669 chars)
Evergreen Habitat for Humanity is excited to share this new development, 62nd Avenue Homes, featuring gorgeous two-story builds located in Vancouver. These affordable homes features 3 bedroom and 2.5 bathroom layouts with modern fixtures and new appliances such as an oven and dishwasher. Two exterior/interior styles are available: Light or Dark. Please note this listing is available through Evergreen Habitat for Humanity Homeownership Program. Up to $125,000 of financial assistance available for income-qualifying homebuyer applicants. Review our Homeowner Program eligibility guidelines and sign-up for an in-person orientation to get started on your application.
-
2025-07-09soldstatus $675,000
ⓘ Source: listings_history table (triggers on properties + properties_extension) + one-shot
backfill from property_details.listing_events for pre-trigger history.
Tax reassessment forecast WA · Resets to sale price
- Current annual tax
- $3,762 · $313/mo
- Projected year-2 tax
- $3,762 · $313/mo
- Expected delta
- $0/yr ($0/mo · 0.0%)
ⓘ Screening estimate from a state-policy table — verify with the county assessor before closing.
Climate risk First Street
- Flood 1/10 Low FEMA zone X (unshaded) · 0% chance over 30 yrs
- Wildfire 1/10 Low
- Heat 3/10 Moderate 7 d/yr ≥91°F today · 15 d/yr by 30 yrs out
- Wind 1/10 Low
- Air quality 9/10 Extreme 15 unhealthy d/yr today · 15 by 30 yrs out
Nearby sold comps map
Loading sold comps map…
Walkable amenities ~0.75 mi
Loading nearby amenities…
Taxation est. · year 1
- Rental income
- $23,576
- − Mortgage interest
- −$16,385
- − Property taxes
- −$3,762
- − Insurance
- −$1,462
- − Repairs & maintenance
- −$1,886
- − Management
- −$1,886
- − Depreciation
- −$8,509
- Taxable loss
- −$10,314
- Est. tax savings @ 24.0%
- +$2,475
- After-tax cash flow
- $-2,530/yr
For passive investors: Depreciation is non-cash, so a rental often shows a tax loss while cash-flowing — sheltering income. Rental losses are passive: they offset passive income freely, and up to $25,000/yr can offset ordinary (W-2) income if you actively participate and your MAGI is under $100k (phasing out to $0 by $150k); unused losses carry forward. On sale, claimed depreciation is recaptured at up to 25%, and gains may owe capital-gains tax (a 1031 exchange can defer both). Figures are a year-1 estimate at your 24.0% rate — not tax advice; consult a CPA.
Schools (NCES district)
- District
- Vancouver School District
- NCES district ID
- 5309270
- Math proficiency
- 43% ▬ 0.00%
- Reading proficiency
- 53% ▬ 0.00%
- Median HH income
- $52,562
- Composite
- 43.45/100
- National rank
- #6479
- State rank
- #156 of 291 in WA
Livability — Minnehaha
- Score
- 83/100
- State rank
- #47
- US rank
- #847
Category grades
Schools grade is shown separately in the Schools card above.
Census & demographics
- Census place
- Minnehaha, WA
- County
- Clark County · 513,189 people
- Metro
- Portland-Vancouver-Hillsboro, OR-WA
- Population (ZIP)
- 50,743
- Household income
- $76,913
- Rent vs Own
- Severe rent burden
- 2384.0
Population outlook (Clark County) Hauer SSP2
- Today (2025)
- 529,610 people
- By 2030
- 563,242 · +6.4%
- By 2040
- 625,905 · +18.2%
- By 2050
- 681,558 · +28.7%
- By 2075
- 805,967 · +52.2%
- By 2100
- 877,450 · +65.7%
Race, ethnicity, and origin ACS 2023
- Neighborhood character
- Majority White (64%)
- Race & ethnicity
- White 64% Hispanic / Latino 21% Two or more races 14% Black 4% Asian 3% Pacific Islander 2%
- Hispanic origin (detail)
- Mexican 18%
- Common ancestry
- Lithuanian 3% Portuguese 3% Subsaharan African 3%
- Foreign-born
- 15% · Canada, Vietnam
- Languages at home
- 76% English-only · Spanish 14% Russian/Polish/Slavic 4% Other Indo-European 2%
Political lean MEDSL · Clark
- 2024 margin
- Lean D (+7.0) · D 52.1% · R 45.1% · Other 2.8%
- 2008→2024 swing
- +0.9pp no change · 2008: 6.1pp · 2024: 7.0pp
- All cycles
- 2024: D+7.0 2020: D+5.1 2016: D+0.1 2012: D+0.1 2008: D+6.1
Not yet ingested
- Civics
- —
Market trends
- HPI YoY
- ▼ -567.83%
- Current HPI
- 308.3632
- Rent YoY
- ▲ 2.05%
- Metro
- Portland-Vancouver-Hillsboro, OR-WA
- State GDP YoY
- ▲ 4.65%
- F500 in state
- 22
Industry mix (Fortune 500 HQ in WA)
| Industry | F500 HQs | Revenue |
|---|---|---|
| Retail | 2 | $269B |
|
||
| Technology / Retail | 1 | $638B |
|
||
| Technology | 1 | $245B |
|
||
| Telecommunications | 1 | $38B |
|
||
| Food / Beverage | 1 | $36B |
|
||
| Automotive / Trucks | 1 | $34B |
|
||
Price history
-56.7% since first listed4 events — show timeline
- 2026-03-17 Price Changed $292,500 Zillow
- 2026-01-07 Price Changed $285,000 Zillow
- 2025-10-15 Listed $460,000 Zillow
- 2025-07-09 Sold (Public Records) $675,000 Public Records
Property tax history
+1024.6%/yrLatest (2026): $3,762 · +1024.6% YoY. Source: county tax records.
Cash-flow waterfall
monthlySold comps — $/sqft
last 12 mo · ≤1 miLoading sold comps…