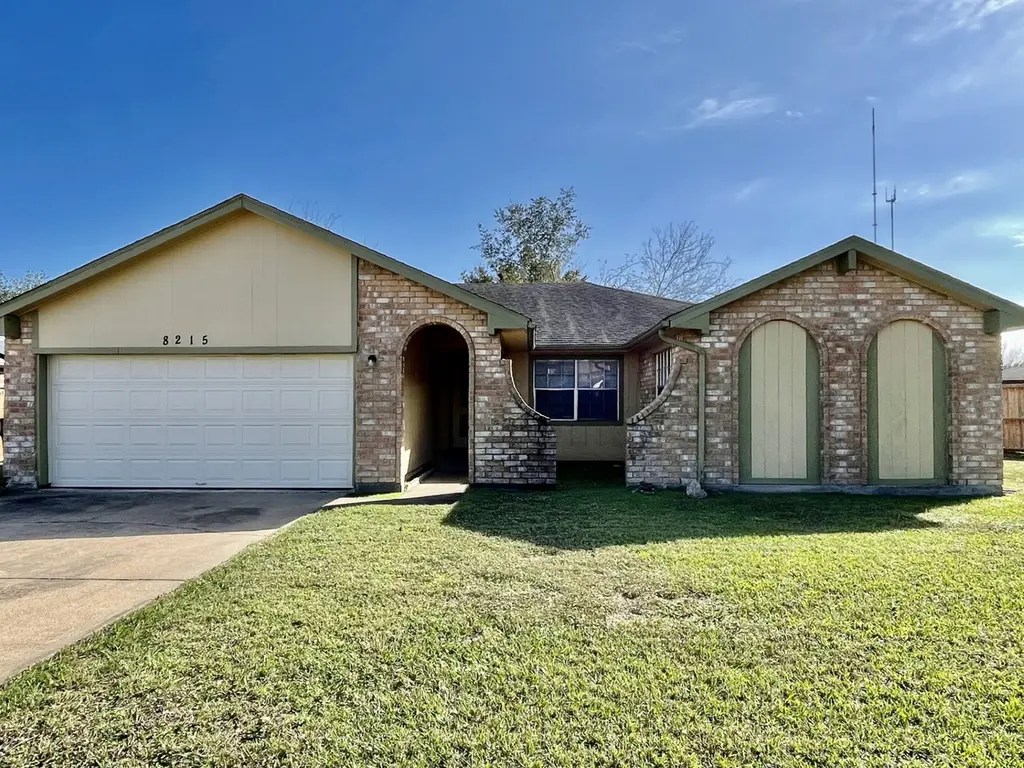
8215 Quail Hills Dr · Houston, TX
Flood risk 4/10 · Minor
- FEMA flood zone
- X (unshaded)
- Chance of flooding over 30 yrs
- 0.22%
- Est. flood insurance / yr
- $507 – $1,088
Fire risk 2/10 · Minimal
- Est. fire insurance / yr
- $1,222 – $2,270
Heat risk 9/10 · Severe
- Hot days now (above 110°F)
- 7 days/yr
- Hot days in 30 yrs
- 24 days/yr
Wind risk 9/10 · Severe
- Chance of severe wind over 30 yrs
- 99.0%
Air-quality risk 3/10 · Minor
- Unhealthy air days now
- 2 days/yr
- Unhealthy air days in 30 yrs
- 3 days/yr
Risk factors via First Street. Map © Google.
Why this score? — see what drove the C- grade
The composite is a weighted blend of 9 inputs, each scored 0–100. Each bar is that input's sub-score; the figure is the points it added to the 100-point composite (weight × sub-score).
- ARV discount +13.7/15.0
- Cash flow +13.3/30.0
- 1% rule +4.7/10.0
- Appreciation +4.7/10.0
- Schools +4.5/10.0
- DSCR +4.0/10.0
- Livability +3.7/5.0
- Rent growth +2.6/5.0
- Condition / age +2.5/5.0
$198,000
🖨 Deal sheet 📄 Offer letter ✓ Due diligence
Listing remarks MLS
This is a four-bedroom, two full-bath home that was previously used as a group home, complete with fire alarm equipment already installed. It needs some cosmetic work but is ready for the next investor or new buyer.
Key facts
- 8,398 sq ft lot
- 2 garage spots
- Built 1980
Neighborhood map
What this means for you Summary
Snapshot
- This is a 3-bed/2.0-bath single-family listed at $198k.
Deal economics
- At list price, monthly cash flow is $1 ($14/yr) — positive.
- The deal already cash-flows at list — no discount required.
- To meet the 1% rule (rent ≥ 1% of price), the offer needs to be $192k (3.3% below list).
- Recommended offer: $174k (12.0% below list) — sets the bar for market timing.
- Cap rate 6.3% vs local median 3.2% in Houston — top-decile yield for the area; either an underpriced asset or a hidden risk that comps aren't pricing in. Stress-test before assuming the spread holds.
Location & tenants
- Location reads 74/100 on livability (#184 in TX, #4,771 nationally) — a middle-class / working-renter tenant base. Strengths: amenities A+, cost of living A+, housing A+; Watch: schools D, crime F.
- Fort Bend ISD (suburban): math 44% / reading 53% proficiency, ranked #140 of 826 in TX (top 17%) — families likely to look elsewhere, expect single-tenant / working-renter base with shorter leases.
- Market conditions: Rents flat; 186 active listings in the ZIP; 10 comparable units currently listed for rent nearby; rentals at typical pace (median 21d on market — plan ~3-4 weeks tenant-placement turnaround); 12,093 units permitted in Fort Bend County in 2024 (815 in 5+ unit buildings).
- This rent runs 31% of the median local income ($75k/yr) — at the standard rent-burdened threshold; future hikes will face affordability resistance.
Forward outlook
- In year one you build about $278 of equity ($1k loan paydown + $-1k appreciation (-0.6% local appreciation)).
- Fort Bend County population projected at +75% by 2050 — long-run rental-demand tailwind backs the buy-and-hold thesis.
Negotiation context
- It's been on market 135 days — a 12% lower offer ($174k) is reasonable based on typical stale-listing flexibility.
- 2 sale attempts since 3y ago; this cycle's ask has dropped $22k (10%) from the opening price — seller is motivated, your offer sets the floor, not the list.
Risks & watch-outs
- Climate carrying-cost: severe wind risk, 99% chance of damaging wind over 30y; extreme-heat days projected 7→24/yr by 2055 (HVAC capex compounding) — expect insurance premiums to compound above CPI over the hold.
Questions for the listing agent
- It's been on market 135 days. Have you received any prior offers? Is the seller open to a 12% concession, seller financing, or rate buy-down credit?
- What does the HOA fee cover, when was the last increase, and are there any pending special assessments or reserve-fund shortfalls?
- Why hasn't it sold? Are there any deal-killer items the seller is aware of (foundation, flood, title, zoning, code violations)?
- Is there a deadline driving the sale (1031 exchange, divorce, estate, relocation)? That informs how much negotiation room exists.
- Schools are D-rated, which usually means shorter tenancies and higher turnover. Who's the typical renter profile here, and what's been the actual vacancy rate?
- Crime grade is F in this area — have there been break-ins, vandalism, or insurance claims at this property in the last 3 years? What carrier currently insures it and at what premium?
- What's the average days-on-market for RENTAL listings here right now (not sales)? A rising rental-DOM trend means longer vacancies and softer asking-rent achievability than the comps imply.
- What's the recent tenant-quality profile in this submarket — average credit score on applications, eviction rate, late-payment / NSF rate, and stable-employment percentage? A property-management company in the area should have these aggregated.
- How much new for-sale + rental construction is in the pipeline within 1–3 miles? Heavy new supply typically softens prices + rents 12–24 months out; constrained supply supports both.
Investment metrics
- 1% rule
- 0.97% ✗
- Cap rate
- 6.30%
- Cash-on-cash
- 0.02%
- DSCR
- 1.00
- GRM
- 8.6
CMA / ARV
- ARV (median comp)
- $229,652
- List price
- $198,000
- Delta
- -13.78%
- Verdict
- UNDERPRICED
- Comps
- 20 within 1.0 mi
Show comp detail 12 sales within ~0.75 mi
| Address | Dist | Beds/Ba | Sqft | Sold | Price | $/sf | Match |
|---|---|---|---|---|---|---|---|
| 16610 Quail Prairie Dr | 0.33mi | 3/2.0 | 1,644 (-0%) | 4mo | $239,500 | $146 | 81 |
| 16626 Quail Run Dr | 0.40mi | 3/2.0 | 1,644 (-0%) | 6mo | $210,000 | $128 | 76 |
| 2507 Rittenmore Dr | 0.26mi | 4/2.0 (+1) | 1,568 (-5%) | 1mo | $235,000 | $150 | 74 |
| 16718 Running Quail Ct | 0.62mi | 3/2.0 | 1,686 (+2%) | 1mo | $235,000 | $139 | 67 |
| 2115 Pepperglen Ct | 0.58mi | 3/2.0 | 1,590 (-4%) | 4mo | $235,000 | $148 | 64 |
| 16614 Quiet Quail Dr | 0.31mi | 4/2.0 (+1) | 1,505 (-9%) | 6mo | $199,999 | $133 | 61 |
| 8434 Quail Crest Dr | 0.59mi | 3/2.0 | 1,560 (-5%) | 3mo | $239,500 | $154 | 61 |
| 2422 Doverglen Dr | 0.26mi | 4/2.5 (+1) | 1,848 (+12%) | 1mo | $249,000 | $135 | 60 |
| 2435 Buttonhill Dr | 0.35mi | 3/2.0 | 1,420 (-14%) | 3mo | $195,000 | $137 | 58 |
| 2211 N Heatherwood Dr | 0.55mi | 3/2.0 | 1,805 (+10%) | 5mo | $268,900 | $149 | 54 |
| 16711 Running Quail Ct | 0.58mi | 4/2.0 (+1) | 1,500 (-9%) | 3mo | $210,000 | $140 | 50 |
| 7539 Maczali Dr | 0.62mi | 4/2.5 (+1) | 1,404 (-15%) | 0mo | $231,660 | $165 | 39 |
Match score weights: distance 35% · size 25% · config 20% · recency 20%. Top-matched comps best support the ARV.
Projected returns pro-forma
-0.55% appreciation · 0.34% rent growth · sell at horizon
- IRR
- -6.4%
- Equity multiple
- 0.72×
- Total profit
- $-15,668
- Equity at exit
- $52,097
- IRR
- -2.4%
- Equity multiple
- 0.78×
- Total profit
- $-12,117
- Equity at exit
- $58,464
Cash invested: $55,440 (down + closing). Projections, not guarantees.
Landlord ↔ Tenant lean methodology
- Overall (STATE)
- 87 Strongly Landlord-Friendly
- State Texas
- 87 Strongly Landlord-Friendly · R+5
- County
- — inherits STATE
- City
- — inherits STATE
ZIP-level market 77489
- Home prices YoY
- -0.2%
- Rents YoY
- 0.3%
- Active inventory
- 186
- Price-to-rent
- 8.6×
Monthly cashflow live
- Estimated rent
- $1,915 high interval (Pro) →
- Mortgage (P&I)
- −$1,038
- Tax from tax record
- −$357 /mo · $4,286/yr
- Insurance
- −$82
- HOA
- −$34
- Vacancy / Maint / Mgmt
- −$402
- Net cashflow
- $1
Break-even live
UW: 25.0% down · 7.5% · 30yr · 1.5% tax · 5.0% vac · 8.0% maint · 8.0% mgmt
Financing live
Cash to close
- Down payment
- $49,500
- Closing costs
- $5,940
- Reserves months
- —
- Total cash needed
- —
Loan-product check · same deal, 3 products live
Conventional
25% down · 7.5% · 30yr
- Down + closing
- —
- Monthly P&I
- —
- Monthly cashflow
- —
- DSCR
- —
- Eligible?
- —
Personal DTI + credit; lowest rate.
DSCR
20% down · 8.5% · 30yr
- Down + closing
- —
- Monthly P&I
- —
- Monthly cashflow
- —
- DSCR
- —
- Eligible?
- —
No personal income docs; deal must DSCR.
Hard money
10% down · 12.0% · 12mo
- Down + closing
- —
- Monthly P&I
- —
- Monthly cashflow
- —
- DSCR
- —
- Eligible?
- —
Short-term bridge; refi at stabilization.
Rent comps 10 comps
| Address | Beds | Baths | Sqft | Rent | $/sqft | DOM | Units | Dist |
|---|---|---|---|---|---|---|---|---|
| 16310 Setter Ct Missouri City, TX | 3.0 | 2.0 | 1672 | $1,700 | $1.02 | 44d | 1 | 0.12mi |
| 712 Beechbend Dr Missouri City, TX | 4.0 | 2.5 | 2245 | $2,250 | $1.00 | 21d | 1 | 0.54mi |
| 15823 Baybriar Dr Missouri City, TX | 3.0 | 2.0 | 1335 | $1,641 | $1.23 | 5d | 1 | 0.69mi |
| 1215 New Tree Ln Missouri City, TX | 3.0 | 2.0 | 1323 | $1,725 | $1.30 | 13d | 1 | 0.78mi |
| 15703 Baybriar Dr Missouri City, TX | 3.0 | 2.0 | 1252 | $1,615 | $1.29 | 20d | 1 | 0.85mi |
| 507 Whippoorwill Dr Missouri City, TX | 3.0 | 2.0 | 1970 | $1,925 | $0.98 | 44d | 1 | 1.18mi |
| 17318 Edgehaven Dr Missouri City, TX | 3.0 | 2.0 | 1448 | $1,695 | $1.17 | 21d | 1 | 1.20mi |
| 1806 Courtside Place Dr Missouri City, TX | 4.0 | 2.5 | 1974 | $1,915 | $0.97 | 13d | 1 | 1.21mi |
| 1919 Doliver Cir Missouri City, TX | 3.0 | 2.0 | 1515 | $2,000 | $1.32 | 44d | 1 | 1.32mi |
| 2026 Summer Place Dr Missouri City, TX | 3.0 | 2.0 | 1837 | $1,861 | $1.01 | 21d | 1 | 1.39mi |
HOA detail
- Monthly dues
- $34 · $408/yr
Listing history 18 events
-
2026-06-18days on market $198,000 Active 135 DOM
-
2026-06-17days on market $198,000 Active 134 DOM
-
2026-06-16days on market $198,000 Active 133 DOM
-
2026-06-15days on market $198,000 Active 132 DOM
-
2026-06-13pricedays on market $198,000 Active 130 DOM
-
2026-06-09days on market $205,000 Active 126 DOM
-
2026-06-07statusdays on market $205,000 Active 124 DOM
-
2026-06-04statusdays on market $205,000 Pending 121 DOM
-
2026-06-03days on market $205,000 Active 120 DOM
-
2026-06-02days on market $205,000 Active 119 DOM
-
2026-06-01days on market $205,000 Active 118 DOM
-
2026-05-31days on market $205,000 Active 117 DOM
-
2026-03-20price $205,000 215-char remark
Show marketing remark (215 chars)
This is a four-bedroom, two full-bath home that was previously used as a group home, complete with fire alarm equipment already installed. It needs some cosmetic work but is ready for the next investor or new buyer.
-
2026-02-03$220,000 Active 215-char remark
Show marketing remark (215 chars)
This is a four-bedroom, two full-bath home that was previously used as a group home, complete with fire alarm equipment already installed. It needs some cosmetic work but is ready for the next investor or new buyer.
-
2024-03-06historical $1,800
-
2023-12-20$1,800
-
2005-07-14soldstatus
-
1999-04-16soldstatus
ⓘ Source: listings_history table (triggers on properties + properties_extension) + one-shot
backfill from property_details.listing_events for pre-trigger history.
Tax reassessment forecast TX · Resets to sale price
- Current annual tax
- $4,286 · $357/mo
- Projected year-2 tax
- $4,286 · $357/mo
- Expected delta
- $0/yr ($0/mo · 0.0%)
ⓘ Screening estimate from a state-policy table — verify with the county assessor before closing.
Climate risk First Street
- Flood 4/10 Moderate FEMA zone X (unshaded) · 22% chance over 30 yrs
- Wildfire 2/10 Low
- Heat 9/10 Extreme 7 d/yr ≥110°F today · 24 d/yr by 30 yrs out
- Wind 9/10 Extreme 99% chance of damaging wind over 30 yrs
- Air quality 3/10 Moderate 2 unhealthy d/yr today · 3 by 30 yrs out
Nearby sold comps map
Loading sold comps map…
Walkable amenities ~0.75 mi
Loading nearby amenities…
Taxation est. · year 1
- Rental income
- $22,985
- − Mortgage interest
- −$11,091
- − Property taxes
- −$4,286
- − Insurance
- −$990
- − Repairs & maintenance
- −$1,839
- − Management
- −$1,839
- − HOA
- −$408
- − Depreciation
- −$5,760
- Taxable loss
- −$3,228
- Est. tax savings @ 24.0%
- +$775
- After-tax cash flow
- $788/yr
For passive investors: Depreciation is non-cash, so a rental often shows a tax loss while cash-flowing — sheltering income. Rental losses are passive: they offset passive income freely, and up to $25,000/yr can offset ordinary (W-2) income if you actively participate and your MAGI is under $100k (phasing out to $0 by $150k); unused losses carry forward. On sale, claimed depreciation is recaptured at up to 25%, and gains may owe capital-gains tax (a 1031 exchange can defer both). Figures are a year-1 estimate at your 24.0% rate — not tax advice; consult a CPA.
Schools (NCES district)
- District
- Fort Bend ISD
- NCES district ID
- 4819650
- Math proficiency
- 44% ▼ -15.00%
- Reading proficiency
- 53% ▼ -4.00%
- Median HH income
- $82,360
- Composite
- 44.61/100
- National rank
- #2779
- State rank
- #140 of 826 in TX
Livability — Houston
- Score
- 74/100
- State rank
- #184
- US rank
- #4771
Category grades
Schools grade is shown separately in the Schools card above.
Census & demographics
- Census place
- Houston, TX
- County
- Fort Bend County · 836,777 people
- City population
- 3,226,434
- Metro
- Houston-The Woodlands-Sugar Land, TX
- Population (ZIP)
- 39,292
- Household income
- $74,689
- Rent vs Own
- Severe rent burden
- 1121.0
Population outlook (Fort Bend County) Hauer SSP2
- Today (2025)
- 1,004,526 people
- By 2030
- 1,153,104 · +14.8%
- By 2040
- 1,453,718 · +44.7%
- By 2050
- 1,753,781 · +74.6%
- By 2075
- 2,455,772 · +144.5%
- By 2100
- 2,930,528 · +191.7%
Race, ethnicity, and origin ACS 2023
- Neighborhood character
- Majority Black (60%)
- Race & ethnicity
- Black 60% Hispanic / Latino 29% Two or more races 13% White 4% Asian 3%
- Hispanic origin (detail)
- Mexican 17%
- Foreign-born
- 16% · Canada, Vietnam
- Languages at home
- 73% English-only · Spanish 22% Vietnamese 1% Other Asian/Pacific 1%
Political lean MEDSL · Fort Bend
- 2024 margin
- Toss-up / Even · D 49.5% · R 47.9% · Other 2.6%
- 2008→2024 swing
- +4.0pp toward D · 2008: -2.4pp · 2024: 1.6pp
- All cycles
- 2024: D+1.6 2020: D+10.6 2016: D+6.6 2012: R+6.8 2008: R+2.4
Not yet ingested
- Civics
- —
Market trends
- HPI YoY
- ▼ -0.55%
- Current HPI
- 288.1306
- Rent YoY
- ▲ 0.34%
- Metro
- Houston-The Woodlands-Sugar Land, TX
- State GDP YoY
- ▲ 3.95%
- F500 in state
- 110
Industry mix (Fortune 500 HQ in TX)
| Industry | F500 HQs | Revenue |
|---|---|---|
| Energy | 16 | $1,198B |
|
||
| Technology | 5 | $198B |
|
||
| Engineering / Construction | 4 | $72B |
|
||
| Energy Services | 3 | $60B |
|
||
| Utilities | 3 | $41B |
|
||
| Healthcare | 2 | $330B |
|
||
Price history
+11288.9% since first listed6 events — show timeline
- 2026-03-20 Price Changed $205,000 HARMLS
- 2026-02-03 Listed $220,000 HARMLS
- 2024-03-06 Rental Removed $1,800 HARMLS
- 2023-12-20 Listed for Rent $1,800 HARMLS
- 2005-07-14 Sold (Public Records) — Public Records
- 1999-04-16 Sold (Public Records) — Public Records
Property tax history
+3.4%/yrLatest (2025): $4,286 · -5.9% YoY. Source: county tax records.
Cash-flow waterfall
monthlySold comps — $/sqft
last 12 mo · ≤1 miLoading sold comps…