101 W Louisiana Ave · Anadarko, OK
Flood risk 1/10 · Minimal
- FEMA flood zone
- X (unshaded)
- Chance of flooding over 30 yrs
- 0.0%
- Est. flood insurance / yr
- $507 – $1,088
Fire risk 8/10 · Major
- Est. fire insurance / yr
- $2,463 – $4,575
Heat risk 6/10 · Moderate
- Hot days now (above 107°F)
- 7 days/yr
- Hot days in 30 yrs
- 19 days/yr
Wind risk 2/10 · Minimal
- Chance of severe wind over 30 yrs
- 3.0%
Air-quality risk 2/10 · Minimal
- Unhealthy air days now
- 1 days/yr
- Unhealthy air days in 30 yrs
- 1 days/yr
Risk factors via First Street. Map © Google.
Why this score? — see what drove the B- grade
The composite is a weighted blend of 9 inputs, each scored 0–100. Each bar is that input's sub-score; the figure is the points it added to the 100-point composite (weight × sub-score).
- Cash flow +30.0/30.0
- 1% rule +10.0/10.0
- DSCR +10.0/10.0
- ARV discount +7.5/15.0
- Livability +2.9/5.0
- Appreciation +2.8/10.0
- Rent growth +2.5/5.0
- Condition / age +2.5/5.0
- Schools +1.1/10.0
$23,000
🖨 Deal sheet (PDF) 📄 Offer letter ✓ Due diligence
Listing remarks
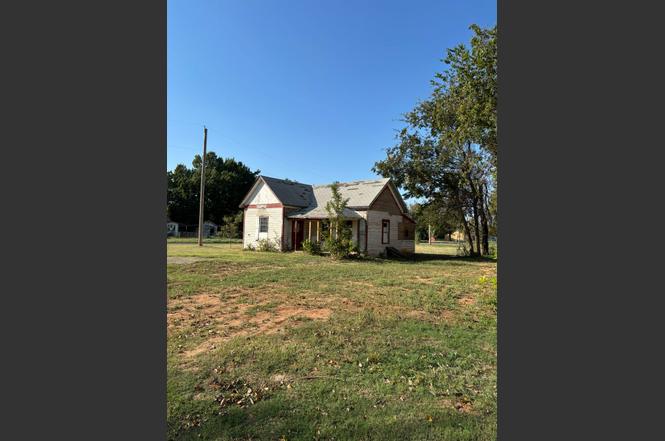
This707 square foot single family home has 1 bedroom and 1 bathroom. This home is located at 101 E. Louisiana Ave. Anadarko, OK. 73005. it has high ceilings, a cellar, some updated windows. And has great bones. It needs some remodeling.
Key facts
- Cellar
- Updated windows
- High ceilings
Tags
Property features AI
Exterior
- Home design: House
- Exterior features: Lot of approximately 7,013 sq ft
Neighborhood map
What this means for you Summary
Snapshot
- This is a 2-bed/1.0-bath single-family listed at $23k.
Deal economics
- At list price, monthly cash flow is $499 ($6k/yr) — positive.
- The deal already cash-flows at list — no discount required.
- Meets the 1% rule at list price ($820 rent vs $23k).
- Recommended offer: $20k (12.0% below list) — sets the bar for market timing.
Location & tenants
- Location reads 57/100 on livability (#483 in OK) — a working-class tenant base; expect higher turnover. Strengths: cost of living A+, housing A+; Watch: crime F, amenities F, commute F.
- Anadarko (town): math 12% / reading 14% proficiency, ranked #245 of 270 in OK (top 91%) — low school quality limits family demand, transient renter base, plan for 1-2y turnover; 75% free/reduced lunch — lower-income household profile, screen leases tightly.
- Zoned schools: Anadarko East Es (math 27% / reading 17%, grade F, #413 of 845 statewide, top 54%, 306 students, 0% FRL); Anadarko Ms (math 8% / reading 14%, grade F, #275 of 345 statewide, top 80%, 303 students, 0% FRL); Anadarko Hs (math 12% / reading 12%, grade F, #359 of 447 statewide, top 80%, 409 students, 0% FRL) — zoned schools average 0% FRL vs 75% district-wide (75 pts lower); this property's tenant base skews higher-income than the district average.
- Market conditions: 30 active listings in the ZIP; 1 comparable units currently listed for rent nearby.
Forward outlook
- Local home prices are declining (-3.0%/yr); year-one equity from $159 of loan paydown is wiped out by about $690 of value loss. Plan a longer hold.
- Caddo County population projected to shrink 7% by 2050 — rents likely to lag national; underwrite the cash flow, not the appreciation.
- At projected returns (-3.0% appreciation + 3.0% rent growth), your $6k cash investment doubles in ~2 years — after that, you're playing with house money.
Negotiation context
- It's been on market 232 days — a 12% lower offer ($20k) is reasonable based on typical stale-listing flexibility.
- Current owner paid $17k; 35% above their basis — modest negotiation headroom, anchor on the comps not their cost.
Risks & watch-outs
- Watch-outs: built in 1915 — expect roof / HVAC / electrical / plumbing capex.
- Climate carrying-cost: severe wildfire risk; extreme-heat days projected 7→19/yr by 2055 (HVAC capex compounding) — expect insurance premiums to compound above CPI over the hold.
Questions for the listing agent
- It's been on market 232 days. Have you received any prior offers? Is the seller open to a 12% concession, seller financing, or rate buy-down credit?
- Built in 1915 — when were the roof, HVAC, electrical panel, plumbing, and water heater last replaced?
- Why hasn't it sold? Are there any deal-killer items the seller is aware of (foundation, flood, title, zoning, code violations)?
- Is there a deadline driving the sale (1031 exchange, divorce, estate, relocation)? That informs how much negotiation room exists.
- Schools are F-rated, which usually means shorter tenancies and higher turnover. Who's the typical renter profile here, and what's been the actual vacancy rate?
- Crime grade is F in this area — have there been break-ins, vandalism, or insurance claims at this property in the last 3 years? What carrier currently insures it and at what premium?
- What's the average days-on-market for RENTAL listings here right now (not sales)? A rising rental-DOM trend means longer vacancies and softer asking-rent achievability than the comps imply.
- What's the recent tenant-quality profile in this submarket — average credit score on applications, eviction rate, late-payment / NSF rate, and stable-employment percentage? A property-management company in the area should have these aggregated.
- How much new for-sale + rental construction is in the pipeline within 1–3 miles? Heavy new supply typically softens prices + rents 12–24 months out; constrained supply supports both.
Investment metrics
- 1% rule
- 3.57% ✓
- Cap rate
- 32.32%
- Cash-on-cash
- 92.95%
- DSCR
- 5.14
- GRM
- 2.3
CMA / ARV
- ARV (on-the-fly)
- $75,472
- Comps found
- 4
Show comp detail 4 sales within ~0.75 mi
| Address | Dist | Beds/Ba | Sqft | Sold | Price | $/sf | Match |
|---|---|---|---|---|---|---|---|
| 314 W Kentucky Ave | 0.35mi | 2/1.5 | 952 (+12%) | 1mo | $89,900 | $94 | 60 |
| 111 E Alabama Ave | 0.11mi | 3/1.0 (+1) | 951 (+12%) | 13mo | $84,900 | $89 | 59 |
| 711 W Texas Ave | 0.58mi | 2/1.0 | 912 (+8%) | 14mo | $47,000 | $52 | 49 |
| 721 Mission Pl | 0.61mi | 3/2.0 (+1) | 947 (+12%) | 6mo | $82,000 | $87 | 38 |
Match score weights: distance 35% · size 25% · config 20% · recency 20%. Top-matched comps best support the ARV.
Projected returns pro-forma
-3.0% appreciation · 3.0% rent growth · sell at horizon
- IRR
- 93.7%
- Equity multiple
- 5.36×
- Total profit
- $28,051
- Equity at exit
- $3,429
- IRR
- 96.5%
- Equity multiple
- 11.15×
- Total profit
- $65,364
- Equity at exit
- $1,989
Cash invested: $6,440 (down + closing). Projections, not guarantees.
Landlord ↔ Tenant lean methodology
- Overall (STATE)
- 83 Strongly Landlord-Friendly
- State Oklahoma
- 83 Strongly Landlord-Friendly · R+20
- County
- — inherits STATE
- City
- — inherits STATE
ZIP-level market 73005
- Home prices YoY
- -3.2%
- Active inventory
- 30
- Price-to-rent
- 2.3×
Monthly cashflow live
- Estimated rent
- $820 medium interval (Pro) →
- Mortgage (P&I)
- −$121
- Tax from tax record
- −$19 /mo · $225/yr
- Insurance
- −$10
- HOA
- −$0
- Vacancy / Maint / Mgmt
- −$172
- Net cashflow
- $499
Break-even live
Sensitivity live
| Price | -10% $512 | -5% $505 | +0% $499 | +5% $492 | +10% $486 |
|---|---|---|---|---|---|
| Rent | -10% $434 | -5% $466 | +0% $499 | +5% $531 | +10% $564 |
| Rate | -1.0pp $510 | -0.5pp $505 | base $499 | +0.5pp $493 | +1.0pp $487 |
UW: 25.0% down · 7.5% · 30yr · 1.5% tax · 5.0% vac · 8.0% maint · 8.0% mgmt
Financing live
Cash to close
- Down payment
- $5,750
- Closing costs
- $690
- Reserves months
- —
- Total cash needed
- —
Loan-product check · same deal, 3 products live
Conventional
25% down · 7.5% · 30yr
- Down + closing
- —
- Monthly P&I
- —
- Monthly cashflow
- —
- DSCR
- —
- Eligible?
- —
Personal DTI + credit; lowest rate.
DSCR
20% down · 8.5% · 30yr
- Down + closing
- —
- Monthly P&I
- —
- Monthly cashflow
- —
- DSCR
- —
- Eligible?
- —
No personal income docs; deal must DSCR.
Hard money
10% down · 12.0% · 12mo
- Down + closing
- —
- Monthly P&I
- —
- Monthly cashflow
- —
- DSCR
- —
- Eligible?
- —
Short-term bridge; refi at stabilization.
Rent comps 1 comps
| Address | Beds | Baths | Sqft | Rent | $/sqft | DOM | Units | Dist |
|---|---|---|---|---|---|---|---|---|
| 404 E Texas Dr Anadarko, OK | 3.0 | 1.0 | 1023 | $820 | $0.80 | 3d | 1 | 0.33mi |
Listing history 19 events
-
2026-06-21days on market $23,000 Active 232 DOM
-
2026-06-21days on market $23,000 Active 231 DOM
-
2026-06-18days on market $23,000 Active 229 DOM
-
2026-06-17days on market $23,000 Active 228 DOM
-
2026-06-16days on market $23,000 Active 227 DOM
-
2026-06-15days on market $23,000 Active 226 DOM
-
2026-06-13days on market $23,000 Active 224 DOM
-
2026-06-12days on market $23,000 Active 223 DOM
-
2026-06-09days on market $23,000 Active 220 DOM
-
2026-06-08days on market $23,000 Active 219 DOM
-
2026-06-08days on market $23,000 Active 218 DOM
-
2026-06-07days on market $23,000 Active 217 DOM
-
2026-06-04days on market $23,000 Active 214 DOM
-
2026-06-02days on market $23,000 Active 213 DOM
-
2026-06-01days on market $23,000 Active 212 DOM
-
2026-05-31days on market $23,000 Active 211 DOM
-
2025-11-01$23,000 Active
-
2005-12-09soldstatus $17,000
-
2000-03-23soldstatus $9,000
ⓘ Source: listings_history table (triggers on properties + properties_extension) + one-shot
backfill from property_details.listing_events for pre-trigger history.
Tax reassessment forecast OK · Resets to sale price
- Current annual tax
- $225 · $19/mo
- Projected year-2 tax
- $225 · $19/mo
- Expected delta
- $0/yr ($0/mo · 0.0%)
ⓘ Screening estimate from a state-policy table — verify with the county assessor before closing.
Climate risk First Street
- Flood 1/10 Low FEMA zone X (unshaded) · 0% chance over 30 yrs
- Wildfire 8/10 Severe
- Heat 6/10 Major 7 d/yr ≥107°F today · 19 d/yr by 30 yrs out
- Wind 2/10 Low 3% chance of damaging wind over 30 yrs
- Air quality 2/10 Low 1 unhealthy d/yr today · 1 by 30 yrs out
Nearby sold comps map
Loading sold comps map…
Walkable amenities ~0.75 mi
Loading nearby amenities…
Taxation est. · year 1
- Rental income
- $9,840
- − Mortgage interest
- −$1,288
- − Property taxes
- −$225
- − Insurance
- −$115
- − Repairs & maintenance
- −$787
- − Management
- −$787
- − Depreciation
- −$669
- Taxable income
- $5,968
- Est. tax owed @ 24.0%
- −$1,432
- After-tax cash flow
- $4,554/yr
For passive investors: Depreciation is non-cash, so a rental often shows a tax loss while cash-flowing — sheltering income. Rental losses are passive: they offset passive income freely, and up to $25,000/yr can offset ordinary (W-2) income if you actively participate and your MAGI is under $100k (phasing out to $0 by $150k); unused losses carry forward. On sale, claimed depreciation is recaptured at up to 25%, and gains may owe capital-gains tax (a 1031 exchange can defer both). Figures are a year-1 estimate at your 24.0% rate — not tax advice; consult a CPA.
Schools (NCES district)
- District
- Anadarko
- NCES district ID
- 4003000
- Math proficiency
- 12% ▼ -9.00%
- Reading proficiency
- 14% ▼ -11.00%
- Median HH income
- $34,887
- Composite
- 10.66/100
- National rank
- #9772
- State rank
- #245 of 270 in OK
Livability — Anadarko
- Score
- 57/100
- State rank
- #483
- US rank
- #22161
Category grades
Schools grade is shown separately in the Schools card above.
Census & demographics
- Census place
- Anadarko, OK
- Population (ZIP)
- 7,760
Population outlook (Caddo County) Hauer SSP2
- Today (2025)
- 28,391 people
- By 2030
- 27,844 · -1.9%
- By 2040
- 27,057 · -4.7%
- By 2050
- 26,484 · -6.7%
- By 2075
- 26,266 · -7.5%
- By 2100
- 26,077 · -8.2%
Race, ethnicity, and origin ACS 2023
- Neighborhood character
- Highly diverse neighborhood (Simpson 0.85)
- Race & ethnicity
- White 34% Native American 34% Two or more races 18% Hispanic / Latino 16% Black 6%
- Hispanic origin (detail)
- Mexican 13%
- Common ancestry
- Lithuanian 2% Iranian 2% Slovak 1%
- Foreign-born
- 3% · Canada
- Languages at home
- 92% English-only · Spanish 6%
Political lean MEDSL · Caddo
- 2024 margin
- Solid R (+47.1) · D 25.4% · R 72.5% · Other 2.1%
- 2008→2024 swing
- -16.4pp toward R · 2008: -30.7pp · 2024: -47.1pp
- All cycles
- 2024: R+47.1 2020: R+44.0 2016: R+43.4 2012: R+28.5 2008: R+30.7
Not yet ingested
- Civics
- —
Market trends
- HPI YoY
- ▼ -4.47%
- Current HPI
- 134.1528
- Rent YoY
- —
- Metro
- —
- State GDP YoY
- ▲ 1.55%
- F500 in state
- 6
Industry mix (Fortune 500 HQ in OK)
| Industry | F500 HQs | Revenue |
|---|---|---|
| Energy | 3 | $48B |
|
||
Price history
+155.6% since first listed3 events — show timeline
- 2025-11-01 Listed $23,000 ForSaleByOwner.com
- 2005-12-09 Sold (Public Records) $17,000 Public Records
- 2000-03-23 Sold (Public Records) $9,000 Public Records
Property tax history
+2.3%/yrLatest (2025): $225 · +4.2% YoY. Source: county tax records.
Cash-flow waterfall
monthlySold comps — $/sqft
last 12 mo · ≤1 miLoading sold comps…