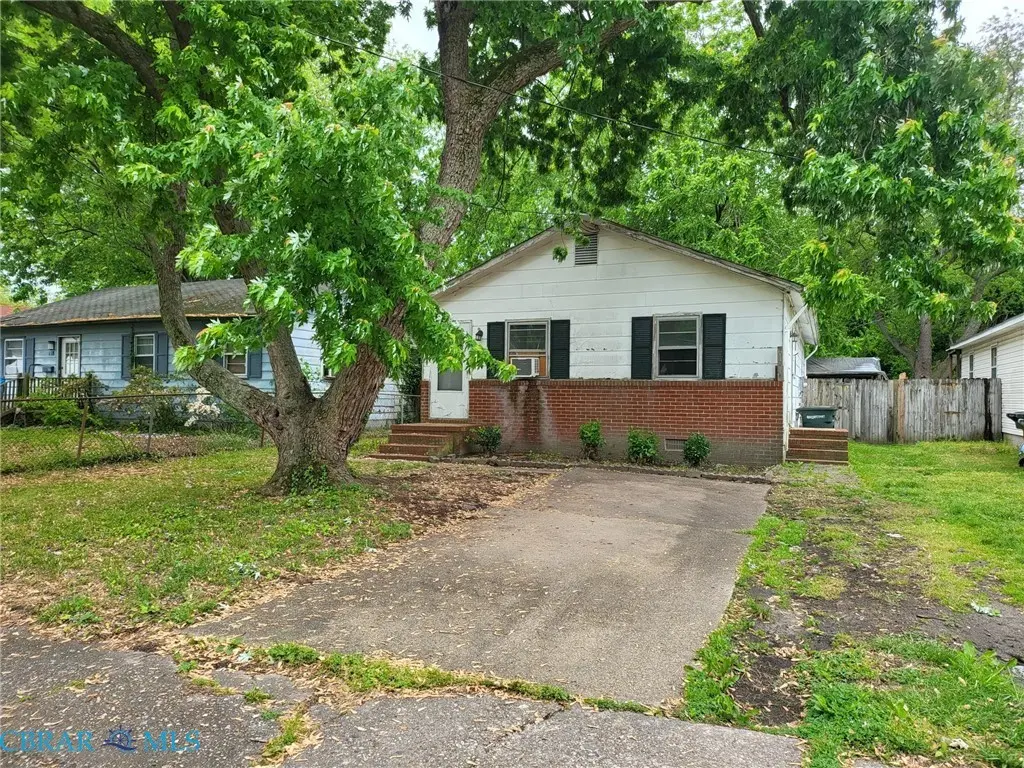
116 Downes St · Hampton, VA
Flood risk 4/10 · Minor
- FEMA flood zone
- X (unshaded)
- Chance of flooding over 30 yrs
- 0.13%
- Est. flood insurance / yr
- $473 – $860
Fire risk 1/10 · Minimal
- Est. fire insurance / yr
- $666 – $1,236
Heat risk 9/10 · Severe
- Hot days now (above 105°F)
- 7 days/yr
- Hot days in 30 yrs
- 16 days/yr
Wind risk 8/10 · Major
- Chance of severe wind over 30 yrs
- 80.0%
Air-quality risk 2/10 · Minimal
- Unhealthy air days now
- 2 days/yr
- Unhealthy air days in 30 yrs
- 2 days/yr
Risk factors via First Street. Map © Google.
Why this score? — see what drove the C grade
The composite is a weighted blend of 9 inputs, each scored 0–100. Each bar is that input's sub-score; the figure is the points it added to the 100-point composite (weight × sub-score).
- Cash flow +19.7/30.0
- ARV discount +12.0/15.0
- DSCR +6.2/10.0
- Schools +5.5/10.0
- 1% rule +4.9/10.0
- Livability +3.8/5.0
- Rent growth +3.3/5.0
- Condition / age +2.5/5.0
- Appreciation +0.0/10.0
$185,500
🖨 Deal sheet 📄 Offer letter ✓ Due diligence
Listing remarks MLS
Priced at City assessment! Bring all offers! Cash only sale! Property being sold as-is, where-is! Seller to make no repairs! Great location in Phoebus! A little work will make this one a good flip or rental!
Key facts
- 6,969 sq ft lot
- Built 1976
- Listed 38 days
Property features AI
Finance
- Other: Lot approximately 0.16 acre (lot front 40', depth 210'); Seven total rooms (living room, great room, dining room, family room, kitchen, breakfast area, foyer, porch, attic listed among spaces)
- HOA & community: No HOA fees indicated
Exterior
- Parking: Off-street parking; Driveway parking spaces; Street parking
- Utilities: City/County water; City/County sewer; Electric power (standard)
- Home design: Detached single-family home; Bungalow / Cottage / Ranch style; One story; One living level; Entry level rooms on main floor
- Construction: Aluminum and brick siding; Asphalt shingle roof; Crawlspace and slab foundation
- Exterior features: Wooded lot; Back partial fence
Interior
- Kitchen: Breakfast area; Kitchen
- Bedrooms: First-floor master bedroom; Additional bedroom
- Bathrooms: One full bathroom; Master bedroom with full bathroom on first floor
- Heating & cooling: Forced hot air heating; Central air conditioning
- Interior features: Scuttle access
- Laundry & utility: Main floor laundry; Washer hookup; Dryer hookup; Utility room
Neighborhood map
What this means for you Summary
Snapshot
- This is a 3-bed/1.0-bath single-family listed at $186k.
Deal economics
- At list price, monthly cash flow is $217 ($3k/yr) — positive.
- The deal already cash-flows at list — no discount required.
- To meet the 1% rule (rent ≥ 1% of price), the offer needs to be $184k (0.9% below list).
- Recommended offer: $180k (3.0% below list) — sets the bar for market timing.
- Cap rate 7.7% vs local median 4.5% in Hampton — top-decile yield for the area; either an underpriced asset or a hidden risk that comps aren't pricing in. Stress-test before assuming the spread holds.
Location & tenants
- Location reads 75/100 on livability (#133 in VA, #4,302 nationally) — a middle-class / working-renter tenant base. Strengths: housing A+, health & safety A+, cost of living A; Watch: crime C-, amenities D+, commute F.
- Hampton City Public School District (urban): math 60% / reading 70% proficiency, ranked #40 of 131 in VA (top 30%) — acceptable for families but not a draw, mixed tenant base, ~2y average lease.
- Zoned schools: Captain John Smith Elementary (math 42% / reading 57%, grade D, #742 of 1,108 statewide, top 70%, 393 students, 82% FRL); Phoebus High (math 57% / reading 76%, grade B, #195 of 319 statewide, top 62%, 1,365 students, 86% FRL) — zoned schools average 84% FRL vs 49% district-wide (35 pts higher); higher-poverty schools than district average — tighter screening recommended.
- Market conditions: Rents rising (+3.1%/yr); 80 active listings in the ZIP; 10 comparable units currently listed for rent nearby; rentals at typical pace (median 17d on market — plan ~3-4 weeks tenant-placement turnaround); 40% of comp listings sitting > 30 days — soft ceiling on asking rent; 68 units permitted in Hampton city in 2024 (0 in 5+ unit buildings).
- This rent runs 41% of the median local income ($54k/yr) — at the standard rent-burdened threshold; future hikes will face affordability resistance.
Forward outlook
- Local home prices are declining (-3.0%/yr); year-one equity from $1k of loan paydown is wiped out by about $6k of value loss. Plan a longer hold.
- Hampton County population projected at -13% by 2050 — secular population decline; favor cash flow + early exit over multi-decade hold.
Negotiation context
- It's been on market 38 days — a 3% lower offer ($180k) is reasonable based on typical stale-listing flexibility.
- 3 sale attempts; this cycle's ask has dropped $10k (5%) from the opening price — seller is motivated, your offer sets the floor, not the list.
- Current owner paid $32k; list at $186k implies a 485% gain — meaningful room to come down on a strong offer.
Risks & watch-outs
- Climate carrying-cost: severe wind risk, 80% chance of damaging wind over 30y; extreme-heat days projected 7→16/yr by 2055 (HVAC capex compounding) — expect insurance premiums to compound above CPI over the hold.
Questions for the listing agent
- It's been on market 38 days. Have you received any prior offers? Is the seller open to a 3% concession, seller financing, or rate buy-down credit?
- Built in 1976 — when were the roof, HVAC, electrical panel, plumbing, and water heater last replaced?
- Is there a deadline driving the sale (1031 exchange, divorce, estate, relocation)? That informs how much negotiation room exists.
- Schools are B-rated — typically a magnet for longer-tenancy family renters. What's the average tenant stay here, and is there a school-zone premium baked into asking?
- What's the average days-on-market for RENTAL listings here right now (not sales)? A rising rental-DOM trend means longer vacancies and softer asking-rent achievability than the comps imply.
- What's the recent tenant-quality profile in this submarket — average credit score on applications, eviction rate, late-payment / NSF rate, and stable-employment percentage? A property-management company in the area should have these aggregated.
- How much new for-sale + rental construction is in the pipeline within 1–3 miles? Heavy new supply typically softens prices + rents 12–24 months out; constrained supply supports both.
Investment metrics
- 1% rule
- 0.99% ✗
- Cap rate
- 7.70%
- Cash-on-cash
- 5.01%
- DSCR
- 1.22
- GRM
- 8.4
CMA / ARV
- ARV (median comp)
- $205,930
- List price
- $185,500
- Delta
- -9.92%
- Verdict
- FAIR
- Comps
- 20 within 1.0 mi
Show comp detail 12 sales within ~0.75 mi
| Address | Dist | Beds/Ba | Sqft | Sold | Price | $/sf | Match |
|---|---|---|---|---|---|---|---|
| 44 Booker St | 0.42mi | 3/1.5 | 977 (-4%) | 5mo | $215,000 | $220 | 68 |
| 75 W Virginia Ave | 0.74mi | 3/1.0 | 1,025 (+1%) | 1mo | $140,000 | $137 | 63 |
| 605 E Mercury Blvd | 0.54mi | 2/1.0 (-1) | 1,013 (-0%) | 8mo | $219,000 | $216 | 63 |
| 37 N Mallory St | 0.40mi | 3/1.0 | 1,113 (+10%) | 4mo | $161,000 | $145 | 62 |
| 10 Booker St | 0.34mi | 2/1.0 (-1) | 911 (-10%) | 2mo | $126,454 | $139 | 60 |
| 26 Woodland Rd | 0.64mi | 2/1.0 (-1) | 1,009 (-1%) | 6mo | $75,000 | $74 | 59 |
| 12 N Hope St | 0.30mi | 3/2.0 | 1,120 (+10%) | 7mo | $249,800 | $223 | 59 |
| 112 W Kelly Ave | 0.70mi | 3/1.0 | 947 (-7%) | 2mo | $205,000 | $216 | 54 |
| 41 W Virginia Ave | 0.71mi | 3/1.0 | 944 (-7%) | 10mo | $185,000 | $196 | 47 |
| 111 E Cummings Ave | 0.55mi | 2/1.0 (-1) | 900 (-11%) | 8mo | $205,900 | $229 | 44 |
| 202 Clay St | 0.61mi | 2/1.0 (-1) | 1,152 (+14%) | 4mo | $203,500 | $177 | 41 |
| 21 W Kelly Ave | 0.65mi | 2/1.0 (-1) | 888 (-12%) | 9mo | $210,000 | $236 | 37 |
Match score weights: distance 35% · size 25% · config 20% · recency 20%. Top-matched comps best support the ARV.
Projected returns pro-forma
-3.0% appreciation · 3.13% rent growth · sell at horizon
- IRR
- -8.4%
- Equity multiple
- 0.69×
- Total profit
- $-16,000
- Equity at exit
- $27,659
- IRR
- 1.3%
- Equity multiple
- 1.09×
- Total profit
- $4,850
- Equity at exit
- $16,039
Cash invested: $51,940 (down + closing). Projections, not guarantees.
Landlord ↔ Tenant lean methodology
- Overall (STATE)
- 55 Moderately Landlord-Leaning
- State Virginia
- 55 Moderately Landlord-Leaning · D+2
- County
- — inherits STATE
- City
- — inherits STATE
ZIP-level market 23663
- Home prices YoY
- -4.3%
- Rents YoY
- 3.1%
- Active inventory
- 80
- Price-to-rent
- 8.4×
Monthly cashflow live
- Estimated rent
- $1,839 high interval (Pro) →
- Mortgage (P&I)
- −$973
- Tax from tax record
- −$186 /mo · $2,229/yr
- Insurance
- −$77
- HOA
- −$0
- Vacancy / Maint / Mgmt
- −$386
- Net cashflow
- $217
Break-even live
UW: 25.0% down · 7.5% · 30yr · 1.5% tax · 5.0% vac · 8.0% maint · 8.0% mgmt
Financing live
Cash to close
- Down payment
- $46,375
- Closing costs
- $5,565
- Reserves months
- —
- Total cash needed
- —
Loan-product check · same deal, 3 products live
Conventional
25% down · 7.5% · 30yr
- Down + closing
- —
- Monthly P&I
- —
- Monthly cashflow
- —
- DSCR
- —
- Eligible?
- —
Personal DTI + credit; lowest rate.
DSCR
20% down · 8.5% · 30yr
- Down + closing
- —
- Monthly P&I
- —
- Monthly cashflow
- —
- DSCR
- —
- Eligible?
- —
No personal income docs; deal must DSCR.
Hard money
10% down · 12.0% · 12mo
- Down + closing
- —
- Monthly P&I
- —
- Monthly cashflow
- —
- DSCR
- —
- Eligible?
- —
Short-term bridge; refi at stabilization.
Rent comps 10 comps
| Address | Beds | Baths | Sqft | Rent | $/sqft | DOM | Units | Dist |
|---|---|---|---|---|---|---|---|---|
| 25 Bainbridge Ave Hampton, VA | 2.0 | 1.5 | 1306 | $1,600 | $1.23 | 1d | 1 | 0.36mi |
| 4 Bainbridge Ave Unit B Hampton, VA | 2.0 | 1.5 | 1050 | $1,550 | $1.48 | 43d | 1 | 0.41mi |
| 150 Ingalls Rd Unit 204 Fort Monroe, VA | 2.0 | 1.0 | 872 | $2,060 | $2.36 | 17d | 1 | 0.60mi |
| 221 W Kelly Ave Hampton, VA | 3.0 | 1.0 | 1200 | $2,350 | $1.96 | 43d | 1 | 0.72mi |
| 949 N Mallory St Hampton, VA | 2.0 | 1.5 | 1054 | $1,250 | $1.19 | 1d | 1 | 0.95mi |
| 305 Old Point Ave Hampton, VA | 3.0 | 1.0 | 1186 | $1,750 | $1.48 | 43d | 1 | 1.23mi |
| 1210 Pansy St Hampton, VA | 2.0 | 2.0 | 1409 | $2,000 | $1.42 | 43d | 1 | 1.24mi |
| 19 Magnolia Pl Hampton, VA | 3.0 | 1.5 | 1405 | $2,100 | $1.49 | 14d | 1 | 1.34mi |
| 1115 E Pembroke Ave Hampton, VA | 2.0 | 1.0 | 850 | $1,275 | $1.50 | 1d | 1 | 1.39mi |
| 234 Washington St Hampton, VA | 2.0 | 1.0 | 1111 | $2,000 | $1.80 | 10d | 1 | 1.42mi |
Listing history 17 events
-
2026-06-18days on market $185,500 Active 38 DOM
-
2026-06-17days on market $185,500 Active 37 DOM
-
2026-06-16days on market $185,500 Active 36 DOM
-
2026-06-15pricedays on market $185,500 Active 35 DOM
-
2026-06-13days on market $195,500 Active 33 DOM
-
2026-06-13days on market $195,500 Active 32 DOM
-
2026-06-09days on market $195,500 Active 29 DOM
-
2026-06-08days on market $195,500 Active 28 DOM
-
2026-06-07days on market $195,500 Active 27 DOM
-
2026-06-03days on market $195,500 Active 23 DOM
-
2026-06-02days on market $195,500 Active 22 DOM
-
2026-06-01days on market $195,500 Active 21 DOM
-
2026-05-31days on market $195,500 Active 20 DOM
-
2026-05-09$195,500 Active 207-char remark
Show marketing remark (207 chars)
Priced at City assessment! Bring all offers! Cash only sale! Property being sold as-is, where-is! Seller to make no repairs! Great location in Phoebus! A little work will make this one a good flip or rental!
-
2026-05-09$195,500 Active 207-char remark
Show marketing remark (207 chars)
Priced at City assessment! Bring all offers! Cash only sale! Property being sold as-is, where-is! Seller to make no repairs! Great location in Phoebus! A little work will make this one a good flip or rental!
-
2026-05-09$195,900 Active
Show marketing remark (207 chars)
Priced at City assessment! Bring all offers! Cash only sale! Property being sold as-is, where-is! Seller to make no repairs! Great location in Phoebus! A little work will make this one a good flip or rental!
-
1985-02-01soldstatus $31,710
ⓘ Source: listings_history table (triggers on properties + properties_extension) + one-shot
backfill from property_details.listing_events for pre-trigger history.
Tax reassessment forecast VA · Resets to sale price
- Current annual tax
- $2,229 · $186/mo
- Projected year-2 tax
- $2,229 · $186/mo
- Expected delta
- $0/yr ($0/mo · 0.0%)
ⓘ Screening estimate from a state-policy table — verify with the county assessor before closing.
Climate risk First Street
- Flood 4/10 Moderate FEMA zone X (unshaded) · 13% chance over 30 yrs
- Wildfire 1/10 Low
- Heat 9/10 Extreme 7 d/yr ≥105°F today · 16 d/yr by 30 yrs out
- Wind 8/10 Severe 80% chance of damaging wind over 30 yrs
- Air quality 2/10 Low 2 unhealthy d/yr today · 2 by 30 yrs out
Nearby sold comps map
Loading sold comps map…
Walkable amenities ~0.75 mi
Loading nearby amenities…
Taxation est. · year 1
- Rental income
- $22,067
- − Mortgage interest
- −$10,391
- − Property taxes
- −$2,229
- − Insurance
- −$928
- − Repairs & maintenance
- −$1,765
- − Management
- −$1,765
- − Depreciation
- −$5,396
- Taxable loss
- −$407
- Est. tax savings @ 24.0%
- +$98
- After-tax cash flow
- $2,701/yr
For passive investors: Depreciation is non-cash, so a rental often shows a tax loss while cash-flowing — sheltering income. Rental losses are passive: they offset passive income freely, and up to $25,000/yr can offset ordinary (W-2) income if you actively participate and your MAGI is under $100k (phasing out to $0 by $150k); unused losses carry forward. On sale, claimed depreciation is recaptured at up to 25%, and gains may owe capital-gains tax (a 1031 exchange can defer both). Figures are a year-1 estimate at your 24.0% rate — not tax advice; consult a CPA.
Schools (NCES district)
- District
- Hampton City Public School District
- NCES district ID
- 5101800
- Math proficiency
- 60% ▼ -21.00%
- Reading proficiency
- 70% ▼ -4.00%
- Median HH income
- $50,089
- Composite
- 55.19/100
- National rank
- #1272
- State rank
- #40 of 131 in VA
Livability — Hampton
- Score
- 75/100
- State rank
- #133
- US rank
- #4302
Category grades
Schools grade is shown separately in the Schools card above.
Census & demographics
- Census place
- Hampton, VA
- County
- Hampton City · 132,421 people
- City population
- 132,421
- Metro
- Virginia Beach-Norfolk-Newport News, VA-NC
- Population (ZIP)
- 14,656
- Household income
- $54,336
- Rent vs Own
- Severe rent burden
- 803.0
Population outlook (Hampton County) Hauer SSP2
- Today (2025)
- 134,055 people
- By 2030
- 131,753 · -1.7%
- By 2040
- 125,017 · -6.7%
- By 2050
- 116,825 · -12.9%
- By 2075
- 97,033 · -27.6%
- By 2100
- 76,188 · -43.2%
Race, ethnicity, and origin ACS 2023
- Neighborhood character
- Diverse neighborhood (Simpson 0.63)
- Race & ethnicity
- Black 48% White 37% Two or more races 11% Hispanic / Latino 5%
- Common ancestry
- Romanian 1% Serbian 1% Lithuanian 1%
- Foreign-born
- 3% · Canada
- Languages at home
- 95% English-only · Spanish 3%
Political lean MEDSL · Hampton
- 2024 margin
- Solid D (+39.9) · D 69.2% · R 29.4% · Other 1.4%
- 2008→2024 swing
- +1.0pp no change · 2008: 38.9pp · 2024: 39.9pp
- All cycles
- 2024: D+39.9 2020: D+42.2 2016: D+37.8 2012: D+45.4 2008: D+38.9
Not yet ingested
- Civics
- —
Market trends
- HPI YoY
- ▼ -14.71%
- Current HPI
- 328.8386
- Rent YoY
- ▲ 3.13%
- Metro
- Virginia Beach-Norfolk-Newport News, VA-NC
- State GDP YoY
- ▲ 2.40%
- F500 in state
- 50
Industry mix (Fortune 500 HQ in VA)
| Industry | F500 HQs | Revenue |
|---|---|---|
| Aerospace / Defense | 4 | $236B |
|
||
| Technology / Defense | 3 | $32B |
|
||
| Financial Services | 2 | $176B |
|
||
| Utilities | 2 | $27B |
|
||
| Insurance | 2 | $25B |
|
||
| Technology | 2 | $15B |
|
||
Price history
+485.0% since first listed7 events — show timeline
- 2026-06-14 Price Changed $185,500 REINMLS
- 2026-06-14 Price Changed $185,500 CBRAR
- 2026-06-14 Price Changed $185,500 WMLS
- 2026-05-09 Listed $195,500 WMLS
- 2026-05-09 Listed $195,900 CBRAR
- 2026-05-09 Listed $195,500 REINMLS
- 1985-02-01 Sold (Public Records) $31,710 Public Records
Property tax history
+13.8%/yrLatest (2025): $2,229 · +19.9% YoY. Source: county tax records.
Cash-flow waterfall
monthlySold comps — $/sqft
last 12 mo · ≤1 miLoading sold comps…