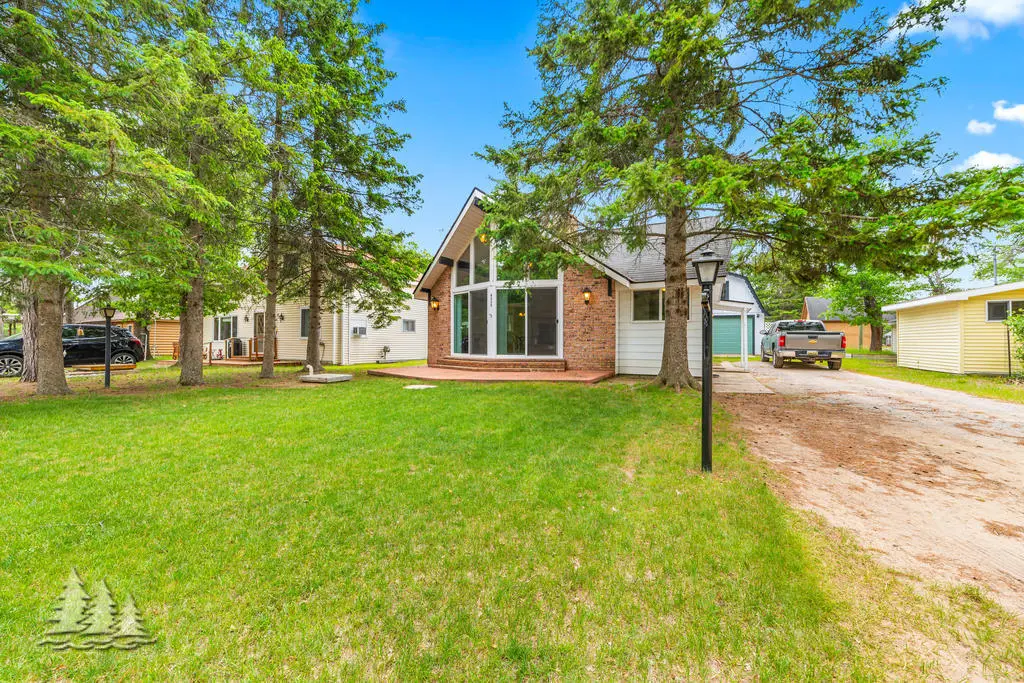
8305 Furgason Trl · Montmorency, MI
Flood risk 1/10 · Minimal
- FEMA flood zone
- —
- Chance of flooding over 30 yrs
- 0.0%
- Est. flood insurance / yr
- —
Fire risk 4/10 · Minor
- Est. fire insurance / yr
- $784 – $1,456
Heat risk 1/10 · Minimal
- Hot days now (above 94°F)
- 7 days/yr
- Hot days in 30 yrs
- 13 days/yr
Wind risk 1/10 · Minimal
- Chance of severe wind over 30 yrs
- —
Air-quality risk 1/10 · Minimal
- Unhealthy air days now
- 0 days/yr
- Unhealthy air days in 30 yrs
- 0 days/yr
Risk factors via First Street. Map © Google.
Why this score? — see what drove the C- grade
The composite is a weighted blend of 9 inputs, each scored 0–100. Each bar is that input's sub-score; the figure is the points it added to the 100-point composite (weight × sub-score).
- ARV discount +11.8/15.0
- Cash flow +11.5/30.0
- Appreciation +10.0/10.0
- DSCR +3.4/10.0
- 1% rule +3.3/10.0
- Schools +2.8/10.0
- Rent growth +2.5/5.0
- Livability +2.5/5.0
- Condition / age +2.5/5.0
$165,000
🖨 Deal sheet 📄 Offer letter ✓ Due diligence
Listing remarks
Escape to the heart of Canada Creek Ranch, where timeless Up North charm meets refined comfort. This inviting 3-bedroom, 2-bath home showcases soaring cathedral ceilings and dramatic floor-to-ceiling windows, filling the living space with natural light and peaceful woodland views. A cozy fireside setting creates the perfect place to unwind or gather with guests. Thoughtfully designed for both everyday living and weekend retreats, the interior offers warmth and character throughout. Outside, a spacious yard invites you to relax and enjoy the quiet beauty of the surrounding landscape--your ideal northern escape awaits. As a CCR property owner, you'll enjoy exclusive access to 13,000 acres of
Key facts
- Spacious yard
- Cathedral ceilings
- Private lakes
Tags
Property features AI
Finance
- Other: Above grade finished area approximately 1,164 sq ft
- HOA & community: Homeowners association with annual fee of $1,252.10 (about $104.34/month)
Exterior
- Parking: Detached garage; 1 garage space
- Security: Smoke detectors
- Utilities: Well water; Septic tank
- Home design: Single family residence; Residential property
- Construction: Partial basement
- Exterior features: On waterfront (Lake Geneva); Private road frontage; Gravel road; Private maintained road; 50 x 100 lot dimensions; Spa/Hot Tub
Interior
- Kitchen: Dishwasher; Microwave; Oven/Range; Refrigerator
- Bathrooms: 2 full bathrooms
- Heating & cooling: Forced air heating (natural gas); Ceiling fans; Has cooling
- Interior features: Vaulted ceilings; Blinds; Fireplace; Partial basement
- Laundry & utility: Washer and dryer (stacked); Laundry on main level; Dryer
Neighborhood map
What this means for you Summary
Snapshot
- This is a 3-bed/2.0-bath single-family listed at $165k.
Deal economics
- At list price, monthly cash flow is $-54 ($-646/yr) — negative.
- To cash-flow at today's rent, offer at most $155k (5.8% below list).
- To meet the 1% rule (rent ≥ 1% of price), the offer needs to be $137k (17.1% below list).
- Recommended offer: $137k (17.1% below list) — sets the bar for 1% rule.
Location & tenants
- Location reads: area grade C — affects rentability + tenant quality, not the cash-flow math above.
- Atlanta Community Schools (rural): math 25% / reading 35% proficiency, ranked #546 of 760 in MI (top 72%) — families likely to look elsewhere, expect single-tenant / working-renter base with shorter leases.
- Market conditions: 56 active listings in the ZIP.
Forward outlook
- In year one you build about $18k of equity ($1k loan paydown + $16k appreciation (10.0% local appreciation)).
- Montmorency County population projected at -38% by 2050 — secular population decline; favor cash flow + early exit over multi-decade hold.
- At projected returns (10.0% appreciation + 3.0% rent growth), your $46k cash investment doubles in ~3 years — after that, you're playing with house money.
- By year 3, paydown + projected appreciation supports a ~$45k cash-out refi (75% LTV) — recoverable capital for the next deal without selling this one.
Negotiation context
- It's been on market 52 days — a 3% lower offer ($160k) is reasonable based on typical stale-listing flexibility.
- Current owner paid $52k; list at $165k implies a 217% gain — meaningful room to come down on a strong offer.
Questions for the listing agent
- What do current leases actually rent for vs. the listed asking? Can we see a recent rent roll and the last 12 months of T-12 income?
- It's been on market 52 days. Have you received any prior offers? Is the seller open to a 17% concession, seller financing, or rate buy-down credit?
- What does the HOA fee cover, when was the last increase, and are there any pending special assessments or reserve-fund shortfalls?
- Is there a deadline driving the sale (1031 exchange, divorce, estate, relocation)? That informs how much negotiation room exists.
- What's the average days-on-market for RENTAL listings here right now (not sales)? A rising rental-DOM trend means longer vacancies and softer asking-rent achievability than the comps imply.
- What's the recent tenant-quality profile in this submarket — average credit score on applications, eviction rate, late-payment / NSF rate, and stable-employment percentage? A property-management company in the area should have these aggregated.
- How much new for-sale + rental construction is in the pipeline within 1–3 miles? Heavy new supply typically softens prices + rents 12–24 months out; constrained supply supports both.
Investment metrics
- 1% rule
- 0.83% ✗
- Cap rate
- 5.90%
- Cash-on-cash
- -1.40%
- DSCR
- 0.94
- GRM
- 10.1
CMA / ARV
- ARV (median comp)
- $182,530
- List price
- $165,000
- Delta
- -9.60%
- Verdict
- FAIR
- Comps
- 7 within 1.0 mi
Projected returns pro-forma
10.0% appreciation · 3.0% rent growth · sell at horizon
- IRR
- 23.3%
- Equity multiple
- 2.87×
- Total profit
- $86,450
- Equity at exit
- $148,645
- IRR
- 20.7%
- Equity multiple
- 6.57×
- Total profit
- $257,312
- Equity at exit
- $320,559
Cash invested: $46,200 (down + closing). Projections, not guarantees.
Landlord ↔ Tenant lean methodology
- Overall (STATE)
- 62 Landlord-Friendly
- State Michigan
- 62 Landlord-Friendly · EVEN
- County
- — inherits STATE
- City
- — inherits STATE
ZIP-level market 49709
- Home prices YoY
- 13.5%
- Active inventory
- 56
- Price-to-rent
- 10.1×
Monthly cashflow live
- Estimated rent
- $1,367 medium interval (Pro) →
- Mortgage (P&I)
- −$865
- Tax from tax record
- −$96 /mo · $1,150/yr
- Insurance
- −$69
- HOA
- −$104
- Vacancy / Maint / Mgmt
- −$287
- Net cashflow
- $-54
Break-even live
UW: 25.0% down · 7.5% · 30yr · 1.5% tax · 5.0% vac · 8.0% maint · 8.0% mgmt
Financing live
Cash to close
- Down payment
- $41,250
- Closing costs
- $4,950
- Reserves months
- —
- Total cash needed
- —
Loan-product check · same deal, 3 products live
Conventional
25% down · 7.5% · 30yr
- Down + closing
- —
- Monthly P&I
- —
- Monthly cashflow
- —
- DSCR
- —
- Eligible?
- —
Personal DTI + credit; lowest rate.
DSCR
20% down · 8.5% · 30yr
- Down + closing
- —
- Monthly P&I
- —
- Monthly cashflow
- —
- DSCR
- —
- Eligible?
- —
No personal income docs; deal must DSCR.
Hard money
10% down · 12.0% · 12mo
- Down + closing
- —
- Monthly P&I
- —
- Monthly cashflow
- —
- DSCR
- —
- Eligible?
- —
Short-term bridge; refi at stabilization.
HOA detail
- Monthly dues
- $104 · $1,248/yr
Listing history 18 events
-
2026-06-18days on market $165,000 Active 52 DOM
-
2026-06-17days on market $165,000 Active 51 DOM
-
2026-06-16days on market $165,000 Active 50 DOM
-
2026-06-15days on market $165,000 Active 49 DOM
-
2026-06-13days on market $165,000 Active 47 DOM
-
2026-06-12days on market $165,000 Active 46 DOM
-
2026-06-09days on market $165,000 Active 43 DOM
-
2026-06-08days on market $165,000 Active 42 DOM
-
2026-06-07days on market $165,000 Active 41 DOM
-
2026-06-07days on market $165,000 Active 40 DOM
-
2026-06-04days on market $165,000 Active 37 DOM
-
2026-06-02days on market $165,000 Active 36 DOM
-
2026-06-01days on market $165,000 Active 35 DOM
-
2026-05-31days on market $165,000 Active 34 DOM
-
2026-05-31days on market $165,000 Active 33 DOM
-
2026-04-24$165,000 Active 1315-char remark
-
2025-09-03price $165,000
-
2001-11-16soldstatus $52,000
ⓘ Source: listings_history table (triggers on properties + properties_extension) + one-shot
backfill from property_details.listing_events for pre-trigger history.
Tax reassessment forecast MI · Partial reset (capped growth)
- Current annual tax
- $1,150 · $96/mo
- Projected year-2 tax
- $1,846 · $154/mo
- Expected delta
- +$695/yr (+$58/mo · 60.5%)
ⓘ Screening estimate from a state-policy table — verify with the county assessor before closing.
Climate risk First Street
- Flood 1/10 Low 0% chance over 30 yrs
- Wildfire 4/10 Moderate
- Heat 1/10 Low 7 d/yr ≥94°F today · 13 d/yr by 30 yrs out
- Wind 1/10 Low
- Air quality 1/10 Low 0 unhealthy d/yr today · 0 by 30 yrs out
Nearby sold comps map
Loading sold comps map…
Walkable amenities ~0.75 mi
Loading nearby amenities…
Taxation est. · year 1
- Rental income
- $16,406
- − Mortgage interest
- −$9,243
- − Property taxes
- −$1,150
- − Insurance
- −$825
- − Repairs & maintenance
- −$1,312
- − Management
- −$1,312
- − HOA
- −$1,248
- − Depreciation
- −$4,800
- Taxable loss
- −$3,485
- Est. tax savings @ 24.0%
- +$836
- After-tax cash flow
- $190/yr
For passive investors: Depreciation is non-cash, so a rental often shows a tax loss while cash-flowing — sheltering income. Rental losses are passive: they offset passive income freely, and up to $25,000/yr can offset ordinary (W-2) income if you actively participate and your MAGI is under $100k (phasing out to $0 by $150k); unused losses carry forward. On sale, claimed depreciation is recaptured at up to 25%, and gains may owe capital-gains tax (a 1031 exchange can defer both). Figures are a year-1 estimate at your 24.0% rate — not tax advice; consult a CPA.
Schools (NCES district)
- District
- Atlanta Community Schools
- NCES district ID
- 2603570
- Math proficiency
- 25% ▲ 5.00%
- Reading proficiency
- 35% ▲ 10.00%
- Median HH income
- $35,004
- Composite
- 27.59/100
- National rank
- #12347
- State rank
- #546 of 760 in MI
Livability — Montmorency
No livability data for this city. (Only ~50 U.S. cities are tracked.)
Census & demographics
- Census place
- Canada Creek Ranch, MI
- Population (ZIP)
- 3,524
Population outlook (Montmorency County) Hauer SSP2
- Today (2025)
- 8,233 people
- By 2030
- 7,575 · -8.0%
- By 2040
- 6,202 · -24.7%
- By 2050
- 5,081 · -38.3%
- By 2075
- 3,119 · -62.1%
- By 2100
- 1,923 · -76.6%
Race, ethnicity, and origin ACS 2023
- Neighborhood character
- Predominantly White (94%)
- Race & ethnicity
- White 94% Two or more races 4% Hispanic / Latino 2%
- Common ancestry
- Romanian 11% Lithuanian 7% Slovak 6%
- Foreign-born
- 1% · Canada
- Languages at home
- 98% English-only · Other Asian/Pacific 1% Spanish 1%
Political lean MEDSL · Montmorency
- 2024 margin
- Solid R (+45.3) · D 26.6% · R 72.0% · Other 1.4%
- 2008→2024 swing
- -37.2pp toward R · 2008: -8.2pp · 2024: -45.3pp
- All cycles
- 2024: R+45.3 2020: R+43.4 2016: R+44.2 2012: R+17.4 2008: R+8.2
Not yet ingested
- Civics
- —
Market trends
- HPI YoY
- ▲ 42.88%
- Current HPI
- 361.3052
- Rent YoY
- —
- Metro
- —
- State GDP YoY
- ▲ 1.37%
- F500 in state
- 28
Industry mix (Fortune 500 HQ in MI)
| Industry | F500 HQs | Revenue |
|---|---|---|
| Automotive Parts | 3 | $48B |
|
||
| Automotive | 2 | $372B |
|
||
| Chemicals | 1 | $45B |
|
||
| Automotive Retail | 1 | $29B |
|
||
| Healthcare / Medical Devices | 1 | $23B |
|
||
| Automotive Technology | 1 | $20B |
|
||
Price history
+217.3% since first listed3 events — show timeline
- 2026-04-24 Listed $165,000 WWMLS
- 2025-09-03 Price Changed $165,000 WWMLS
- 2001-11-16 Sold (Public Records) $52,000 Public Records
Property tax history
+17.4%/yrLatest (2023): $1,150 · +71.1% YoY. Source: county tax records.
Cash-flow waterfall
monthlySold comps — $/sqft
last 12 mo · ≤1 miLoading sold comps…