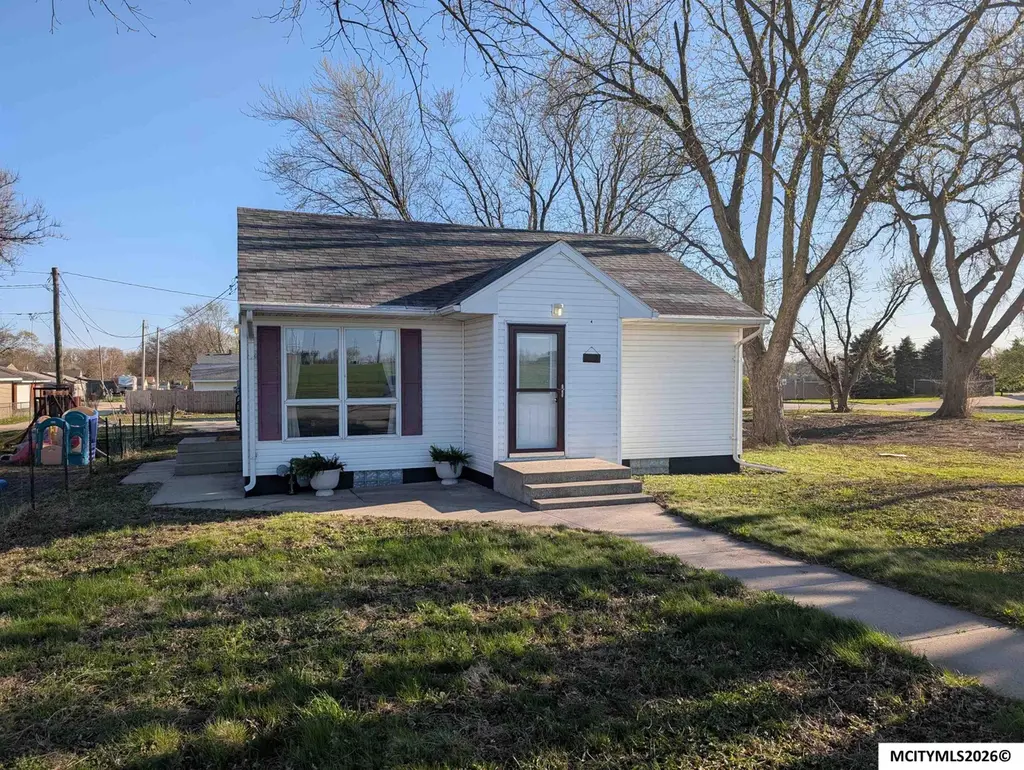
1219 12th St NW · Mason City, IA
Flood risk 1/10 · Minimal
- FEMA flood zone
- X (unshaded)
- Chance of flooding over 30 yrs
- 0.0%
- Est. flood insurance / yr
- $473 – $860
Fire risk 3/10 · Minor
- Est. fire insurance / yr
- $902 – $1,676
Heat risk 2/10 · Minimal
- Hot days now (above 101°F)
- 7 days/yr
- Hot days in 30 yrs
- 16 days/yr
Wind risk 2/10 · Minimal
- Chance of severe wind over 30 yrs
- —
Air-quality risk 1/10 · Minimal
- Unhealthy air days now
- 0 days/yr
- Unhealthy air days in 30 yrs
- 0 days/yr
Risk factors via First Street. Map © Google.
Why this score? — see what drove the D+ grade
The composite is a weighted blend of 9 inputs, each scored 0–100. Each bar is that input's sub-score; the figure is the points it added to the 100-point composite (weight × sub-score).
- Cash flow +23.5/30.0
- DSCR +7.6/10.0
- 1% rule +5.2/10.0
- Schools +4.5/10.0
- Livability +4.0/5.0
- Rent growth +2.5/5.0
- Condition / age +2.5/5.0
- ARV discount +0.0/15.0
- Appreciation +0.0/10.0
$147,500
🖨 Deal sheet 📄 Offer letter ✓ Due diligence
Listing remarks
This move-in ready 3-bedroom, 1.75-bath home at 1219 12th St NW in Mason City offers 1,380 sq ft of well-maintained living space filled with natural light. Freshly painted interiors and refurbished hardwood floors create a warm, inviting atmosphere, while an updated bathroom brings modern touches throughout. The industrial-style finished basement expands your options with a third bedroom, flexible family area, workout space, and convenient laundry room with a 3/4 bath. Outside, generous entertaining space sets the stage for memorable gatherings, and a spacious 2-car detached garage includes a dedicated workshop for projects and hobbies. Situated near Hoover Elementary School, MacNider's Woo
Key facts
- Entertaining space
- Finished basement
- Dedicated workshop
Tags
Property features AI
Exterior
- Parking: Detached garage with 2 garage spaces; Concrete and gravel surfaces; Garage door opener
- Security: Smoke detectors
- Utilities: Public water; Public sewer
- Home design: Single-family residence; Single-story
- Construction: Vinyl siding; Asphalt/composition roof
- Exterior features: Patio; Lot roughly 45 x 130; Zoned RG (General Residential)
Interior
- Kitchen: Gas range; Refrigerator
- Bedrooms: 2 main-level bedrooms
- Flooring: Vinyl flooring; Wood flooring
- Bathrooms: 1 main-level bathroom
- Heating & cooling: Forced air heating (natural gas); Central air conditioning
- Interior features: Eat-in kitchen; Pantry; Finished full basement
Neighborhood map
What this means for you Summary
Snapshot
- This is a 1-bed/3.0-bath single-family listed at $148k.
Deal economics
- At list price, monthly cash flow is $276 ($3k/yr) — positive.
- The deal already cash-flows at list — no discount required.
- Meets the 1% rule at list price ($2k rent vs $148k).
- Recommended offer: $143k (3.0% below list) — sets the bar for market timing.
- Cap rate 8.5% vs local median 5.2% in Mason City — top-decile yield for the area; either an underpriced asset or a hidden risk that comps aren't pricing in. Stress-test before assuming the spread holds.
Location & tenants
- Location reads 81/100 on livability (#67 in IA, #1,477 nationally) — a professional / high-income tenant draw. Strengths: commute A+, cost of living A+, housing A+; Watch: amenities F.
- Mason City Community School District (town): math 50% / reading 58% proficiency, ranked #271 of 289 in IA (top 94%) — acceptable for families but not a draw, mixed tenant base, ~2y average lease.
- Market conditions: 153 active listings in the ZIP; 2 comparable units currently listed for rent nearby; 54 units permitted in Cerro Gordo County in 2024 (6 in 5+ unit buildings).
Forward outlook
- Local home prices are declining (-3.0%/yr); year-one equity from $1k of loan paydown is wiped out by about $4k of value loss. Plan a longer hold.
- Cerro Gordo County population projected at -18% by 2050 — secular population decline; favor cash flow + early exit over multi-decade hold.
Negotiation context
- It's been on market 56 days — a 3% lower offer ($143k) is reasonable based on typical stale-listing flexibility.
Risks & watch-outs
- Watch-outs: built in 1954 — expect roof / HVAC / electrical / plumbing capex.
Questions for the listing agent
- It's been on market 56 days. Have you received any prior offers? Is the seller open to a 3% concession, seller financing, or rate buy-down credit?
- Built in 1954 — when were the roof, HVAC, electrical panel, plumbing, and water heater last replaced?
- Is there a deadline driving the sale (1031 exchange, divorce, estate, relocation)? That informs how much negotiation room exists.
- The area grade is low — what's the realistic commute time and amenity access for the typical tenant pool here? Any planned neighborhood developments (good or bad) we should know about?
- What's the average days-on-market for RENTAL listings here right now (not sales)? A rising rental-DOM trend means longer vacancies and softer asking-rent achievability than the comps imply.
- What's the recent tenant-quality profile in this submarket — average credit score on applications, eviction rate, late-payment / NSF rate, and stable-employment percentage? A property-management company in the area should have these aggregated.
- How much new for-sale + rental construction is in the pipeline within 1–3 miles? Heavy new supply typically softens prices + rents 12–24 months out; constrained supply supports both.
Investment metrics
- 1% rule
- 1.02% ✓
- Cap rate
- 8.54%
- Cash-on-cash
- 8.01%
- DSCR
- 1.36
- GRM
- 8.2
CMA / ARV
- ARV (on-the-fly)
- $125,820
- Comps found
- 8
Show comp detail 8 sales within ~0.75 mi
| Address | Dist | Beds/Ba | Sqft | Sold | Price | $/sf | Match |
|---|---|---|---|---|---|---|---|
| 227 N Crescent Dr Dr | 0.53mi | 2/1.8 (+1) | 1,200 (+3%) | 6mo | $129,000 | $108 | 55 |
| 822 9th St NW | 0.37mi | 2/1.5 (+1) | 1,160 (-0%) | 19mo | $127,500 | $110 | 55 |
| 1025 2nd St NW | 0.65mi | 2/1.8 (+1) | 1,188 (+2%) | 5mo | $84,000 | $71 | 52 |
| 1022 N Monroe Ave | 0.58mi | 2/2.0 (+1) | 1,322 (+14%) | 5mo | $123,000 | $93 | 37 |
| 712 N Jackson Ave | 0.51mi | 2/1.8 (+1) | 1,313 (+13%) | 12mo | $159,500 | $121 | 35 |
| 147 N Crescent Dr Dr | 0.67mi | 2/1.0 (+1) | 1,022 (-12%) | 3mo | $112,500 | $110 | 33 |
| 312 14th St NW | 0.69mi | 2/1.5 (+1) | 1,288 (+11%) | 14mo | $120,000 | $93 | 28 |
| 321 14th St NW | 0.67mi | 2/1.0 (+1) | 1,014 (-13%) | 23mo | $80,000 | $79 | 15 |
Match score weights: distance 35% · size 25% · config 20% · recency 20%. Top-matched comps best support the ARV.
Projected returns pro-forma
-3.0% appreciation · 3.0% rent growth · sell at horizon
- IRR
- -4.1%
- Equity multiple
- 0.85×
- Total profit
- $-6,388
- Equity at exit
- $21,993
- IRR
- 5.5%
- Equity multiple
- 1.41×
- Total profit
- $16,874
- Equity at exit
- $12,753
Cash invested: $41,300 (down + closing). Projections, not guarantees.
Landlord ↔ Tenant lean methodology
- Overall (STATE)
- 83 Strongly Landlord-Friendly
- State Iowa
- 83 Strongly Landlord-Friendly · R+6
- County
- — inherits STATE
- City
- — inherits STATE
ZIP-level market 50401
- Active inventory
- 153
- Price-to-rent
- 8.2×
Monthly cashflow live
- Estimated rent
- $1,507 medium interval (Pro) →
- Mortgage (P&I)
- −$774
- Tax from tax record
- −$80 /mo · $958/yr
- Insurance
- −$61
- HOA
- −$0
- Vacancy / Maint / Mgmt
- −$316
- Net cashflow
- $276
Break-even live
UW: 25.0% down · 7.5% · 30yr · 1.5% tax · 5.0% vac · 8.0% maint · 8.0% mgmt
Financing live
Cash to close
- Down payment
- $36,875
- Closing costs
- $4,425
- Reserves months
- —
- Total cash needed
- —
Loan-product check · same deal, 3 products live
Conventional
25% down · 7.5% · 30yr
- Down + closing
- —
- Monthly P&I
- —
- Monthly cashflow
- —
- DSCR
- —
- Eligible?
- —
Personal DTI + credit; lowest rate.
DSCR
20% down · 8.5% · 30yr
- Down + closing
- —
- Monthly P&I
- —
- Monthly cashflow
- —
- DSCR
- —
- Eligible?
- —
No personal income docs; deal must DSCR.
Hard money
10% down · 12.0% · 12mo
- Down + closing
- —
- Monthly P&I
- —
- Monthly cashflow
- —
- DSCR
- —
- Eligible?
- —
Short-term bridge; refi at stabilization.
Rent comps 2 comps
| Address | Beds | Baths | Sqft | Rent | $/sqft | DOM | Units | Dist |
|---|---|---|---|---|---|---|---|---|
| 12 2nd St NE Unit 6 Mason City, IA | 2.0 | 1.0 | 1296 | $1,600 | $1.23 | 44d | 1 | 1.17mi |
| 110 N Delaware Ave Unit 211 Mason City, IA | 2.0 | 1.0 | 919 | $1,395 | $1.52 | 44d | 1 | 1.24mi |
Listing history 12 events
-
2026-06-12statusdays on market $147,500 Pending 56 DOM
-
2026-06-09days on market $147,500 Active Under Contract 53 DOM
-
2026-06-08days on market $147,500 Active Under Contract 52 DOM
-
2026-06-07days on market $147,500 Active Under Contract 51 DOM
-
2026-06-07days on market $147,500 Active Under Contract 50 DOM
-
2026-06-04days on market $147,500 Active Under Contract 47 DOM
-
2026-06-02days on market $147,500 Active Under Contract 46 DOM
-
2026-06-01days on market $147,500 Active Under Contract 45 DOM
-
2026-05-31days on market $147,500 Active Under Contract 44 DOM
-
2026-05-31days on market $147,500 Active Under Contract 43 DOM
-
2026-04-25historical Active Under Contract
-
2026-04-17$147,500 Active
ⓘ Source: listings_history table (triggers on properties + properties_extension) + one-shot
backfill from property_details.listing_events for pre-trigger history.
Tax reassessment forecast IA · Partial reset (capped growth)
- Current annual tax
- $958 · $80/mo
- Projected year-2 tax
- $1,637 · $136/mo
- Expected delta
- +$679/yr (+$57/mo · 70.9%)
ⓘ Screening estimate from a state-policy table — verify with the county assessor before closing.
Climate risk First Street
- Flood 1/10 Low FEMA zone X (unshaded) · 0% chance over 30 yrs
- Wildfire 3/10 Moderate
- Heat 2/10 Low 7 d/yr ≥101°F today · 16 d/yr by 30 yrs out
- Wind 2/10 Low
- Air quality 1/10 Low 0 unhealthy d/yr today · 0 by 30 yrs out
Nearby sold comps map
Loading sold comps map…
Walkable amenities ~0.75 mi
Loading nearby amenities…
Taxation est. · year 1
- Rental income
- $18,082
- − Mortgage interest
- −$8,262
- − Property taxes
- −$958
- − Insurance
- −$738
- − Repairs & maintenance
- −$1,447
- − Management
- −$1,447
- − Depreciation
- −$4,291
- Taxable income
- $941
- Est. tax owed @ 24.0%
- −$226
- After-tax cash flow
- $3,082/yr
For passive investors: Depreciation is non-cash, so a rental often shows a tax loss while cash-flowing — sheltering income. Rental losses are passive: they offset passive income freely, and up to $25,000/yr can offset ordinary (W-2) income if you actively participate and your MAGI is under $100k (phasing out to $0 by $150k); unused losses carry forward. On sale, claimed depreciation is recaptured at up to 25%, and gains may owe capital-gains tax (a 1031 exchange can defer both). Figures are a year-1 estimate at your 24.0% rate — not tax advice; consult a CPA.
Schools (NCES district)
- District
- Mason City Community School District
- NCES district ID
- 1918780
- Math proficiency
- 50% ▼ -1.00%
- Reading proficiency
- 58% ▼ -7.00%
- Median HH income
- $43,668
- Composite
- 45.47/100
- National rank
- #2614
- State rank
- #271 of 289 in IA
Livability — Mason City
- Score
- 81/100
- State rank
- #67
- US rank
- #1477
Category grades
Schools grade is shown separately in the Schools card above.
Census & demographics
- Census place
- Mason City, IA
- City population
- 28,818
- Population (ZIP)
- 28,818
Population outlook (Cerro Gordo County) Hauer SSP2
- Today (2025)
- 41,080 people
- By 2030
- 39,746 · -3.2%
- By 2040
- 36,608 · -10.9%
- By 2050
- 33,682 · -18.0%
- By 2075
- 29,702 · -27.7%
- By 2100
- 27,399 · -33.3%
Race, ethnicity, and origin ACS 2023
- Neighborhood character
- Predominantly White (87%)
- Race & ethnicity
- White 87% Hispanic / Latino 6% Two or more races 5% Black 3% Asian 1%
- Hispanic origin (detail)
- Mexican 5%
- Common ancestry
- Portuguese 12% Iranian 2% Lithuanian 2%
- Foreign-born
- 2% · Canada, Vietnam
- Languages at home
- 96% English-only · Spanish 3% Other Asian/Pacific 1%
Political lean MEDSL · Cerro Gordo
- 2024 margin
- R (+11.7) · D 43.4% · R 55.0% · Other 1.6%
- 2008→2024 swing
- -32.5pp toward R · 2008: 20.8pp · 2024: -11.7pp
- All cycles
- 2024: R+11.7 2020: R+6.3 2016: R+7.7 2012: D+13.2 2008: D+20.8
Not yet ingested
- Civics
- —
Market trends
- HPI YoY
- ▼ -130.01%
- Current HPI
- 199.1966
- Rent YoY
- —
- Metro
- —
- State GDP YoY
- ▲ 2.48%
- F500 in state
- 4
Industry mix (Fortune 500 HQ in IA)
| Industry | F500 HQs | Revenue |
|---|---|---|
| Financial Services | 1 | $16B |
|
||
| Retail / Convenience | 1 | $15B |
|
||
Price history
2 events — show timeline
- 2026-04-25 Contingent — Greater Mason BOR
- 2026-04-17 Listed $147,500 Greater Mason BOR
Property tax history
-0.7%/yrLatest (2025): $958 · -7.0% YoY. Source: county tax records.
Cash-flow waterfall
monthlySold comps — $/sqft
last 12 mo · ≤1 miLoading sold comps…