7602 Randy Ct · Louisville/Jefferson County metro government (balance), KY
Flood risk 1/10 · Minimal
- FEMA flood zone
- X (shaded)
- Chance of flooding over 30 yrs
- 0.0%
- Est. flood insurance / yr
- $507 – $1,088
Fire risk 1/10 · Minimal
- Est. fire insurance / yr
- $839 – $1,559
Heat risk 5/10 · Moderate
- Hot days now (above 104°F)
- 7 days/yr
- Hot days in 30 yrs
- 22 days/yr
Wind risk 2/10 · Minimal
- Chance of severe wind over 30 yrs
- 2.0%
Air-quality risk 3/10 · Minor
- Unhealthy air days now
- 2 days/yr
- Unhealthy air days in 30 yrs
- 3 days/yr
Risk factors via First Street. Map © Google.
Why this score? — see what drove the C grade
The composite is a weighted blend of 9 inputs, each scored 0–100. Each bar is that input's sub-score; the figure is the points it added to the 100-point composite (weight × sub-score).
- Cash flow +22.2/30.0
- ARV discount +15.0/15.0
- DSCR +7.1/10.0
- 1% rule +5.1/10.0
- Rent growth +2.6/5.0
- Livability +2.5/5.0
- Condition / age +2.5/5.0
- Schools +2.3/10.0
- Appreciation +0.0/10.0
$184,500
🖨 Deal sheet 📄 Offer letter ✓ Due diligence
Listing remarks
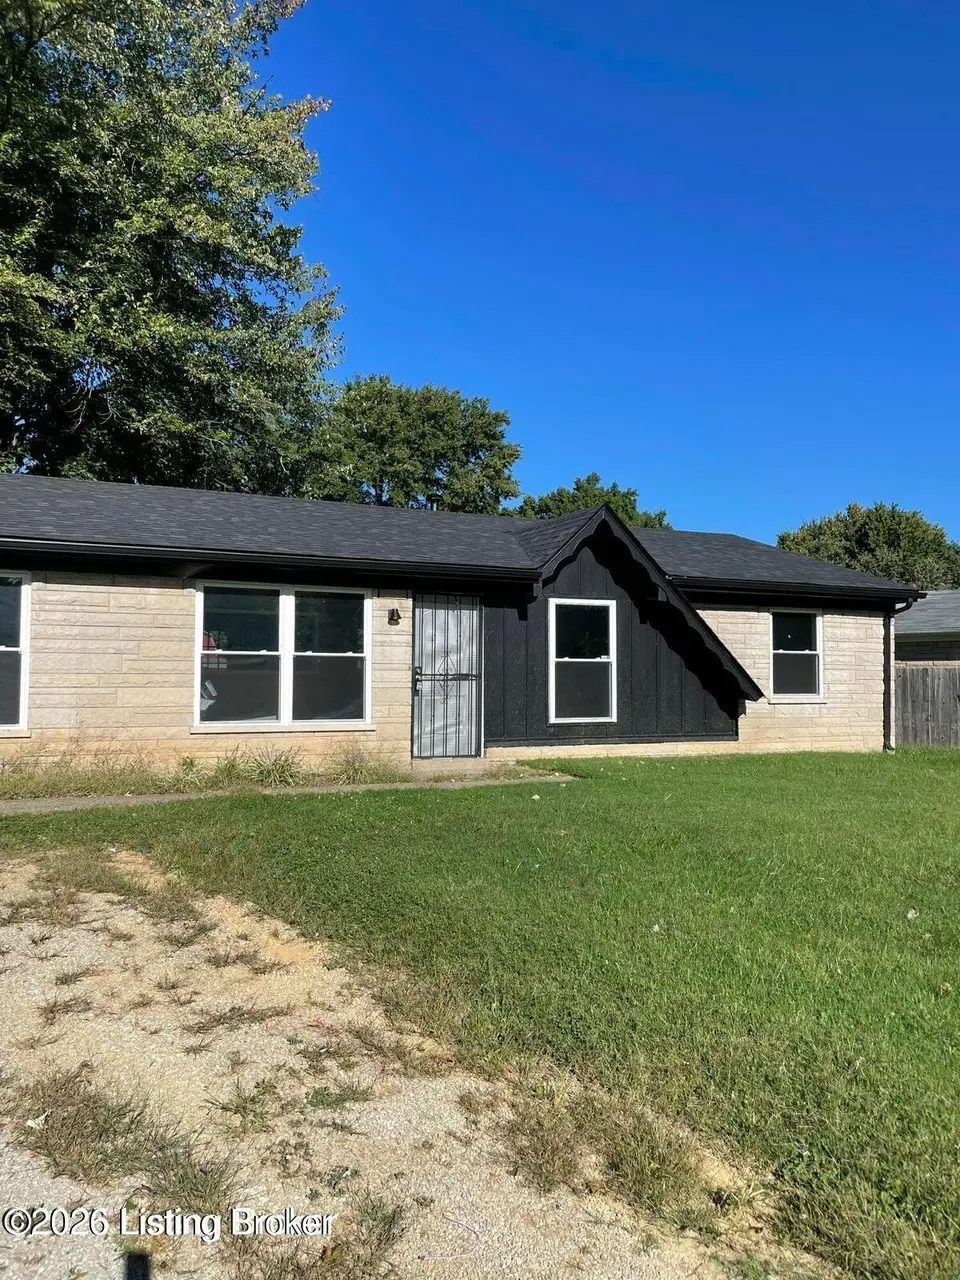
Welcome to this updated and move-in ready ranch tucked away on a quiet cul-de-sac in an established neighborhood conveniently located off Greenbelt Highway! Offering approximately 1,200 square feet, this home presents an excellent opportunity for first-time homebuyers, downsizers, or buyers seeking affordability without sacrificing important updates. Step inside to find newer luxury vinyl plank flooring, fresh paint, and thoughtful improvements throughout that create a bright, clean, and welcoming feel. Recent updates include a newer roof (2022), updated water heater (approx. 2023), updated bathroom plumbing, and additional interior improvements that add both function and peace of mind. The
Key facts
- Quiet cul-de-sac
- Updated ranch
- Newer roof
Tags
Property features AI
Finance
- HOA & community: No association fee
Exterior
- Parking: Driveway
- Utilities: Electricity connected
- Home design: Single-family ranch-style home; One story
- Construction: Built in 1966; Brick construction; Shingle roof; Slab foundation
- Exterior features: Cleared lot
Interior
- Kitchen: Kitchen on the first floor
- Bedrooms: Four bedrooms, all on the first floor; Primary bedroom on the first floor
- Bathrooms: One full bathroom on the first floor
- Heating & cooling: Forced air heating; Natural gas heating; One HVAC unit
- Interior features: Seven total rooms; Living room on the first floor; No basement
- Laundry & utility: First-floor laundry
Neighborhood map
What this means for you Summary
Snapshot
- This is a 4-bed/1.0-bath single-family listed at $184k.
Deal economics
- At list price, monthly cash flow is $299 ($4k/yr) — positive.
- The deal already cash-flows at list — no discount required.
- Meets the 1% rule at list price ($2k rent vs $184k).
- Recommended offer: $182k (1.5% below list) — sets the bar for market timing.
- Cap rate 8.2% vs local median 4.0% in Louisville/Jefferson County metro government (balance) — top-decile yield for the area; either an underpriced asset or a hidden risk that comps aren't pricing in. Stress-test before assuming the spread holds.
Location & tenants
- Location reads: area grade C — affects rentability + tenant quality, not the cash-flow math above.
- Jefferson County (urban): math 19% / reading 35% proficiency, ranked #121 of 165 in KY (top 73%) — low school quality limits family demand, transient renter base, plan for 1-2y turnover.
- Market conditions: Rents flat; 122 active listings in the ZIP; 7 comparable units currently listed for rent nearby; rentals at typical pace (median 16d on market — plan ~3-4 weeks tenant-placement turnaround); 2,836 units permitted in Jefferson County in 2024 (1,558 in 5+ unit buildings).
- This rent runs 33% of the median local income ($68k/yr) — at the standard rent-burdened threshold; future hikes will face affordability resistance.
Forward outlook
- Local home prices are declining (-3.0%/yr); year-one equity from $1k of loan paydown is wiped out by about $6k of value loss. Plan a longer hold.
- Jefferson County population projected at +13% by 2050 — modest demand growth; plan on rents tracking national, not racing it.
Negotiation context
- It's been on market 23 days — a 2% lower offer ($182k) is reasonable based on typical stale-listing flexibility.
- 6 sale attempts since 21y ago with the ask held roughly flat each time — persistent listings suggest the price (not the market) is what's stuck; bring a comps-based counter.
- Current owner paid $130k; 42% above their basis — modest negotiation headroom, anchor on the comps not their cost.
Risks & watch-outs
- Climate carrying-cost: extreme-heat days projected 7→22/yr by 2055 (HVAC capex compounding) — expect insurance premiums to compound above CPI over the hold.
Questions for the listing agent
- Built in 1966 — when were the roof, HVAC, electrical panel, plumbing, and water heater last replaced?
- Is there a deadline driving the sale (1031 exchange, divorce, estate, relocation)? That informs how much negotiation room exists.
- What's the average days-on-market for RENTAL listings here right now (not sales)? A rising rental-DOM trend means longer vacancies and softer asking-rent achievability than the comps imply.
- What's the recent tenant-quality profile in this submarket — average credit score on applications, eviction rate, late-payment / NSF rate, and stable-employment percentage? A property-management company in the area should have these aggregated.
- How much new for-sale + rental construction is in the pipeline within 1–3 miles? Heavy new supply typically softens prices + rents 12–24 months out; constrained supply supports both.
Investment metrics
- 1% rule
- 1.01% ✓
- Cap rate
- 8.24%
- Cash-on-cash
- 6.95%
- DSCR
- 1.31
- GRM
- 8.3
CMA / ARV
- ARV (on-the-fly)
- $230,400
- Comps found
- 12
Show comp detail 12 sales within ~0.75 mi
| Address | Dist | Beds/Ba | Sqft | Sold | Price | $/sf | Match |
|---|---|---|---|---|---|---|---|
| 7520 Blue Wing Dr | 0.08mi | 3/1.0 (-1) | 1,208 (+1%) | 5mo | $175,000 | $145 | 86 |
| 7708 Texlyn Ct | 0.21mi | 3/2.0 (-1) | 1,212 (+1%) | 9mo | $210,000 | $173 | 72 |
| 7105 Glen Echo Pl | 0.23mi | 3/2.0 (-1) | 1,210 (+1%) | 9mo | $220,000 | $182 | 72 |
| 7507 Pintail Dr | 0.33mi | 3/1.0 (-1) | 1,266 (+6%) | 6mo | $158,000 | $125 | 65 |
| 7710 Greenwood Rd | 0.36mi | 3/1.0 (-1) | 1,298 (+8%) | 1mo | $249,900 | $193 | 64 |
| 7116 Blue Stream Ct | 0.49mi | 3/2.0 (-1) | 1,186 (-1%) | 11mo | $246,000 | $207 | 57 |
| 9814 Brooks Bend Rd | 0.59mi | 3/2.0 (-1) | 1,174 (-2%) | 10mo | $245,000 | $209 | 52 |
| 6713 Fenske Ln | 0.68mi | 3/2.0 (-1) | 1,200 (0%) | 9mo | $230,000 | $192 | 52 |
| 6812 Creston Dr | 0.61mi | 3/1.0 (-1) | 1,116 (-7%) | 12mo | $247,500 | $222 | 45 |
| 7115 Blue Stream Ct | 0.51mi | 3/2.0 (-1) | 1,324 (+10%) | 8mo | $245,000 | $185 | 43 |
| 9710 Brooks Bend Rd | 0.65mi | 3/2.0 (-1) | 1,104 (-8%) | 8mo | $219,000 | $198 | 41 |
| 9616 Combs Ln | 0.69mi | 3/2.0 (-1) | 1,324 (+10%) | 12mo | $237,500 | $179 | 32 |
Match score weights: distance 35% · size 25% · config 20% · recency 20%. Top-matched comps best support the ARV.
Projected returns pro-forma
-3.0% appreciation · 0.5% rent growth · sell at horizon
- IRR
- -8.3%
- Equity multiple
- 0.70×
- Total profit
- $-15,424
- Equity at exit
- $27,510
- IRR
- -2.2%
- Equity multiple
- 0.87×
- Total profit
- $-6,822
- Equity at exit
- $15,952
Cash invested: $51,660 (down + closing). Projections, not guarantees.
Landlord ↔ Tenant lean methodology
- Overall (STATE)
- 83 Strongly Landlord-Friendly
- State Kentucky
- 83 Strongly Landlord-Friendly · R+16
- County
- — inherits STATE
- City
- — inherits STATE
ZIP-level market 40258
- Rents YoY
- 0.5%
- Active inventory
- 122
- Price-to-rent
- 8.3×
Monthly cashflow live
- Estimated rent
- $1,858 high interval (Pro) →
- Mortgage (P&I)
- −$968
- Tax from tax record
- −$124 /mo · $1,483/yr
- Insurance
- −$77
- HOA
- −$0
- Vacancy / Maint / Mgmt
- −$390
- Net cashflow
- $299
Break-even live
UW: 25.0% down · 7.5% · 30yr · 1.5% tax · 5.0% vac · 8.0% maint · 8.0% mgmt
Financing live
Cash to close
- Down payment
- $46,125
- Closing costs
- $5,535
- Reserves months
- —
- Total cash needed
- —
Loan-product check · same deal, 3 products live
Conventional
25% down · 7.5% · 30yr
- Down + closing
- —
- Monthly P&I
- —
- Monthly cashflow
- —
- DSCR
- —
- Eligible?
- —
Personal DTI + credit; lowest rate.
DSCR
20% down · 8.5% · 30yr
- Down + closing
- —
- Monthly P&I
- —
- Monthly cashflow
- —
- DSCR
- —
- Eligible?
- —
No personal income docs; deal must DSCR.
Hard money
10% down · 12.0% · 12mo
- Down + closing
- —
- Monthly P&I
- —
- Monthly cashflow
- —
- DSCR
- —
- Eligible?
- —
Short-term bridge; refi at stabilization.
Rent comps 7 comps
| Address | Beds | Baths | Sqft | Rent | $/sqft | DOM | Units | Dist |
|---|---|---|---|---|---|---|---|---|
| 7710 Texlyn Ct Louisville, KY | 3.0 | 2.0 | 1325 | $1,695 | $1.28 | 21d | 1 | 0.20mi |
| 7703 Texlyn Ct Louisville, KY | 3.0 | 2.0 | 1210 | $1,675 | $1.38 | 10d | 1 | 0.26mi |
| 7512 Greenwood Rd Louisville, KY | 3.0 | 1.0 | 925 | $1,475 | $1.59 | 2d | 1 | 0.36mi |
| 7812 Westbrook Rd Louisville, KY | 3.0 | 2.0 | 1370 | $1,965 | $1.43 | 19d | 1 | 0.47mi |
| 6701 Barfield Rd Louisville, KY | 3.0 | 1.0 | 900 | $1,560 | $1.73 | 24d | 1 | 0.71mi |
| 6917 Colrain Cir Louisville, KY | 3.0 | 2.0 | 1214 | $1,699 | $1.40 | 16d | 1 | 1.02mi |
| 7414 Terry Rd Louisville, KY | 3.0 | 1.0 | 1046 | $1,635 | $1.56 | 2d | 1 | 1.08mi |
Listing history 28 events
-
2026-06-17status $184,500 Pending 23 DOM
-
2026-06-16days on market $184,500 Active 23 DOM
-
2026-06-15days on market $184,500 Active 22 DOM
-
2026-06-13days on market $184,500 Active 20 DOM
-
2026-06-10days on market $184,500 Active 17 DOM
-
2026-06-09days on market $184,500 Active 16 DOM
-
2026-06-08days on market $184,500 Active 15 DOM
-
2026-06-07days on market $184,500 Active 14 DOM
-
2026-06-03days on market $184,500 Active 10 DOM
-
2026-06-02days on market $184,500 Active 9 DOM
-
2026-06-01days on market $184,500 Active 8 DOM
-
2026-05-31days on market $184,500 Active 7 DOM
-
2026-05-24$184,500 Active
-
2026-03-17status Pending
-
2026-02-25historical Active Under Contract
-
2026-02-20historical
-
2026-02-18$180,000 Active
-
2025-10-24historical
-
2025-10-07$175,000 Active
-
2022-07-12soldstatus $130,000
-
2022-05-31status Pending
-
2022-05-31historical
-
2022-05-26$135,000 Active
-
2022-05-25historical
-
2022-05-25$135,000 Active
-
2005-04-27soldstatus $83,000
-
2005-04-27soldstatus $83,000
-
2005-02-02$79,950
ⓘ Source: listings_history table (triggers on properties + properties_extension) + one-shot
backfill from property_details.listing_events for pre-trigger history.
Tax reassessment forecast KY · Resets to sale price
- Current annual tax
- $1,483 · $124/mo
- Projected year-2 tax
- $1,587 · $132/mo
- Expected delta
- +$103/yr (+$9/mo · 7.0%)
ⓘ Screening estimate from a state-policy table — verify with the county assessor before closing.
Climate risk First Street
- Flood 1/10 Low FEMA zone X (shaded) · 0% chance over 30 yrs
- Wildfire 1/10 Low
- Heat 5/10 Major 7 d/yr ≥104°F today · 22 d/yr by 30 yrs out
- Wind 2/10 Low 2% chance of damaging wind over 30 yrs
- Air quality 3/10 Moderate 2 unhealthy d/yr today · 3 by 30 yrs out
Nearby sold comps map
Loading sold comps map…
Walkable amenities ~0.75 mi
Loading nearby amenities…
Taxation est. · year 1
- Rental income
- $22,290
- − Mortgage interest
- −$10,335
- − Property taxes
- −$1,483
- − Insurance
- −$922
- − Repairs & maintenance
- −$1,783
- − Management
- −$1,783
- − Depreciation
- −$5,367
- Taxable income
- $616
- Est. tax owed @ 24.0%
- −$148
- After-tax cash flow
- $3,445/yr
For passive investors: Depreciation is non-cash, so a rental often shows a tax loss while cash-flowing — sheltering income. Rental losses are passive: they offset passive income freely, and up to $25,000/yr can offset ordinary (W-2) income if you actively participate and your MAGI is under $100k (phasing out to $0 by $150k); unused losses carry forward. On sale, claimed depreciation is recaptured at up to 25%, and gains may owe capital-gains tax (a 1031 exchange can defer both). Figures are a year-1 estimate at your 24.0% rate — not tax advice; consult a CPA.
Schools (NCES district)
- District
- Jefferson County
- NCES district ID
- 2102990
- Math proficiency
- 19% ▼ -17.00%
- Reading proficiency
- 35% ▼ -11.00%
- Median HH income
- $47,885
- Composite
- 23.45/100
- National rank
- #7884
- State rank
- #121 of 165 in KY
Livability — Louisville/Jefferson County metro government (balance)
No livability data for this city. (Only ~50 U.S. cities are tracked.)
Census & demographics
- Census place
- Louisville/Jefferson County metro government (balance), KY
- County
- Jefferson County · 790,184 people
- City population
- 419,741
- Metro
- Louisville/Jefferson County, KY-IN
- Population (ZIP)
- 26,841
- Household income
- $68,162
- Rent vs Own
- Severe rent burden
- 839.0
Population outlook (Jefferson County) Hauer SSP2
- Today (2025)
- 823,112 people
- By 2030
- 849,343 · +3.2%
- By 2040
- 895,696 · +8.8%
- By 2050
- 933,630 · +13.4%
- By 2075
- 1,028,262 · +24.9%
- By 2100
- 1,072,675 · +30.3%
Race, ethnicity, and origin ACS 2023
- Neighborhood character
- Predominantly White (67%)
- Race & ethnicity
- White 67% Black 22% Two or more races 8% Hispanic / Latino 5%
- Hispanic origin (detail)
- Mexican 3% Cuban 1%
- Common ancestry
- Iranian 2% Italian 2% Slovak 2%
- Foreign-born
- 5% · Canada
- Languages at home
- 94% English-only · Spanish 4%
Political lean MEDSL · Jefferson
- 2024 margin
- D (+16.6) · D 57.4% · R 40.9% · Other 1.7%
- 2008→2024 swing
- +4.5pp toward D · 2008: 12.0pp · 2024: 16.6pp
- All cycles
- 2024: D+16.6 2020: D+20.1 2016: D+13.3 2012: D+11.1 2008: D+12.0
Not yet ingested
- Civics
- —
Market trends
- HPI YoY
- ▼ -296.36%
- Current HPI
- 244.6667
- Rent YoY
- ▲ 0.50%
- Metro
- Louisville/Jefferson County, KY-IN
- State GDP YoY
- ▲ 1.81%
- F500 in state
- 4
Industry mix (Fortune 500 HQ in KY)
| Industry | F500 HQs | Revenue |
|---|---|---|
| Healthcare | 1 | $118B |
|
||
| Food / Beverage | 1 | $7B |
|
||
Price history
+130.8% since first listed16 events — show timeline
- 2026-05-24 Listed $184,500 Metro Search MLS
- 2026-03-17 Pending — Metro Search MLS
- 2026-02-25 Contingent — Metro Search MLS
- 2026-02-20 Listing Removed — Metro Search MLS
- 2026-02-18 Listed $180,000 Metro Search MLS
- 2025-10-24 Listing Removed — Metro Search MLS
- 2025-10-07 Listed $175,000 Metro Search MLS
- 2022-07-12 Sold (Public Records) $130,000 Public Records
- 2022-05-31 Pending — Metro Search MLS
- 2022-05-31 Listing Removed — Metro Search MLS
- 2022-05-26 Listed $135,000 Metro Search MLS
- 2022-05-25 Listed $135,000 Metro Search MLS
- 2022-05-25 Listing Removed — Metro Search MLS
- 2005-04-27 Sold (Public Records) $83,000 Public Records
- 2005-04-27 Sold (MLS) $83,000 Metro Search MLS
- 2005-02-02 Listed $79,950 Metro Search MLS
Property tax history
+4.2%/yrLatest (2025): $1,483 · -2.1% YoY. Source: county tax records.
Cash-flow waterfall
monthlySold comps — $/sqft
last 12 mo · ≤1 miLoading sold comps…