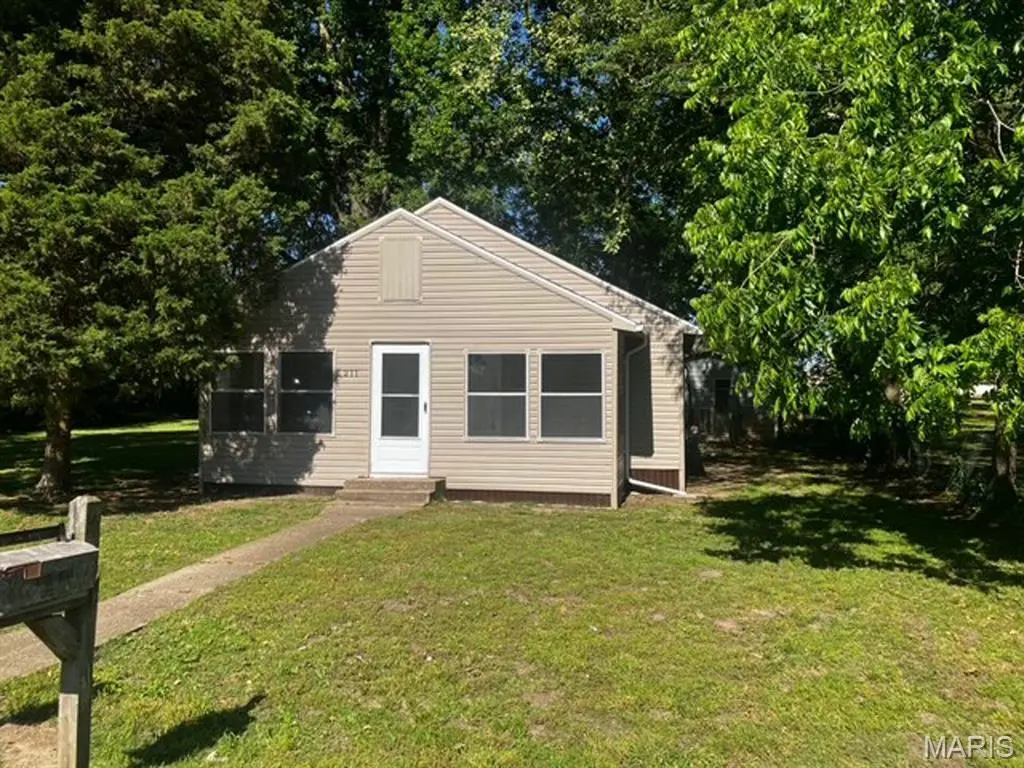
211 White Ave · Arbyrd, MO
Flood risk 1/10 · Minimal
- FEMA flood zone
- AH
- Chance of flooding over 30 yrs
- 0.0%
- Est. flood insurance / yr
- $810 – $3,808
Fire risk 1/10 · Minimal
- Est. fire insurance / yr
- $1,054 – $1,958
Heat risk 6/10 · Moderate
- Hot days now (above 109°F)
- 7 days/yr
- Hot days in 30 yrs
- 20 days/yr
Wind risk 4/10 · Minor
- Chance of severe wind over 30 yrs
- 9.0%
Air-quality risk 2/10 · Minimal
- Unhealthy air days now
- 0 days/yr
- Unhealthy air days in 30 yrs
- 1 days/yr
Risk factors via First Street. Map © Google.
Why this score? — see what drove the B grade
The composite is a weighted blend of 9 inputs, each scored 0–100. Each bar is that input's sub-score; the figure is the points it added to the 100-point composite (weight × sub-score).
- Cash flow +30.0/30.0
- 1% rule +10.0/10.0
- DSCR +10.0/10.0
- ARV discount +7.5/15.0
- Appreciation +3.8/10.0
- Livability +2.8/5.0
- Rent growth +2.5/5.0
- Condition / age +2.5/5.0
- Schools +2.3/10.0
$67,000
🖨 Deal sheet 📄 Offer letter ✓ Due diligence
Listing remarks
This charming bungalow style home presents a genuine opportunity for investors and owner-occupants ready to unlock its potential. Priced to move, it offers solid bones and room for vision—whether you're planning a renovation project, building equity, or adding to your rental portfolio. The home features 2 bedrooms and 1 bathroom, providing a straightforward layout. An open living room creates flexible space for entertaining or everyday living. Outside, a spacious backyard offers room for expansion, outdoor projects, or future improvements. A detached storage shed provides practical storage for tools, equipment, or seasonal items—a valuable asset for any investor or homeowner. Th
Key facts
- Spacious backyard
- Bungalow style home
- 0.34 acre lot
Tags
Property features AI
Exterior
- Utilities: Public water; Public sewer; Electricity connected (220 volts); Natural gas available
- Home design: Single-family residence; One story
- Construction: Vinyl siding
- Exterior features: City lot; Lot dimensions approximately 100 x 150
Interior
- Bedrooms: 2 bedrooms (both on the main level)
- Bathrooms: 1 full bathroom (on the main level)
- Heating & cooling: Natural gas heating; Ceiling fan(s) cooling; Other heating and cooling features
- Interior features: Ceiling fan(s)
Neighborhood map
What this means for you Summary
Snapshot
- This is a 2-bed/1.0-bath other listed at $67k.
Deal economics
- At list price, monthly cash flow is $365 ($4k/yr) — positive.
- The deal already cash-flows at list — no discount required.
- Meets the 1% rule at list price ($1k rent vs $67k).
Location & tenants
- Location reads 56/100 on livability (#675 in MO) — a working-class tenant base; expect higher turnover. Strengths: cost of living A+, housing A+; Watch: health & safety C-, crime F, amenities F.
- Southland C-9 (rural): math 20% / reading 30% proficiency, ranked #494 of 535 in MO (top 92%) — low school quality limits family demand, transient renter base, plan for 1-2y turnover; 67% free/reduced lunch — lower-income household profile, screen leases tightly.
- Zoned schools: Southland Elem. (math 5% / reading 5%, grade F, #1,072 of 1,115 statewide, top 98%, 148 students, 98% FRL); Southland High (math 12% / reading 27%, grade F, #478 of 521 statewide, top 92%, 101 students, 97% FRL) — zoned schools average 98% FRL vs 67% district-wide (31 pts higher); higher-poverty schools than district average — tighter screening recommended.
- Zoned-school proficiency averages 12% at this address vs 25% district-wide (-13 pts) — the specific schools serving this property underperform the Southland C-9 average; the district grade overstates school quality for this exact location.
- Market conditions: 1 active listings in the ZIP; 30 units permitted in Dunklin County in 2024 (0 in 5+ unit buildings).
Forward outlook
- Local home prices are declining (-2.4%/yr); year-one equity from $463 of loan paydown is wiped out by about $2k of value loss. Plan a longer hold.
- Dunklin County population projected at -22% by 2050 — secular population decline; favor cash flow + early exit over multi-decade hold.
- At projected returns (-2.4% appreciation + 3.0% rent growth), your $19k cash investment doubles in ~5 years — after that, you're playing with house money.
Negotiation context
- Only 14 days on market — expect competitive offers; lowballing is unlikely to land.
- 4 sale attempts since 4y ago with the ask held roughly flat each time — persistent listings suggest the price (not the market) is what's stuck; bring a comps-based counter.
Risks & watch-outs
- Watch-outs: flood insurance adds $192/mo; built in 1955 — expect roof / HVAC / electrical / plumbing capex.
- Climate carrying-cost: in FEMA flood zone AH (mandatory federal flood insurance); extreme-heat days projected 7→20/yr by 2055 (HVAC capex compounding) — expect insurance premiums to compound above CPI over the hold.
Questions for the listing agent
- Built in 1955 — when were the roof, HVAC, electrical panel, plumbing, and water heater last replaced?
- What's the actual annual flood-insurance premium (NFIP or private), and is the property in a SFHA with mandatory coverage?
- Is there a deadline driving the sale (1031 exchange, divorce, estate, relocation)? That informs how much negotiation room exists.
- Schools are F-rated, which usually means shorter tenancies and higher turnover. Who's the typical renter profile here, and what's been the actual vacancy rate?
- Crime grade is F in this area — have there been break-ins, vandalism, or insurance claims at this property in the last 3 years? What carrier currently insures it and at what premium?
- What's the average days-on-market for RENTAL listings here right now (not sales)? A rising rental-DOM trend means longer vacancies and softer asking-rent achievability than the comps imply.
- What's the recent tenant-quality profile in this submarket — average credit score on applications, eviction rate, late-payment / NSF rate, and stable-employment percentage? A property-management company in the area should have these aggregated.
- How much new for-sale + rental construction is in the pipeline within 1–3 miles? Heavy new supply typically softens prices + rents 12–24 months out; constrained supply supports both.
Investment metrics
- 1% rule
- 1.80% ✓
- Cap rate
- 16.28%
- Cash-on-cash
- 35.66%
- DSCR
- 2.59
- GRM
- 4.6
CMA / ARV
No comps found within radius.
Projected returns pro-forma
-2.38% appreciation · 3.0% rent growth · sell at horizon
- IRR
- 18.1%
- Equity multiple
- 1.76×
- Total profit
- $14,244
- Equity at exit
- $11,861
- IRR
- 25.6%
- Equity multiple
- 3.36×
- Total profit
- $44,262
- Equity at exit
- $9,059
Cash invested: $18,760 (down + closing). Projections, not guarantees.
Landlord ↔ Tenant lean methodology
- Overall (STATE)
- 81 Strongly Landlord-Friendly
- State Missouri
- 81 Strongly Landlord-Friendly · R+10
- County
- — inherits STATE
- City
- — inherits STATE
ZIP-level market 63821
- Home prices YoY
- -3.3%
- Active inventory
- 1
- Price-to-rent
- 4.6×
Monthly cashflow live
- Estimated rent
- $1,206 medium interval (Pro) →
- Mortgage (P&I)
- −$351
- Tax from tax record
- −$16 /mo · $194/yr
- Insurance
- −$28
- Flood insurance flood zone
- −$192 /mo · $2,309/yr
- HOA
- −$0
- Vacancy / Maint / Mgmt
- −$253
- Net cashflow
- $365
Break-even live
UW: 25.0% down · 7.5% · 30yr · 1.5% tax · 5.0% vac · 8.0% maint · 8.0% mgmt
Financing live
Cash to close
- Down payment
- $16,750
- Closing costs
- $2,010
- Reserves months
- —
- Total cash needed
- —
Loan-product check · same deal, 3 products live
Conventional
25% down · 7.5% · 30yr
- Down + closing
- —
- Monthly P&I
- —
- Monthly cashflow
- —
- DSCR
- —
- Eligible?
- —
Personal DTI + credit; lowest rate.
DSCR
20% down · 8.5% · 30yr
- Down + closing
- —
- Monthly P&I
- —
- Monthly cashflow
- —
- DSCR
- —
- Eligible?
- —
No personal income docs; deal must DSCR.
Hard money
10% down · 12.0% · 12mo
- Down + closing
- —
- Monthly P&I
- —
- Monthly cashflow
- —
- DSCR
- —
- Eligible?
- —
Short-term bridge; refi at stabilization.
Listing history 11 events
-
2026-06-19days on market $67,000 Active 14 DOM
-
2026-06-18days on market $67,000 Active 13 DOM
-
2026-06-17days on market $67,000 Active 12 DOM
-
2026-06-16days on market $67,000 Active 11 DOM
-
2026-06-15days on market $67,000 Active 10 DOM
-
2026-06-14days on market $67,000 Active 8 DOM
-
2026-06-12days on market $67,000 Active 7 DOM
-
2026-06-09days on market $67,000 Active 4 DOM
-
2026-06-08days on market $67,000 Active 3 DOM
-
2026-06-07remarks 687-char remark
-
2026-06-07$67,000 Active 2 DOM
ⓘ Source: listings_history table (triggers on properties + properties_extension) + one-shot
backfill from property_details.listing_events for pre-trigger history.
Tax reassessment forecast MO · Resets to sale price
- Current annual tax
- $194 · $16/mo
- Projected year-2 tax
- $650 · $54/mo
- Expected delta
- +$456/yr (+$38/mo · 234.6%)
ⓘ Screening estimate from a state-policy table — verify with the county assessor before closing.
Climate risk First Street
- Flood 1/10 Low FEMA zone AH · 0% chance over 30 yrs
- Wildfire 1/10 Low
- Heat 6/10 Major 7 d/yr ≥109°F today · 20 d/yr by 30 yrs out
- Wind 4/10 Moderate 9% chance of damaging wind over 30 yrs
- Air quality 2/10 Low 0 unhealthy d/yr today · 1 by 30 yrs out
Nearby sold comps map
Loading sold comps map…
Walkable amenities ~0.75 mi
Loading nearby amenities…
Taxation est. · year 1
- Rental income
- $14,474
- − Mortgage interest
- −$3,753
- − Property taxes
- −$194
- − Insurance
- −$2,644
- − Repairs & maintenance
- −$1,158
- − Management
- −$1,158
- − Depreciation
- −$1,949
- Taxable income
- $3,618
- Est. tax owed @ 24.0%
- −$868
- After-tax cash flow
- $3,512/yr
For passive investors: Depreciation is non-cash, so a rental often shows a tax loss while cash-flowing — sheltering income. Rental losses are passive: they offset passive income freely, and up to $25,000/yr can offset ordinary (W-2) income if you actively participate and your MAGI is under $100k (phasing out to $0 by $150k); unused losses carry forward. On sale, claimed depreciation is recaptured at up to 25%, and gains may owe capital-gains tax (a 1031 exchange can defer both). Figures are a year-1 estimate at your 24.0% rate — not tax advice; consult a CPA.
Schools (NCES district)
- District
- Southland C-9
- NCES district ID
- 2928620
- Math proficiency
- 20% ▬ 0.00%
- Reading proficiency
- 30% ▼ -5.00%
- Median HH income
- $29,586
- Composite
- 23.13/100
- National rank
- #13345
- State rank
- #494 of 535 in MO
Livability — Arbyrd
- Score
- 56/100
- State rank
- #675
- US rank
- #22405
Category grades
Schools grade is shown separately in the Schools card above.
Census & demographics
- Census place
- Arbyrd, MO
- City population
- 627
- Population (ZIP)
- 627
Population outlook (Dunklin County) Hauer SSP2
- Today (2025)
- 28,599 people
- By 2030
- 27,230 · -4.8%
- By 2040
- 24,696 · -13.6%
- By 2050
- 22,402 · -21.7%
- By 2075
- 17,776 · -37.8%
- By 2100
- 13,890 · -51.4%
Race, ethnicity, and origin ACS 2023
- Neighborhood character
- Predominantly White (70%)
- Race & ethnicity
- White 70% Two or more races 23% Hispanic / Latino 22%
- Hispanic origin (detail)
- Mexican 22%
- Common ancestry
- Scotch-Irish 4% Slovak 4% Iranian 2%
- Foreign-born
- 9% · Canada
- Languages at home
- 84% English-only · Spanish 16%
Political lean MEDSL · Dunklin
- 2024 margin
- Solid R (+61.8) · D 18.8% · R 80.5%
- 2008→2024 swing
- -40.5pp toward R · 2008: -21.3pp · 2024: -61.8pp
- All cycles
- 2024: R+61.8 2020: R+57.0 2016: R+53.6 2012: R+30.2 2008: R+21.3
Not yet ingested
- Civics
- —
Market trends
- HPI YoY
- ▼ -2.38%
- Current HPI
- 70.1107
- Rent YoY
- —
- Metro
- —
- State GDP YoY
- ▲ 1.84%
- F500 in state
- 20
Industry mix (Fortune 500 HQ in MO)
| Industry | F500 HQs | Revenue |
|---|---|---|
| Healthcare | 1 | $163B |
|
||
| Insurance | 1 | $21B |
|
||
| Industrial Technology | 1 | $17B |
|
||
| Retail | 1 | $16B |
|
||
| Industrial Distribution | 1 | $10B |
|
||
| Utilities | 1 | $9B |
|
||
Price history
+35.4% since first listed9 events — show timeline
- 2026-06-05 Listed $67,000 MARIS as Distributed by MLS Grid
- 2025-05-13 Listing Removed — CARMLS
- 2024-11-01 Relisted — CARMLS
- 2024-11-01 Listing Removed — CARMLS
- 2023-10-16 Listed $48,000 CARMLS
- 2023-06-06 Listing Removed — CARMLS
- 2022-09-10 Price Changed $48,000 CARMLS
- 2022-07-03 Listed $49,500 CARMLS
- 2001-06-06 Sold (Public Records) — Public Records
Property tax history
+3.2%/yrLatest (2025): $194 · +1.2% YoY. Source: county tax records.
Cash-flow waterfall
monthlySold comps — $/sqft
last 12 mo · ≤1 miLoading sold comps…