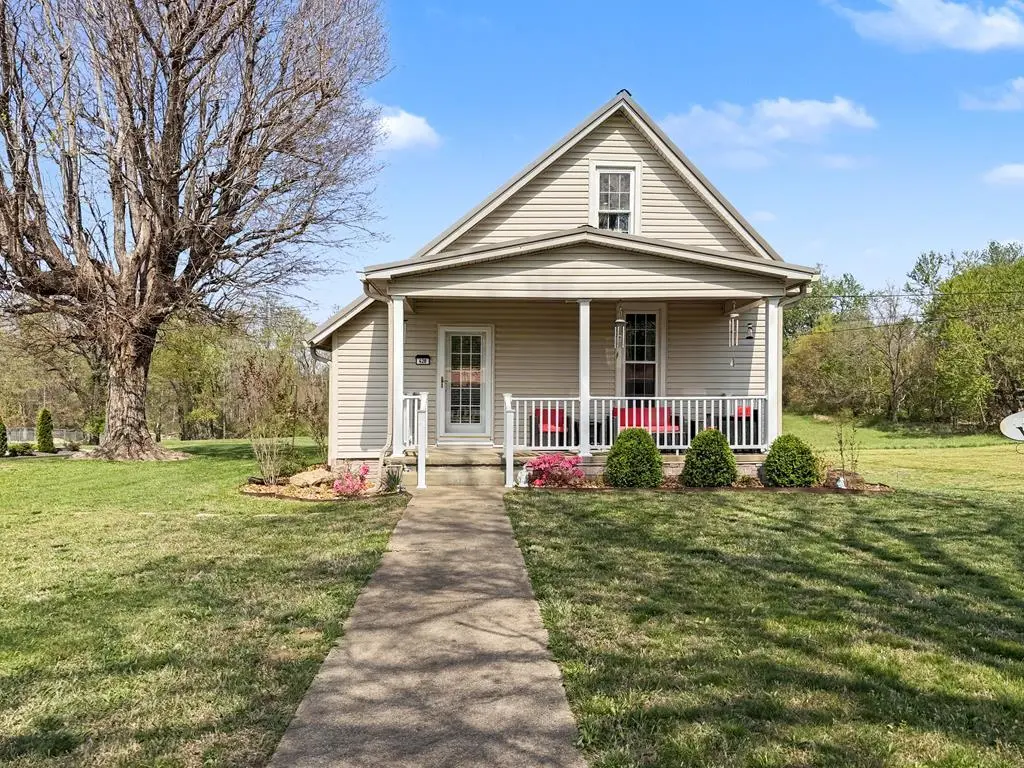
428 S US Highway 41a · Dixon, KY
Flood risk No data
- FEMA flood zone
- —
- Chance of flooding over 30 yrs
- —
- Est. flood insurance / yr
- —
Fire risk No data
- Est. fire insurance / yr
- —
Heat risk No data
- Hot days now (above threshold)
- —
- Hot days in 30 yrs
- —
Wind risk No data
- Chance of severe wind over 30 yrs
- —
Air-quality risk No data
- Unhealthy air days now
- —
- Unhealthy air days in 30 yrs
- —
Risk factors via First Street. Map © Google.
Why this score? — see what drove the C- grade
The composite is a weighted blend of 9 inputs, each scored 0–100. Each bar is that input's sub-score; the figure is the points it added to the 100-point composite (weight × sub-score).
- Cash flow +15.9/30.0
- Appreciation +9.9/10.0
- ARV discount +7.5/15.0
- DSCR +4.9/10.0
- 1% rule +3.6/10.0
- Livability +3.2/5.0
- Rent growth +2.5/5.0
- Schools +2.5/10.0
- Condition / age +2.5/5.0
$119,900
🖨 Deal sheet 📄 Offer letter ✓ Due diligence
Listing remarks
Spacious two-bedroom home with a flexible floor plan offering additional rooms that can be used as office space, guest rooms, or extra living areas. The main level features a large living room, kitchen with space for dining, and multiple rooms that provide versatility to fit your needs. Upstairs includes a second bedroom along with an additional finished room that could serve as a dressing room, office, or bonus space. Situated along US Highway 41A, this property offers excellent visibility and potential for a home-based business or future commercial use (subject to zoning approval). The property also includes a cellar with exterior access, ideal for storage or use as a storm shelter. Uniqu
Key facts
- Dressing room
- Flexible floor plan
- Finished room
Tags
Property features AI
Finance
- Other: Lot approximately 0.5 acre (147 x 147)
Exterior
- Parking: Gravel parking
- Utilities: Public sewer
- Home design: Single-family residence (residential property)
- Construction: Vinyl siding; Wood siding
- Exterior features: Covered deck; Metal roof
Interior
- Bedrooms: 2 bedrooms on the main level
- Flooring: Laminate flooring; Tile flooring
- Bathrooms: 1 full bathroom on the main level
- Heating & cooling: Natural gas heating; Central air; Ceiling fan(s)
- Interior features: Gas water heater; Smoke detector(s); Satellite dish
Neighborhood map
What this means for you Summary
Snapshot
- This is a 2-bed/1.0-bath other listed at $120k.
Deal economics
- At list price, monthly cash flow is $58 ($690/yr) — positive.
- The deal already cash-flows at list — no discount required.
- To meet the 1% rule (rent ≥ 1% of price), the offer needs to be $103k (14.4% below list).
- Recommended offer: $103k (14.4% below list) — sets the bar for 1% rule.
Location & tenants
- Location reads 63/100 on livability (#324 in KY) — a middle-class / working-renter tenant base. Strengths: crime A+, cost of living A+, housing A+; Watch: schools F, amenities F, commute F.
- Webster County (rural): math 25% / reading 34% proficiency, ranked #114 of 165 in KY (top 69%) — low school quality limits family demand, transient renter base, plan for 1-2y turnover.
- Market conditions: 11 active listings in the ZIP; 6 units permitted in Webster County in 2024 (0 in 5+ unit buildings).
Forward outlook
- In year one you build about $12k of equity ($829 loan paydown + $12k appreciation (9.7% local appreciation)).
- Webster County population projected at -14% by 2050 — secular population decline; favor cash flow + early exit over multi-decade hold.
- At projected returns (9.7% appreciation + 3.0% rent growth), your $34k cash investment doubles in ~3 years — after that, you're playing with house money.
- By year 3, paydown + projected appreciation supports a ~$32k cash-out refi (75% LTV) — recoverable capital for the next deal without selling this one.
Negotiation context
- It's been on market 21 days — a 2% lower offer ($118k) is reasonable based on typical stale-listing flexibility.
Questions for the listing agent
- Is there a deadline driving the sale (1031 exchange, divorce, estate, relocation)? That informs how much negotiation room exists.
- Schools are F-rated, which usually means shorter tenancies and higher turnover. Who's the typical renter profile here, and what's been the actual vacancy rate?
- What's the average days-on-market for RENTAL listings here right now (not sales)? A rising rental-DOM trend means longer vacancies and softer asking-rent achievability than the comps imply.
- What's the recent tenant-quality profile in this submarket — average credit score on applications, eviction rate, late-payment / NSF rate, and stable-employment percentage? A property-management company in the area should have these aggregated.
- How much new for-sale + rental construction is in the pipeline within 1–3 miles? Heavy new supply typically softens prices + rents 12–24 months out; constrained supply supports both.
Investment metrics
- 1% rule
- 0.86% ✗
- Cap rate
- 6.87%
- Cash-on-cash
- 2.06%
- DSCR
- 1.09
- GRM
- 9.7
CMA / ARV
No comps found within radius.
Projected returns pro-forma
9.71% appreciation · 3.0% rent growth · sell at horizon
- IRR
- 25.2%
- Equity multiple
- 2.98×
- Total profit
- $66,541
- Equity at exit
- $105,470
- IRR
- 22.2%
- Equity multiple
- 6.73×
- Total profit
- $192,400
- Equity at exit
- $224,796
Cash invested: $33,572 (down + closing). Projections, not guarantees.
Landlord ↔ Tenant lean methodology
- Overall (STATE)
- 83 Strongly Landlord-Friendly
- State Kentucky
- 83 Strongly Landlord-Friendly · R+16
- County
- — inherits STATE
- City
- — inherits STATE
ZIP-level market 42409
- Home prices YoY
- 4.1%
- Active inventory
- 11
- Price-to-rent
- 9.7×
Monthly cashflow live
- Estimated rent
- $1,027 medium interval (Pro) →
- Mortgage (P&I)
- −$629
- Tax from tax record
- −$75 /mo · $898/yr
- Insurance
- −$50
- HOA
- −$0
- Vacancy / Maint / Mgmt
- −$216
- Net cashflow
- $58
Break-even live
UW: 25.0% down · 7.5% · 30yr · 1.5% tax · 5.0% vac · 8.0% maint · 8.0% mgmt
Financing live
Cash to close
- Down payment
- $29,975
- Closing costs
- $3,597
- Reserves months
- —
- Total cash needed
- —
Loan-product check · same deal, 3 products live
Conventional
25% down · 7.5% · 30yr
- Down + closing
- —
- Monthly P&I
- —
- Monthly cashflow
- —
- DSCR
- —
- Eligible?
- —
Personal DTI + credit; lowest rate.
DSCR
20% down · 8.5% · 30yr
- Down + closing
- —
- Monthly P&I
- —
- Monthly cashflow
- —
- DSCR
- —
- Eligible?
- —
No personal income docs; deal must DSCR.
Hard money
10% down · 12.0% · 12mo
- Down + closing
- —
- Monthly P&I
- —
- Monthly cashflow
- —
- DSCR
- —
- Eligible?
- —
Short-term bridge; refi at stabilization.
Listing history 12 events
-
2026-06-18days on market $119,900 Active 21 DOM
-
2026-06-17days on market $119,900 Active 20 DOM
-
2026-06-16days on market $119,900 Active 19 DOM
-
2026-06-15days on market $119,900 Active 18 DOM
-
2026-06-13days on market $119,900 Active 16 DOM
-
2026-06-12days on market $119,900 Active 15 DOM
-
2026-06-09days on market $119,900 Active 12 DOM
-
2026-06-08days on market $119,900 Active 11 DOM
-
2026-06-07days on market $119,900 Active 10 DOM
-
2026-06-07statusdays on market $119,900 Active 9 DOM
-
2026-04-16status Pending
-
2026-04-09$119,900 Active
ⓘ Source: listings_history table (triggers on properties + properties_extension) + one-shot
backfill from property_details.listing_events for pre-trigger history.
Tax reassessment forecast KY · Resets to sale price
- Current annual tax
- $898 · $75/mo
- Projected year-2 tax
- $1,031 · $86/mo
- Expected delta
- +$134/yr (+$11/mo · 14.9%)
ⓘ Screening estimate from a state-policy table — verify with the county assessor before closing.
Nearby sold comps map
Loading sold comps map…
Walkable amenities ~0.75 mi
Loading nearby amenities…
Taxation est. · year 1
- Rental income
- $12,320
- − Mortgage interest
- −$6,716
- − Property taxes
- −$898
- − Insurance
- −$600
- − Repairs & maintenance
- −$986
- − Management
- −$986
- − Depreciation
- −$3,488
- Taxable loss
- −$1,353
- Est. tax savings @ 24.0%
- +$325
- After-tax cash flow
- $1,015/yr
For passive investors: Depreciation is non-cash, so a rental often shows a tax loss while cash-flowing — sheltering income. Rental losses are passive: they offset passive income freely, and up to $25,000/yr can offset ordinary (W-2) income if you actively participate and your MAGI is under $100k (phasing out to $0 by $150k); unused losses carry forward. On sale, claimed depreciation is recaptured at up to 25%, and gains may owe capital-gains tax (a 1031 exchange can defer both). Figures are a year-1 estimate at your 24.0% rate — not tax advice; consult a CPA.
Schools (NCES district)
- District
- Webster County
- NCES district ID
- 2105820
- Math proficiency
- 25% ▼ -17.00%
- Reading proficiency
- 34% ▼ -16.00%
- Median HH income
- $39,542
- Composite
- 24.76/100
- National rank
- #7600
- State rank
- #114 of 165 in KY
Livability — Dixon
- Score
- 63/100
- State rank
- #324
- US rank
- #15561
Category grades
Schools grade is shown separately in the Schools card above.
Census & demographics
- Census place
- Dixon, KY
- Population (ZIP)
- 2,319
Population outlook (Webster County) Hauer SSP2
- Today (2025)
- 12,548 people
- By 2030
- 12,119 · -3.4%
- By 2040
- 11,345 · -9.6%
- By 2050
- 10,761 · -14.2%
- By 2075
- 10,166 · -19.0%
- By 2100
- 10,546 · -16.0%
Race, ethnicity, and origin ACS 2023
- Neighborhood character
- Predominantly White (95%)
- Race & ethnicity
- White 95% Black 3%
- Common ancestry
- Italian 12% Serbian 3% Slovak 1%
- Foreign-born
- 1% · Canada, South Korea
- Languages at home
- 98% English-only · German/W. Germanic 1% Spanish 0%
Political lean MEDSL · Webster
- 2024 margin
- Solid R (+57.4) · D 20.8% · R 78.1% · Other 1.1%
- 2008→2024 swing
- -45.7pp toward R · 2008: -11.7pp · 2024: -57.4pp
- All cycles
- 2024: R+57.4 2020: R+51.6 2016: R+54.4 2012: R+33.7 2008: R+11.7
Not yet ingested
- Civics
- —
Market trends
- HPI YoY
- ▲ 9.71%
- Current HPI
- 244.2889
- Rent YoY
- —
- Metro
- —
- State GDP YoY
- ▲ 1.81%
- F500 in state
- 4
Industry mix (Fortune 500 HQ in KY)
| Industry | F500 HQs | Revenue |
|---|---|---|
| Healthcare | 1 | $118B |
|
||
| Food / Beverage | 1 | $7B |
|
||
Price history
2 events — show timeline
- 2026-04-16 Pending — MHCBOR
- 2026-04-09 Listed $119,900 MHCBOR
Property tax history
+19.2%/yrLatest (2025): $898 · -0.1% YoY. Source: county tax records.
Cash-flow waterfall
monthlySold comps — $/sqft
last 12 mo · ≤1 miLoading sold comps…