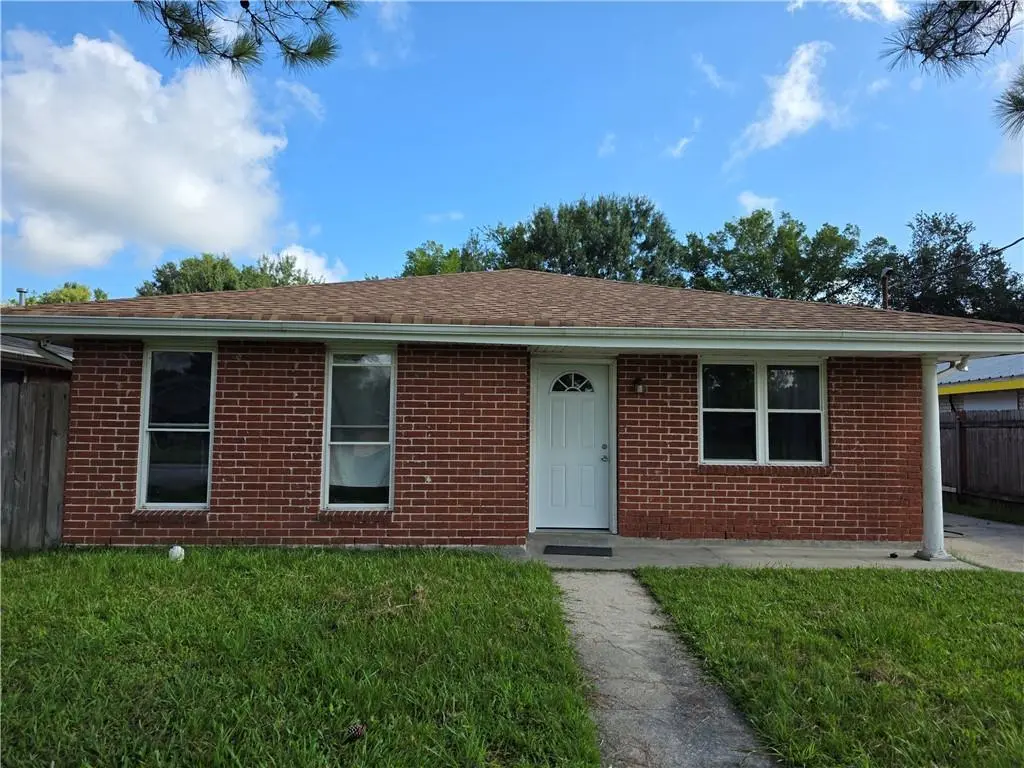
2732 Reunion Dr · Violet, LA
Flood risk 8/10 · Major
- FEMA flood zone
- X (shaded)
- Chance of flooding over 30 yrs
- 0.6%
- Est. flood insurance / yr
- $507 – $1,088
Fire risk 1/10 · Minimal
- Est. fire insurance / yr
- $1,269 – $2,357
Heat risk 10/10 · Severe
- Hot days now (above 108°F)
- 7 days/yr
- Hot days in 30 yrs
- 21 days/yr
Wind risk 10/10 · Severe
- Chance of severe wind over 30 yrs
- 99.0%
Air-quality risk 2/10 · Minimal
- Unhealthy air days now
- 1 days/yr
- Unhealthy air days in 30 yrs
- 2 days/yr
Risk factors via First Street. Map © Google.
Why this score? — see what drove the C+ grade
The composite is a weighted blend of 9 inputs, each scored 0–100. Each bar is that input's sub-score; the figure is the points it added to the 100-point composite (weight × sub-score).
- Cash flow +24.2/30.0
- ARV discount +12.2/15.0
- DSCR +7.8/10.0
- 1% rule +5.5/10.0
- Schools +5.0/10.0
- Livability +3.0/5.0
- Rent growth +2.5/5.0
- Condition / age +2.5/5.0
- Appreciation +0.8/10.0
$165,000
🖨 Deal sheet 📄 Offer letter ✓ Due diligence
Listing remarks MLS
See this beautifully updated brick home in Violet! Featuring three spacious bedrooms (with the potential for a 4th), 1.5 baths, and brand new tile flooring in the kitchen and dining area. Granite countertops, washer & dryer hookups, spacious bedrooms, and a newer roof. All measurements are deemed reliable but not guaranteed.
Key facts
- Updated brick home
- Newer roof
- Granite countertops
Tags
Neighborhood map
What this means for you Summary
Snapshot
- This is a 3-bed/1.5-bath single-family listed at $165k.
Deal economics
- At list price, monthly cash flow is $263 ($3k/yr) — positive.
- The deal already cash-flows at list — no discount required.
- Meets the 1% rule at list price ($2k rent vs $165k).
- Recommended offer: $145k (12.0% below list) — sets the bar for market timing.
Location & tenants
- Location reads 59/100 on livability (#269 in LA) — a working-class tenant base; expect higher turnover. Strengths: cost of living A+, housing A+; Watch: crime F, amenities F, commute F.
- Market conditions: 53 active listings in the ZIP; 112 units permitted in St. Bernard Parish in 2024 (0 in 5+ unit buildings).
Forward outlook
- Local home prices are declining (-3.0%/yr); year-one equity from $1k of loan paydown is wiped out by about $5k of value loss. Plan a longer hold.
- St. Bernard County population projected at +89% by 2050 — long-run rental-demand tailwind backs the buy-and-hold thesis.
Negotiation context
- It's been on market 313 days — a 12% lower offer ($145k) is reasonable based on typical stale-listing flexibility.
- 7 sale attempts since 4y ago with the ask held roughly flat each time — persistent listings suggest the price (not the market) is what's stuck; bring a comps-based counter.
- Current owner paid $76k; list at $165k implies a 119% gain — meaningful room to come down on a strong offer.
Risks & watch-outs
- Watch-outs: flood insurance adds $66/mo.
- Climate carrying-cost: severe flood risk; severe wind risk, 99% chance of damaging wind over 30y; extreme-heat days projected 7→21/yr by 2055 (HVAC capex compounding) — expect insurance premiums to compound above CPI over the hold.
Questions for the listing agent
- It's been on market 313 days. Have you received any prior offers? Is the seller open to a 12% concession, seller financing, or rate buy-down credit?
- Built in 1973 — when were the roof, HVAC, electrical panel, plumbing, and water heater last replaced?
- What's the actual annual flood-insurance premium (NFIP or private), and is the property in a SFHA with mandatory coverage?
- Why hasn't it sold? Are there any deal-killer items the seller is aware of (foundation, flood, title, zoning, code violations)?
- Is there a deadline driving the sale (1031 exchange, divorce, estate, relocation)? That informs how much negotiation room exists.
- Crime grade is F in this area — have there been break-ins, vandalism, or insurance claims at this property in the last 3 years? What carrier currently insures it and at what premium?
- What's the average days-on-market for RENTAL listings here right now (not sales)? A rising rental-DOM trend means longer vacancies and softer asking-rent achievability than the comps imply.
- What's the recent tenant-quality profile in this submarket — average credit score on applications, eviction rate, late-payment / NSF rate, and stable-employment percentage? A property-management company in the area should have these aggregated.
- How much new for-sale + rental construction is in the pipeline within 1–3 miles? Heavy new supply typically softens prices + rents 12–24 months out; constrained supply supports both.
Investment metrics
- 1% rule
- 1.05% ✓
- Cap rate
- 8.69%
- Cash-on-cash
- 8.56%
- DSCR
- 1.38
- GRM
- 8.0
CMA / ARV
- ARV (median comp)
- $184,353
- List price
- $165,000
- Delta
- -10.50%
- Verdict
- UNDERPRICED
- Comps
- 20 within 1.0 mi
Show comp detail 9 sales within ~0.75 mi
| Address | Dist | Beds/Ba | Sqft | Sold | Price | $/sf | Match |
|---|---|---|---|---|---|---|---|
| 2516 Kingbird Blvd | 0.58mi | 3/2.0 | 1,232 (+1%) | 3mo | $120,000 | $97 | 67 |
| 2012 Redbird Dr | 0.58mi | 3/2.0 | 1,238 (+1%) | 6mo | $62,500 | $50 | 64 |
| 2617 Meadowlark Dr | 0.55mi | 3/2.0 | 1,226 (+0%) | 13mo | $175,000 | $143 | 62 |
| 2108 River Queen Dr | 0.56mi | 3/1.0 | 1,184 (-3%) | 11mo | $118,750 | $100 | 57 |
| 2608 Flamingo Dr | 0.55mi | 3/2.0 | 1,200 (-2%) | 15mo | $163,000 | $136 | 56 |
| 2605 Meadowlark Dr | 0.58mi | 3/2.0 | 1,237 (+1%) | 16mo | $122,000 | $99 | 56 |
| 2009 Redbird Dr | 0.56mi | 3/2.0 | 1,246 (+2%) | 20mo | $172,500 | $138 | 53 |
| 2221 Riverbend Dr | 0.42mi | 3/1.0 | 1,105 (-10%) | 12mo | $179,900 | $163 | 52 |
| 2013 S River Park Dr | 0.65mi | 3/1.5 | 1,245 (+2%) | 20mo | $130,000 | $104 | 50 |
Match score weights: distance 35% · size 25% · config 20% · recency 20%. Top-matched comps best support the ARV.
Projected returns pro-forma
-3.0% appreciation · 3.0% rent growth · sell at horizon
- IRR
- -5.8%
- Equity multiple
- 0.78×
- Total profit
- $-9,975
- Equity at exit
- $24,602
- IRR
- 3.8%
- Equity multiple
- 1.28×
- Total profit
- $12,905
- Equity at exit
- $14,266
Cash invested: $46,200 (down + closing). Projections, not guarantees.
Landlord ↔ Tenant lean methodology
- Overall (STATE)
- 90 Strongly Landlord-Friendly
- State Louisiana
- 90 Strongly Landlord-Friendly · R+12
- County
- — inherits STATE
- City
- — inherits STATE
ZIP-level market 70092
- Home prices YoY
- -3.7%
- Active inventory
- 53
- Price-to-rent
- 8.0×
Monthly cashflow live
- Estimated rent
- $1,728 medium interval (Pro) →
- Mortgage (P&I)
- −$865
- Tax from tax record
- −$101 /mo · $1,214/yr
- Insurance
- −$69
- Flood insurance flood zone
- −$66 /mo · $798/yr
- HOA
- −$0
- Vacancy / Maint / Mgmt
- −$363
- Net cashflow
- $263
Break-even live
UW: 25.0% down · 7.5% · 30yr · 1.5% tax · 5.0% vac · 8.0% maint · 8.0% mgmt
Financing live
Cash to close
- Down payment
- $41,250
- Closing costs
- $4,950
- Reserves months
- —
- Total cash needed
- —
Loan-product check · same deal, 3 products live
Conventional
25% down · 7.5% · 30yr
- Down + closing
- —
- Monthly P&I
- —
- Monthly cashflow
- —
- DSCR
- —
- Eligible?
- —
Personal DTI + credit; lowest rate.
DSCR
20% down · 8.5% · 30yr
- Down + closing
- —
- Monthly P&I
- —
- Monthly cashflow
- —
- DSCR
- —
- Eligible?
- —
No personal income docs; deal must DSCR.
Hard money
10% down · 12.0% · 12mo
- Down + closing
- —
- Monthly P&I
- —
- Monthly cashflow
- —
- DSCR
- —
- Eligible?
- —
Short-term bridge; refi at stabilization.
Listing history 30 events
-
2026-06-18days on market $165,000 Active 313 DOM
-
2026-06-17days on market $165,000 Active 312 DOM
-
2026-06-16days on market $165,000 Active 311 DOM
-
2026-06-15days on market $165,000 Active 310 DOM
-
2026-06-13days on market $165,000 Active 308 DOM
-
2026-06-10days on market $165,000 Active 305 DOM
-
2026-06-09days on market $165,000 Active 304 DOM
-
2026-06-08days on market $165,000 Active 303 DOM
-
2026-06-07days on market $165,000 Active 302 DOM
-
2026-06-03days on market $165,000 Active 298 DOM
-
2026-06-02days on market $165,000 Active 297 DOM
-
2026-06-01days on market $165,000 Active 296 DOM
-
2026-05-31days on market $165,000 Active 295 DOM
-
2025-10-07status Active 332-char remark
Show marketing remark (332 chars)
See this beautifully updated brick home in Violet! Featuring three spacious bedrooms (with the potential for a 4th), 1.5 baths, and brand new tile flooring in the kitchen and dining area. Granite countertops, washer & dryer hookups, spacious bedrooms, and a newer roof. All measurements are deemed reliable but not guaranteed.
-
2025-09-30status Pending 332-char remark
Show marketing remark (332 chars)
See this beautifully updated brick home in Violet! Featuring three spacious bedrooms (with the potential for a 4th), 1.5 baths, and brand new tile flooring in the kitchen and dining area. Granite countertops, washer & dryer hookups, spacious bedrooms, and a newer roof. All measurements are deemed reliable but not guaranteed.
-
2025-08-02$165,000 Active 330-char remark
Show marketing remark (332 chars)
See this beautifully updated brick home in Violet! Featuring three spacious bedrooms (with the potential for a 4th), 1.5 baths, and brand new tile flooring in the kitchen and dining area. Granite countertops, washer & dryer hookups, spacious bedrooms, and a newer roof. All measurements are deemed reliable but not guaranteed.
-
2025-08-02$165,000 Active 332-char remark
Show marketing remark (332 chars)
See this beautifully updated brick home in Violet! Featuring three spacious bedrooms (with the potential for a 4th), 1.5 baths, and brand new tile flooring in the kitchen and dining area. Granite countertops, washer & dryer hookups, spacious bedrooms, and a newer roof. All measurements are deemed reliable but not guaranteed.
-
2023-07-11price $120,000
-
2023-06-20$120,000
-
2022-07-06soldstatus $75,500
-
2022-07-01soldstatus $75,500 Closed
-
2022-06-20status Pending
-
2022-06-15price $70,000
-
2022-06-15status Active
-
2022-05-17historical
-
2022-05-11status Pending
-
2022-05-09$70,000
-
2022-05-09$159,900 Active
-
2007-08-06soldstatus $25,000
-
1994-10-03soldstatus $32,000
ⓘ Source: listings_history table (triggers on properties + properties_extension) + one-shot
backfill from property_details.listing_events for pre-trigger history.
Tax reassessment forecast LA · Resets to sale price
- Current annual tax
- $1,214 · $101/mo
- Projected year-2 tax
- $1,214 · $101/mo
- Expected delta
- $0/yr ($0/mo · 0.0%)
ⓘ Screening estimate from a state-policy table — verify with the county assessor before closing.
Climate risk First Street
- Flood 8/10 Severe FEMA zone X (shaded) · 60% chance over 30 yrs
- Wildfire 1/10 Low
- Heat 10/10 Extreme 7 d/yr ≥108°F today · 21 d/yr by 30 yrs out
- Wind 10/10 Extreme 99% chance of damaging wind over 30 yrs
- Air quality 2/10 Low 1 unhealthy d/yr today · 2 by 30 yrs out
Nearby sold comps map
Loading sold comps map…
Walkable amenities ~0.75 mi
Loading nearby amenities…
Taxation est. · year 1
- Rental income
- $20,731
- − Mortgage interest
- −$9,243
- − Property taxes
- −$1,214
- − Insurance
- −$1,622
- − Repairs & maintenance
- −$1,659
- − Management
- −$1,659
- − Depreciation
- −$4,800
- Taxable income
- $535
- Est. tax owed @ 24.0%
- −$128
- After-tax cash flow
- $3,029/yr
For passive investors: Depreciation is non-cash, so a rental often shows a tax loss while cash-flowing — sheltering income. Rental losses are passive: they offset passive income freely, and up to $25,000/yr can offset ordinary (W-2) income if you actively participate and your MAGI is under $100k (phasing out to $0 by $150k); unused losses carry forward. On sale, claimed depreciation is recaptured at up to 25%, and gains may owe capital-gains tax (a 1031 exchange can defer both). Figures are a year-1 estimate at your 24.0% rate — not tax advice; consult a CPA.
Schools (NCES district)
No district data.
Livability — Violet
- Score
- 59/100
- State rank
- #269
- US rank
- #19722
Category grades
Schools grade is shown separately in the Schools card above.
Census & demographics
- Census place
- Violet, LA
- City population
- 6,784
- Population (ZIP)
- 6,784
Population outlook (St. Bernard County) Hauer SSP2
- Today (2025)
- 66,513 people
- By 2030
- 77,768 · +16.9%
- By 2040
- 101,296 · +52.3%
- By 2050
- 125,770 · +89.1%
- By 2075
- 188,160 · +182.9%
- By 2100
- 239,339 · +259.8%
Race, ethnicity, and origin ACS 2023
- Neighborhood character
- Diverse neighborhood (Simpson 0.60)
- Race & ethnicity
- White 46% Black 43% Hispanic / Latino 9% Two or more races 6% Native American 1%
- Hispanic origin (detail)
- Mexican 1%
- Common ancestry
- Lithuanian 11% Iranian 1% Hispanic 1%
- Foreign-born
- 2% · Canada
- Languages at home
- 97% English-only · Spanish 2%
Political lean MEDSL · St. Bernard
- 2024 margin
- Strong R (+29.3) · D 34.5% · R 63.8% · Other 1.7%
- 2008→2024 swing
- +16.1pp toward D · 2008: -45.4pp · 2024: -29.3pp
- All cycles
- 2024: R+29.3 2020: R+28.5 2016: R+33.4 2012: R+24.7 2008: R+45.4
Not yet ingested
- Civics
- —
Market trends
- HPI YoY
- ▼ -8.36%
- Current HPI
- 218.6728
- Rent YoY
- —
- Metro
- —
- State GDP YoY
- ▲ 3.29%
- F500 in state
- 10
Industry mix (Fortune 500 HQ in LA)
| Industry | F500 HQs | Revenue |
|---|---|---|
| Telecommunications | 2 | $23B |
|
||
| Utilities | 1 | $12B |
|
||
| Wholesale / Distribution | 1 | $5B |
|
||
| Advertising | 1 | $2B |
|
||
Price history
+415.6% since first listed17 events — show timeline
- 2025-10-07 Relisted — GSREIN
- 2025-09-30 Pending — GSREIN
- 2025-08-02 Listed $165,000 GSREIN
- 2025-08-02 Listed $165,000 AcadianaMLS
- 2023-07-11 Price Changed $120,000 GSREIN
- 2023-06-20 Listed $120,000 AcadianaMLS
- 2022-07-06 Sold (Public Records) $75,500 Public Records
- 2022-07-01 Sold (MLS) $75,500 GSREIN
- 2022-06-20 Pending — GSREIN
- 2022-06-15 Price Changed $70,000 GSREIN
- 2022-06-15 Relisted — GSREIN
- 2022-05-17 Listing Removed — GSREIN
- 2022-05-11 Pending — GSREIN
- 2022-05-09 Listed $159,900 GSREIN
- 2022-05-09 Listed $70,000 AcadianaMLS
- 2007-08-06 Sold (Public Records) $25,000 Public Records
- 1994-10-03 Sold (Public Records) $32,000 Public Records
Property tax history
+3.5%/yrLatest (2025): $1,214 · +4.4% YoY. Source: county tax records.
Cash-flow waterfall
monthlySold comps — $/sqft
last 12 mo · ≤1 miLoading sold comps…