216 N Columbia · Almyra, AR
Flood risk 1/10 · Minimal
- FEMA flood zone
- X (unshaded)
- Chance of flooding over 30 yrs
- 0.0%
- Est. flood insurance / yr
- $507 – $1,088
Fire risk 1/10 · Minimal
- Est. fire insurance / yr
- $1,499 – $2,785
Heat risk 5/10 · Moderate
- Hot days now (above 109°F)
- 7 days/yr
- Hot days in 30 yrs
- 19 days/yr
Wind risk 4/10 · Minor
- Chance of severe wind over 30 yrs
- 22.0%
Air-quality risk 1/10 · Minimal
- Unhealthy air days now
- 0 days/yr
- Unhealthy air days in 30 yrs
- 0 days/yr
Risk factors via First Street. Map © Google.
Why this score? — see what drove the C- grade
The composite is a weighted blend of 9 inputs, each scored 0–100. Each bar is that input's sub-score; the figure is the points it added to the 100-point composite (weight × sub-score).
- Cash flow +18.5/30.0
- ARV discount +7.5/15.0
- DSCR +5.8/10.0
- 1% rule +5.0/10.0
- Appreciation +5.0/10.0
- Schools +3.5/10.0
- Livability +2.9/5.0
- Rent growth +2.5/5.0
- Condition / age +2.5/5.0
$119,900
🖨 Deal sheet 📄 Offer letter ✓ Due diligence
Listing remarks
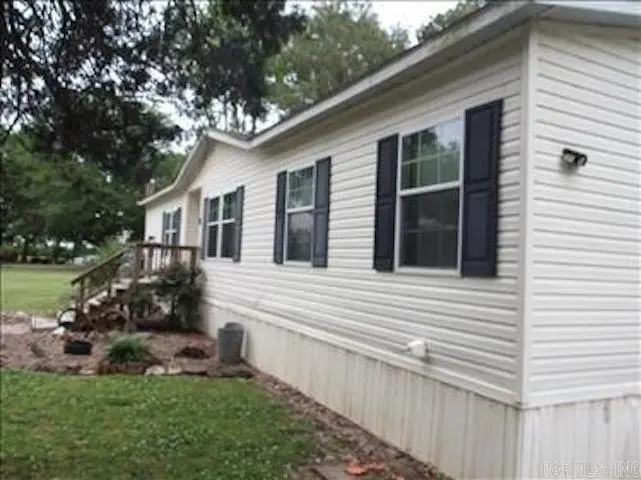
Bank-owned 3BR/2BA mobile home on 0.48 acres with great potential! Spacious lot, functional layout, and plenty of opportunity to customize and add value. Ideal for investors, rental property, or buyers looking for an affordable home with room to improve.
Key facts
- 0.48 acre lot
- Garage
- Built 2010
Property features AI
Finance
- Other: Approximate living area 1,680; Approximate lot size 0.17 (source: tax records); Approximate acreage 0.48 (source: tax records); Annual taxes reported
Exterior
- Parking: Detached parking
- Home design: Metal/vinyl siding exterior
- Construction: Composition roof; Crawl space foundation
- Exterior features: Level lot; Paved road access; Inside city limits
Interior
- Flooring: Carpet; Vinyl
- Bathrooms: 2 full bathrooms
- Heating & cooling: Central electric heat; Central electric cooling
- Interior features: Carpet and vinyl flooring; Central cooling (electric); Central heat (electric)
Neighborhood map
What this means for you Summary
Snapshot
- This is a 3-bed/2.0-bath manufactured listed at $120k.
Deal economics
- At list price, monthly cash flow is $115 ($1k/yr) — positive.
- The deal already cash-flows at list — no discount required.
- To meet the 1% rule (rent ≥ 1% of price), the offer needs to be $119k (0.4% below list).
- Recommended offer: $118k (1.5% below list) — sets the bar for market timing.
Location & tenants
- Location reads 58/100 on livability (#309 in AR) — a working-class tenant base; expect higher turnover. Strengths: cost of living A+, housing A+; Watch: schools F, crime F, amenities F.
- Dewitt School District (rural): math 43% / reading 42% proficiency, ranked #58 of 238 in AR (top 24%) — families likely to look elsewhere, expect single-tenant / working-renter base with shorter leases.
- Market conditions: 3 active listings in the ZIP; 17 units permitted in Arkansas County in 2024 (0 in 5+ unit buildings).
Forward outlook
- In year one you build about $4k of equity ($829 loan paydown + $4k appreciation (3.0% local appreciation)).
- Arkansas County population projected at -19% by 2050 — secular population decline; favor cash flow + early exit over multi-decade hold.
- At projected returns (3.0% appreciation + 3.0% rent growth), your $34k cash investment doubles in ~5 years — after that, you're playing with house money.
- By year 8, paydown + projected appreciation supports a ~$33k cash-out refi (75% LTV) — recoverable capital for the next deal without selling this one.
Negotiation context
- It's been on market 23 days — a 2% lower offer ($118k) is reasonable based on typical stale-listing flexibility.
- Current owner paid $1k; list at $120k implies a 11890% gain — meaningful room to come down on a strong offer.
Risks & watch-outs
- Climate carrying-cost: extreme-heat days projected 7→19/yr by 2055 (HVAC capex compounding) — expect insurance premiums to compound above CPI over the hold.
Questions for the listing agent
- Is there a deadline driving the sale (1031 exchange, divorce, estate, relocation)? That informs how much negotiation room exists.
- Schools are F-rated, which usually means shorter tenancies and higher turnover. Who's the typical renter profile here, and what's been the actual vacancy rate?
- Crime grade is F in this area — have there been break-ins, vandalism, or insurance claims at this property in the last 3 years? What carrier currently insures it and at what premium?
- What's the average days-on-market for RENTAL listings here right now (not sales)? A rising rental-DOM trend means longer vacancies and softer asking-rent achievability than the comps imply.
- What's the recent tenant-quality profile in this submarket — average credit score on applications, eviction rate, late-payment / NSF rate, and stable-employment percentage? A property-management company in the area should have these aggregated.
- How much new for-sale + rental construction is in the pipeline within 1–3 miles? Heavy new supply typically softens prices + rents 12–24 months out; constrained supply supports both.
Investment metrics
- 1% rule
- 1.00% ✗
- Cap rate
- 7.44%
- Cash-on-cash
- 4.11%
- DSCR
- 1.18
- GRM
- 8.4
CMA / ARV
No comps found within radius.
Projected returns pro-forma
3.0% appreciation · 3.0% rent growth · sell at horizon
- IRR
- 11.3%
- Equity multiple
- 1.65×
- Total profit
- $21,786
- Equity at exit
- $53,912
- IRR
- 13.5%
- Equity multiple
- 3.01×
- Total profit
- $67,334
- Equity at exit
- $83,085
Cash invested: $33,572 (down + closing). Projections, not guarantees.
Landlord ↔ Tenant lean methodology
- Overall (STATE)
- 92 Strongly Landlord-Friendly
- State Arkansas
- 92 Strongly Landlord-Friendly · R+14
- County
- — inherits STATE
- City
- — inherits STATE
ZIP-level market 72003
- Active inventory
- 3
- Price-to-rent
- 8.4×
Monthly cashflow live
- Estimated rent
- $1,194 medium interval (Pro) →
- Mortgage (P&I)
- −$629
- Tax est. 1.5%
- −$150 /mo · $1,798/yr
- Insurance
- −$50
- HOA
- −$0
- Vacancy / Maint / Mgmt
- −$251
- Net cashflow
- $115
Break-even live
UW: 25.0% down · 7.5% · 30yr · 1.5% tax · 5.0% vac · 8.0% maint · 8.0% mgmt
Financing live
Cash to close
- Down payment
- $29,975
- Closing costs
- $3,597
- Reserves months
- —
- Total cash needed
- —
Loan-product check · same deal, 3 products live
Conventional
25% down · 7.5% · 30yr
- Down + closing
- —
- Monthly P&I
- —
- Monthly cashflow
- —
- DSCR
- —
- Eligible?
- —
Personal DTI + credit; lowest rate.
DSCR
20% down · 8.5% · 30yr
- Down + closing
- —
- Monthly P&I
- —
- Monthly cashflow
- —
- DSCR
- —
- Eligible?
- —
No personal income docs; deal must DSCR.
Hard money
10% down · 12.0% · 12mo
- Down + closing
- —
- Monthly P&I
- —
- Monthly cashflow
- —
- DSCR
- —
- Eligible?
- —
Short-term bridge; refi at stabilization.
Listing history 19 events
-
2026-06-19days on market $119,900 Active 23 DOM
-
2026-06-18days on market $119,900 Active 22 DOM
-
2026-06-17days on market $119,900 Active 21 DOM
-
2026-06-16days on market $119,900 Active 20 DOM
-
2026-06-15days on market $119,900 Active 19 DOM
-
2026-06-14days on market $119,900 Active 17 DOM
-
2026-06-12days on market $119,900 Active 16 DOM
-
2026-06-09days on market $119,900 Active 13 DOM
-
2026-06-08days on market $119,900 Active 12 DOM
-
2026-06-07days on market $119,900 Active 11 DOM
-
2026-06-05days on market $119,900 Active 9 DOM
-
2026-06-04statusdays on market $119,900 Active 7 DOM
-
2026-06-02days on market $119,900 New Listing 6 DOM
-
2026-06-01days on market $119,900 New Listing 5 DOM
-
2026-05-31days on market $119,900 New Listing 4 DOM
-
2026-05-31days on market $119,900 New Listing 3 DOM
-
2026-05-27$119,900 New Listing
-
1994-05-25soldstatus $1,000
-
1991-11-15soldstatus $40,000
ⓘ Source: listings_history table (triggers on properties + properties_extension) + one-shot
backfill from property_details.listing_events for pre-trigger history.
Climate risk First Street
- Flood 1/10 Low FEMA zone X (unshaded) · 0% chance over 30 yrs
- Wildfire 1/10 Low
- Heat 5/10 Major 7 d/yr ≥109°F today · 19 d/yr by 30 yrs out
- Wind 4/10 Moderate 22% chance of damaging wind over 30 yrs
- Air quality 1/10 Low 0 unhealthy d/yr today · 0 by 30 yrs out
Nearby sold comps map
Loading sold comps map…
Walkable amenities ~0.75 mi
Loading nearby amenities…
Taxation est. · year 1
- Rental income
- $14,333
- − Mortgage interest
- −$6,716
- − Property taxes
- −$1,798
- − Insurance
- −$600
- − Repairs & maintenance
- −$1,147
- − Management
- −$1,147
- − Depreciation
- −$3,488
- Taxable loss
- −$563
- Est. tax savings @ 24.0%
- +$135
- After-tax cash flow
- $1,515/yr
For passive investors: Depreciation is non-cash, so a rental often shows a tax loss while cash-flowing — sheltering income. Rental losses are passive: they offset passive income freely, and up to $25,000/yr can offset ordinary (W-2) income if you actively participate and your MAGI is under $100k (phasing out to $0 by $150k); unused losses carry forward. On sale, claimed depreciation is recaptured at up to 25%, and gains may owe capital-gains tax (a 1031 exchange can defer both). Figures are a year-1 estimate at your 24.0% rate — not tax advice; consult a CPA.
Schools (NCES district)
- District
- Dewitt School District
- NCES district ID
- 0500001
- Math proficiency
- 43% ▼ -11.00%
- Reading proficiency
- 42% ▼ -3.00%
- Median HH income
- $37,526
- Composite
- 35.39/100
- National rank
- #4947
- State rank
- #58 of 238 in AR
Livability — Almyra
- Score
- 58/100
- State rank
- #309
- US rank
- #20693
Category grades
Schools grade is shown separately in the Schools card above.
Census & demographics
- Census place
- Almyra, AR
- Population (ZIP)
- 859
Population outlook (Arkansas County) Hauer SSP2
- Today (2025)
- 17,211 people
- By 2030
- 16,520 · -4.0%
- By 2040
- 15,158 · -11.9%
- By 2050
- 13,916 · -19.1%
- By 2075
- 11,278 · -34.5%
- By 2100
- 8,805 · -48.8%
Race, ethnicity, and origin ACS 2023
- Neighborhood character
- Predominantly White (70%)
- Race & ethnicity
- White 70% Hispanic / Latino 22% Black 6% Two or more races 2%
- Hispanic origin (detail)
- Mexican 7% Puerto Rican 15%
- Common ancestry
- Iranian 1%
Political lean MEDSL · Arkansas
- 2024 margin
- Solid R (+44.1) · D 27.1% · R 71.2% · Other 1.7%
- 2008→2024 swing
- -21.7pp toward R · 2008: -22.4pp · 2024: -44.1pp
- All cycles
- 2024: R+44.1 2020: R+39.5 2016: R+30.6 2012: R+22.2 2008: R+22.4
Not yet ingested
- Civics
- —
Market trends
- HPI YoY
- —
- Current HPI
- —
- Rent YoY
- —
- Metro
- —
- State GDP YoY
- ▲ 3.80%
- F500 in state
- 10
Industry mix (Fortune 500 HQ in AR)
| Industry | F500 HQs | Revenue |
|---|---|---|
| Retail | 1 | $681B |
|
||
| Food / Agriculture | 1 | $53B |
|
||
| Retail / Energy | 1 | $22B |
|
||
| Transportation / Logistics | 1 | $12B |
|
||
| Energy | 1 | $4B |
|
||
Price history
+199.8% since first listed3 events — show timeline
- 2026-05-27 Listed $119,900 CARMLS
- 1994-05-25 Sold (Public Records) $1,000 Public Records
- 1991-11-15 Sold (Public Records) $40,000 Public Records
Property tax history
-33.8%/yrLatest (2025): $1 · -98.8% YoY. Source: county tax records.
Cash-flow waterfall
monthlySold comps — $/sqft
last 12 mo · ≤1 miLoading sold comps…