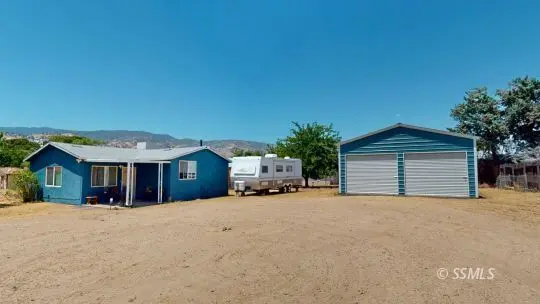
2225 Commercial Ave · Lake Isabella, CA
Flood risk 1/10 · Minimal
- FEMA flood zone
- X (unshaded)
- Chance of flooding over 30 yrs
- 0.0%
- Est. flood insurance / yr
- $507 – $1,088
Fire risk 9/10 · Severe
- Est. fire insurance / yr
- $659 – $1,223
Heat risk 7/10 · Major
- Hot days now (above 93°F)
- 11 days/yr
- Hot days in 30 yrs
- 29 days/yr
Wind risk 1/10 · Minimal
- Chance of severe wind over 30 yrs
- —
Air-quality risk 10/10 · Severe
- Unhealthy air days now
- 24 days/yr
- Unhealthy air days in 30 yrs
- 30 days/yr
Risk factors via First Street. Map © Google.
Why this score? — see what drove the D- grade
The composite is a weighted blend of 9 inputs, each scored 0–100. Each bar is that input's sub-score; the figure is the points it added to the 100-point composite (weight × sub-score).
- Cash flow +13.4/30.0
- Appreciation +7.8/10.0
- DSCR +4.0/10.0
- 1% rule +3.0/10.0
- Schools +2.6/10.0
- Livability +2.6/5.0
- Rent growth +2.5/5.0
- Condition / age +2.5/5.0
- ARV discount +0.5/15.0
$179,995
🖨 Deal sheet 📄 Offer letter ✓ Due diligence
Listing remarks
You don't see properties like this one come on market every day. RARE PROPERTY. This home looks and feels like a NEW home inside and out. Meticulously cared for with readily apparent Seller Pride of Ownership. This 1 Bed 1 Bath 790 Sq Foot home was originally built in 1961.. .you cannot tell, it is THAT nice. Upgrades and Updates galore, a short list which includes Copper Plumbing, new ABS to the Septic, all Stainless Steel Appliances, both the Propane Heater and Evap Cooler are newer and hardly used, upgraded electrical including 50 and 30 amp RV plug-ins, Dual Pane Windows, LVP flooring in ALL the interior rooms, Fully Modernized Kitchen and interior in general, New Roof, New Stucco Paint
Key facts
- Copper plumbing
- Lvp flooring
- Dual pane windows
Tags
Property features AI
Exterior
- Parking: Attached or detached garage with 6 garage spaces
- Utilities: Cable available; Electricity available; Propane service; Septic tank
- Home design: Single-family residence; One story; Site-built home
- Construction: Stucco construction; Composition/shingle roof; Slab foundation; Built as a resale site-built home
- Exterior features: Covered patio; Patio; Fenced yard; Shed(s); RV/boat storage; Has a view; Accessible entrance
Interior
- Kitchen: Dishwasher; Disposal; Microwave; Gas oven; Gas range; Refrigerator
- Flooring: Vinyl flooring
- Bathrooms: 1 full bathroom
- Heating & cooling: Propane heating; Evaporative cooling
- Interior features: Walk-in closet(s); Window coverings
- Laundry & utility: Washer and dryer included; Dryer (gas or electric not specified)
Neighborhood map
What this means for you Summary
Snapshot
- This is a 2-bed/1.0-bath single-family listed at $180k.
Deal economics
- At list price, monthly cash flow is $2 ($29/yr) — positive.
- The deal already cash-flows at list — no discount required.
- To meet the 1% rule (rent ≥ 1% of price), the offer needs to be $143k (20.5% below list).
- Recommended offer: $143k (20.5% below list) — sets the bar for 1% rule.
Location & tenants
- Location reads 52/100 on livability (#999 in CA) — a working-class tenant base; expect higher turnover. Strengths: housing A, cost of living B+; Watch: crime C-, schools F, amenities F.
- Kernville Union Elementary (rural): math 20% / reading 37% proficiency, ranked #1,128 of 1,400 in CA (top 81%) — low school quality limits family demand, transient renter base, plan for 1-2y turnover; 65% free/reduced lunch — lower-income household profile, screen leases tightly.
- Market conditions: 135 active listings in the ZIP; 3,244 units permitted in Kern County in 2024 (73 in 5+ unit buildings).
Forward outlook
- In year one you build about $11k of equity ($1k loan paydown + $10k appreciation (5.5% local appreciation)).
- Kern County population projected at +17% by 2050 — long-run rental-demand tailwind backs the buy-and-hold thesis.
- At projected returns (5.5% appreciation + 3.0% rent growth), your $50k cash investment doubles in ~4 years — after that, you're playing with house money.
- By year 4, paydown + projected appreciation supports a ~$38k cash-out refi (75% LTV) — recoverable capital for the next deal without selling this one.
Negotiation context
- It's been on market 23 days — a 2% lower offer ($177k) is reasonable based on typical stale-listing flexibility.
- Current owner paid $25k; list at $180k implies a 620% gain — meaningful room to come down on a strong offer.
Risks & watch-outs
- Climate carrying-cost: severe wildfire risk; extreme-heat days projected 11→29/yr by 2055 (HVAC capex compounding) — expect insurance premiums to compound above CPI over the hold.
Questions for the listing agent
- Built in 1961 — when were the roof, HVAC, electrical panel, plumbing, and water heater last replaced?
- Is there a deadline driving the sale (1031 exchange, divorce, estate, relocation)? That informs how much negotiation room exists.
- Schools are F-rated, which usually means shorter tenancies and higher turnover. Who's the typical renter profile here, and what's been the actual vacancy rate?
- The area grade is low — what's the realistic commute time and amenity access for the typical tenant pool here? Any planned neighborhood developments (good or bad) we should know about?
- What's the average days-on-market for RENTAL listings here right now (not sales)? A rising rental-DOM trend means longer vacancies and softer asking-rent achievability than the comps imply.
- What's the recent tenant-quality profile in this submarket — average credit score on applications, eviction rate, late-payment / NSF rate, and stable-employment percentage? A property-management company in the area should have these aggregated.
- How much new for-sale + rental construction is in the pipeline within 1–3 miles? Heavy new supply typically softens prices + rents 12–24 months out; constrained supply supports both.
Investment metrics
- 1% rule
- 0.80% ✗
- Cap rate
- 6.31%
- Cash-on-cash
- 0.06%
- DSCR
- 1.00
- GRM
- 10.5
CMA / ARV
- ARV (on-the-fly)
- $155,630
- Comps found
- 1
Show comp detail 1 sale within ~0.75 mi
| Address | Dist | Beds/Ba | Sqft | Sold | Price | $/sf | Match |
|---|---|---|---|---|---|---|---|
| 2217 Young Ave | 0.07mi | 1/1.0 (-1) | 731 (-8%) | 1mo | $144,000 | $197 | 78 |
Match score weights: distance 35% · size 25% · config 20% · recency 20%. Top-matched comps best support the ARV.
Projected returns pro-forma
5.55% appreciation · 3.0% rent growth · sell at horizon
- IRR
- 14.3%
- Equity multiple
- 1.94×
- Total profit
- $47,301
- Equity at exit
- $108,075
- IRR
- 14.8%
- Equity multiple
- 3.78×
- Total profit
- $140,306
- Equity at exit
- $191,751
Cash invested: $50,399 (down + closing). Projections, not guarantees.
Landlord ↔ Tenant lean methodology
- Overall (STATE)
- 18 Strongly Tenant-Friendly
- State California
- 18 Strongly Tenant-Friendly · D+13
- County
- — inherits STATE
- City
- — inherits STATE
ZIP-level market 93240
- Home prices YoY
- 1.6%
- Active inventory
- 135
- Price-to-rent
- 10.5×
Monthly cashflow live
- Estimated rent
- $1,431 medium interval (Pro) →
- Mortgage (P&I)
- −$944
- Tax from tax record
- −$109 /mo · $1,310/yr
- Insurance
- −$75
- HOA
- −$0
- Vacancy / Maint / Mgmt
- −$301
- Net cashflow
- $2
Break-even live
UW: 25.0% down · 7.5% · 30yr · 1.5% tax · 5.0% vac · 8.0% maint · 8.0% mgmt
Financing live
Cash to close
- Down payment
- $44,999
- Closing costs
- $5,400
- Reserves months
- —
- Total cash needed
- —
Loan-product check · same deal, 3 products live
Conventional
25% down · 7.5% · 30yr
- Down + closing
- —
- Monthly P&I
- —
- Monthly cashflow
- —
- DSCR
- —
- Eligible?
- —
Personal DTI + credit; lowest rate.
DSCR
20% down · 8.5% · 30yr
- Down + closing
- —
- Monthly P&I
- —
- Monthly cashflow
- —
- DSCR
- —
- Eligible?
- —
No personal income docs; deal must DSCR.
Hard money
10% down · 12.0% · 12mo
- Down + closing
- —
- Monthly P&I
- —
- Monthly cashflow
- —
- DSCR
- —
- Eligible?
- —
Short-term bridge; refi at stabilization.
Listing history 17 events
-
2026-06-18days on market $179,995 Active 23 DOM
-
2026-06-17days on market $179,995 Active 22 DOM
-
2026-06-16days on market $179,995 Active 21 DOM
-
2026-06-15days on market $179,995 Active 20 DOM
-
2026-06-14days on market $179,995 Active 18 DOM
-
2026-06-13days on market $179,995 Active 17 DOM
-
2026-06-10days on market $179,995 Active 15 DOM
-
2026-06-09days on market $179,995 Active 14 DOM
-
2026-06-08days on market $179,995 Active 13 DOM
-
2026-06-07days on market $179,995 Active 12 DOM
-
2026-06-05days on market $179,995 Active 9 DOM
-
2026-06-03days on market $179,995 Active 8 DOM
-
2026-06-03days on market $179,995 Active 7 DOM
-
2026-06-01days on market $179,995 Active 6 DOM
-
2026-05-31days on market $179,995 Active 5 DOM
-
2026-05-27$174,900 Active
-
1994-06-17soldstatus $25,000
ⓘ Source: listings_history table (triggers on properties + properties_extension) + one-shot
backfill from property_details.listing_events for pre-trigger history.
Tax reassessment forecast CA · Resets to sale price
- Current annual tax
- $1,310 · $109/mo
- Projected year-2 tax
- $1,368 · $114/mo
- Expected delta
- +$58/yr (+$5/mo · 4.4%)
ⓘ Screening estimate from a state-policy table — verify with the county assessor before closing.
Climate risk First Street
- Flood 1/10 Low FEMA zone X (unshaded) · 0% chance over 30 yrs
- Wildfire 9/10 Extreme
- Heat 7/10 Severe 11 d/yr ≥93°F today · 29 d/yr by 30 yrs out
- Wind 1/10 Low
- Air quality 10/10 Extreme 24 unhealthy d/yr today · 30 by 30 yrs out
Nearby sold comps map
Loading sold comps map…
Walkable amenities ~0.75 mi
Loading nearby amenities…
Taxation est. · year 1
- Rental income
- $17,172
- − Mortgage interest
- −$10,083
- − Property taxes
- −$1,310
- − Insurance
- −$900
- − Repairs & maintenance
- −$1,374
- − Management
- −$1,374
- − Depreciation
- −$5,236
- Taxable loss
- −$3,104
- Est. tax savings @ 24.0%
- +$745
- After-tax cash flow
- $774/yr
For passive investors: Depreciation is non-cash, so a rental often shows a tax loss while cash-flowing — sheltering income. Rental losses are passive: they offset passive income freely, and up to $25,000/yr can offset ordinary (W-2) income if you actively participate and your MAGI is under $100k (phasing out to $0 by $150k); unused losses carry forward. On sale, claimed depreciation is recaptured at up to 25%, and gains may owe capital-gains tax (a 1031 exchange can defer both). Figures are a year-1 estimate at your 24.0% rate — not tax advice; consult a CPA.
Schools (NCES district)
- District
- Kernville Union Elementary
- NCES district ID
- 0619590
- Math proficiency
- 20% ▲ 4.00%
- Reading proficiency
- 37% ▲ 11.00%
- Median HH income
- $29,896
- Composite
- 25.91/100
- National rank
- #12766
- State rank
- #1128 of 1400 in CA
Livability — Lake Isabella
- Score
- 52/100
- State rank
- #999
- US rank
- #24814
Category grades
Schools grade is shown separately in the Schools card above.
Census & demographics
- Census place
- Lake Isabella, CA
- City population
- 5,622
- Population (ZIP)
- 5,622
Population outlook (Kern County) Hauer SSP2
- Today (2025)
- 947,286 people
- By 2030
- 978,984 · +3.3%
- By 2040
- 1,045,018 · +10.3%
- By 2050
- 1,105,232 · +16.7%
- By 2075
- 1,229,538 · +29.8%
- By 2100
- 1,238,059 · +30.7%
Race, ethnicity, and origin ACS 2023
- Neighborhood character
- Predominantly White (78%)
- Race & ethnicity
- White 78% Hispanic / Latino 13% Two or more races 5% Asian 2% Native American 1%
- Hispanic origin (detail)
- Mexican 11%
- Common ancestry
- Italian 3% Portuguese 2% Iranian 2%
- Foreign-born
- 5% · Canada, South Korea
- Languages at home
- 93% English-only · Spanish 4% Korean 1% Other Asian/Pacific 1%
Political lean MEDSL · Kern
- 2024 margin
- Strong R (+21.1) · D 38.2% · R 59.3% · Other 2.5%
- 2008→2024 swing
- -3.3pp toward R · 2008: -17.8pp · 2024: -21.1pp
- All cycles
- 2024: R+21.1 2020: R+10.2 2016: R+15.0 2012: R+20.9 2008: R+17.8
Not yet ingested
- Civics
- —
Market trends
- HPI YoY
- ▲ 5.55%
- Current HPI
- 341.2481
- Rent YoY
- —
- Metro
- —
- State GDP YoY
- ▲ 3.21%
- F500 in state
- 116
Industry mix (Fortune 500 HQ in CA)
| Industry | F500 HQs | Revenue |
|---|---|---|
| Technology | 27 | $1,492B |
|
||
| Financial Services | 3 | $174B |
|
||
| Retail | 3 | $44B |
|
||
| Insurance | 3 | $26B |
|
||
| Media / Entertainment | 2 | $115B |
|
||
| Pharmaceuticals / Biotech | 2 | $62B |
|
||
Price history
+599.6% since first listed2 events — show timeline
- 2026-05-27 Listed $174,900 SSMLS
- 1994-06-17 Sold (Public Records) $25,000 Public Records
Property tax history
+9.5%/yrLatest (2025): $1,310 · +2.7% YoY. Source: county tax records.
Cash-flow waterfall
monthlySold comps — $/sqft
last 12 mo · ≤1 miLoading sold comps…