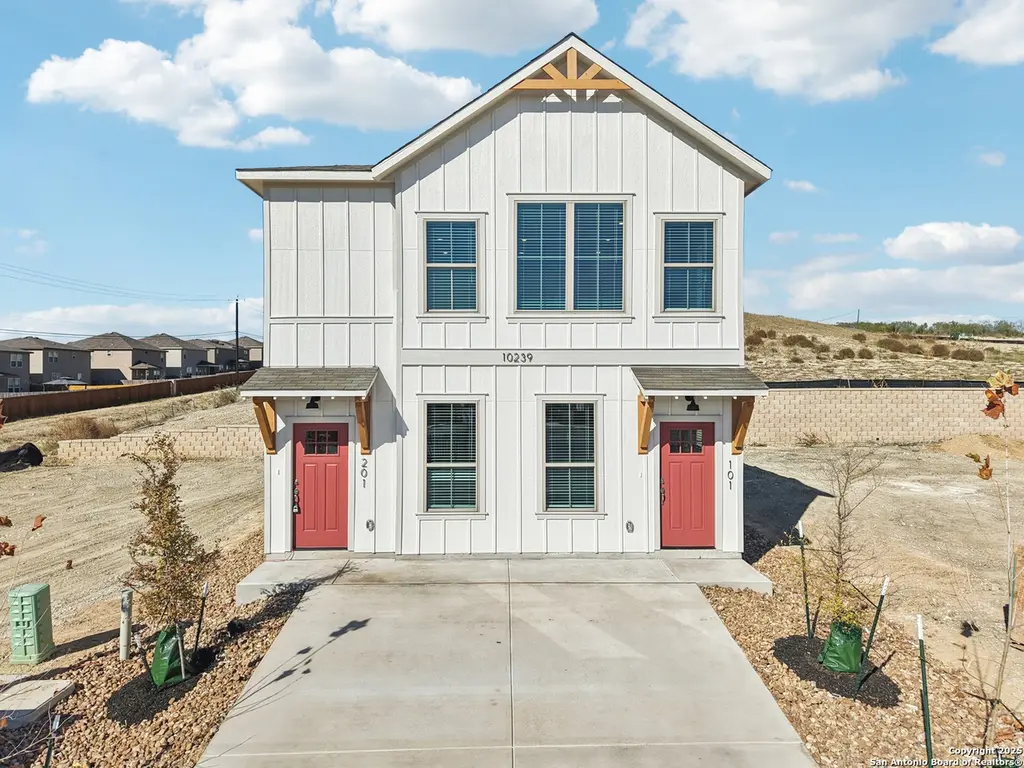
 Duplex
7150 Magnolia Crk · San Antonio, TX
Flood risk No data
- FEMA flood zone
- —
- Chance of flooding over 30 yrs
- —
- Est. flood insurance / yr
- —
Fire risk No data
- Est. fire insurance / yr
- —
Heat risk No data
- Hot days now (above threshold)
- —
- Hot days in 30 yrs
- —
Wind risk No data
- Chance of severe wind over 30 yrs
- —
Air-quality risk No data
- Unhealthy air days now
- —
- Unhealthy air days in 30 yrs
- —
Risk factors via First Street. Map © Google.
Why this score? — see what drove the C- grade
The composite is a weighted blend of 9 inputs, each scored 0–100. Each bar is that input's sub-score; the figure is the points it added to the 100-point composite (weight × sub-score).
- ARV discount +15.0/15.0
- Cash flow +11.6/30.0
- Appreciation +5.0/10.0
- Condition / age +5.0/5.0
- Livability +4.0/5.0
- 1% rule +3.6/10.0
- DSCR +3.4/10.0
- Schools +2.2/10.0
- Rent growth +2.1/5.0
$405,990
🖨 Deal sheet 📄 Offer letter ✓ Due diligence
Multi-family units
County records classify this as Multi-Family (2-4 Unit). Listing-text estimate: 2 units. confirmed
Listing remarks MLS
BRAND NEW 2026 DUPLEXES. GATED COMMUNITY. SPECIAL OFFER: ~3.75% interest rate for qualified borrowers ~0% down for VA, 3.5% down for FHA. Live in one unit and rent the other, removing the majority of your mortgage payment while building equity in an Airbnb friendly community! Or rent out both sides for cash flow! Two units per building. Each duplex has either 3 bedrooms/2 baths or 2 bedrooms/2 baths, making this a great investment / house hacking opportunity. A property management company can manage your tenant(s) for 7.5% of rents. Monthly rent of between $1,375 and $1,450 per unit is suggested but not guaranteed. A 1-2-10 warranty included. *Magnolia Village North* is an upscale gated duplex community with two private parks. Included in the HOA fee is front lawn mowing. Never worry about your neighbors failing to maintain their front yards again! Each duplex includes premium vinyl plank floors, stainless steel appliances and much more. Magnolia Village is located just off 1604 West near 90 West, making it a great place to find renters. The area is currently a hot spot for growth, driven to a large extent by the number of major employers within a twenty-minute drive including Joint Base Lackland, USAA, Citibank, American Funds, Valero, UTSA, Six Flags, Marathon Petroleum, Microsoft, and a concentration of data centers nearby Highway 151.
Key facts
- Gated community
- Private parks
- 2 parking spots
Tags
Neighborhood map
What this means for you Summary
Snapshot
- This is a 2 × 3-bed/2.0-bath units multifamily listed at $406k. Condition is rated excellent.
Deal economics
- At list price, monthly cash flow is $-124 ($-1k/yr) — negative. Per door: $-62/mo.
- To cash-flow at today's rent, offer at most $388k (4.4% below list).
- To meet the 1% rule (rent ≥ 1% of price), the offer needs to be $350k (13.8% below list).
- Recommended offer: $350k (13.8% below list) — sets the bar for 1% rule.
- Cap rate 5.9% vs local median 3.8% in San Antonio — top-decile yield for the area; either an underpriced asset or a hidden risk that comps aren't pricing in. Stress-test before assuming the spread holds.
Location & tenants
- Location reads 80/100 on livability (#31 in TX, #1,616 nationally) — a professional / high-income tenant draw. Strengths: amenities A+, commute A+, cost of living A+; Watch: schools C-, crime F.
- Southwest ISD (rural): math 21% / reading 31% proficiency, ranked #701 of 826 in TX (top 85%) — low school quality limits family demand, transient renter base, plan for 1-2y turnover; 75% free/reduced lunch — lower-income household profile, screen leases tightly.
- Market conditions: Rents soft (-1.7%/yr); 537 active listings in the ZIP; solid renter incomes; 8,308 units permitted in Bexar County in 2024 (2,506 in 5+ unit buildings).
- At $3,499/mo this rent would consume 49% of the median local household income ($86k/yr) (locally 152% of renters already pay >50% of income on rent) — very limited rent-growth headroom before tenants either downsize or default.
Forward outlook
- In year one you build about $3k of equity ($3k loan paydown + $-7 appreciation (-0.0% local appreciation)).
- Bexar County population projected at +50% by 2050 — long-run rental-demand tailwind backs the buy-and-hold thesis.
- By year 9, paydown + projected appreciation supports a ~$35k cash-out refi (75% LTV) — recoverable capital for the next deal without selling this one.
Negotiation context
- It's been on market 93 days — a 9% lower offer ($369k) is reasonable based on typical stale-listing flexibility.
Questions for the listing agent
- What do current leases actually rent for vs. the listed asking? Can we see a recent rent roll and the last 12 months of T-12 income?
- It's been on market 93 days. Have you received any prior offers? Is the seller open to a 14% concession, seller financing, or rate buy-down credit?
- Can we see the unit-by-unit rent roll, current vacancy, and any below-market leases? What's the average tenancy length?
- What capital expenditures (roof, boiler, parking lot, exteriors) have been made in the last 5 years, and what's planned in the next 2?
- What does the HOA fee cover, when was the last increase, and are there any pending special assessments or reserve-fund shortfalls?
- Why hasn't it sold? Are there any deal-killer items the seller is aware of (foundation, flood, title, zoning, code violations)?
- Is there a deadline driving the sale (1031 exchange, divorce, estate, relocation)? That informs how much negotiation room exists.
- Crime grade is F in this area — have there been break-ins, vandalism, or insurance claims at this property in the last 3 years? What carrier currently insures it and at what premium?
- What's the average days-on-market for RENTAL listings here right now (not sales)? A rising rental-DOM trend means longer vacancies and softer asking-rent achievability than the comps imply.
- What's the recent tenant-quality profile in this submarket — average credit score on applications, eviction rate, late-payment / NSF rate, and stable-employment percentage? A property-management company in the area should have these aggregated.
- How much new apartment / multifamily construction is in the pipeline within 1–3 miles? Heavy new supply (>2% of stock underway) typically softens rents 12–24 months out; light construction supports rent growth.
Investment metrics
- 1% rule
- 0.86% ✗
- Cap rate
- 5.92%
- Cash-on-cash
- -1.31%
- DSCR
- 0.94
- GRM
- 9.7
CMA / ARV
- ARV (median comp)
- $491,013
- List price
- $405,990
- Delta
- -17.32%
- Verdict
- UNDERPRICED
- Comps
- 20 within 1.0 mi
Projected returns pro-forma
-0.0% appreciation · 0.0% rent growth · sell at horizon
- IRR
- -5.7%
- Equity multiple
- 0.74×
- Total profit
- $-29,990
- Equity at exit
- $117,850
- IRR
- -2.0%
- Equity multiple
- 0.80×
- Total profit
- $-22,309
- Equity at exit
- $141,633
Cash invested: $113,677 (down + closing). Projections, not guarantees.
Landlord ↔ Tenant lean methodology
- Overall (STATE)
- 87 Strongly Landlord-Friendly
- State Texas
- 87 Strongly Landlord-Friendly · R+5
- County
- — inherits STATE
- City
- — inherits STATE
ZIP-level market 78252
- Home prices YoY
- -0.0%
- Rents YoY
- -1.7%
- Active inventory
- 537
- Price-to-rent
- 19.3×
Monthly cashflow live
- Estimated rent
- $3,499 high interval (Pro) →
- Mortgage (P&I)
- −$2,129
- Tax est. 1.5%
- −$507 /mo · $6,090/yr
- Insurance
- −$169
- HOA
- −$83
- Vacancy / Maint / Mgmt
- −$735
- Net cashflow
- $-124
Break-even live
2-unit breakdown (identical units grouped — click to expand)
| Units | Beds | Baths | Est. rent |
|---|---|---|---|
| 2× units | 3 | 2 | $3,500 |
| #1 | 3 | 2 | $1,750 |
| #2 | 3 | 2 | $1,750 |
| Total (2 units) | $3,499 | ||
UW: 25.0% down · 7.5% · 30yr · 1.5% tax · 5.0% vac · 8.0% maint · 8.0% mgmt
Financing live
Cash to close
- Down payment
- $101,498
- Closing costs
- $12,180
- Reserves months
- —
- Total cash needed
- —
Loan-product check · same deal, 3 products live
Conventional
25% down · 7.5% · 30yr
- Down + closing
- —
- Monthly P&I
- —
- Monthly cashflow
- —
- DSCR
- —
- Eligible?
- —
Personal DTI + credit; lowest rate.
DSCR
20% down · 8.5% · 30yr
- Down + closing
- —
- Monthly P&I
- —
- Monthly cashflow
- —
- DSCR
- —
- Eligible?
- —
No personal income docs; deal must DSCR.
Hard money
10% down · 12.0% · 12mo
- Down + closing
- —
- Monthly P&I
- —
- Monthly cashflow
- —
- DSCR
- —
- Eligible?
- —
Short-term bridge; refi at stabilization.
HOA detail
- Monthly dues
- $83 · $996/yr
- Likely covers
- security
Listing history 9 events
-
2026-06-09days on market $405,990 Active 93 DOM
-
2026-06-08days on market $405,990 Active 92 DOM
-
2026-06-07days on market $405,990 Active 91 DOM
-
2026-06-04days on market $405,990 Active 88 DOM
-
2026-06-03days on market $405,990 Active 87 DOM
-
2026-06-02days on market $405,990 Active 86 DOM
-
2026-06-01days on market $405,990 Active 85 DOM
-
2026-05-31days on market $405,990 Active 84 DOM
-
2026-03-09$405,990 New 1360-char remark
Show marketing remark (1360 chars)
BRAND NEW 2026 DUPLEXES. GATED COMMUNITY. SPECIAL OFFER: ~3.75% interest rate for qualified borrowers ~0% down for VA, 3.5% down for FHA. Live in one unit and rent the other, removing the majority of your mortgage payment while building equity in an Airbnb friendly community! Or rent out both sides for cash flow! Two units per building. Each duplex has either 3 bedrooms/2 baths or 2 bedrooms/2 baths, making this a great investment / house hacking opportunity. A property management company can manage your tenant(s) for 7.5% of rents. Monthly rent of between $1,375 and $1,450 per unit is suggested but not guaranteed. A 1-2-10 warranty included. *Magnolia Village North* is an upscale gated duplex community with two private parks. Included in the HOA fee is front lawn mowing. Never worry about your neighbors failing to maintain their front yards again! Each duplex includes premium vinyl plank floors, stainless steel appliances and much more. Magnolia Village is located just off 1604 West near 90 West, making it a great place to find renters. The area is currently a hot spot for growth, driven to a large extent by the number of major employers within a twenty-minute drive including Joint Base Lackland, USAA, Citibank, American Funds, Valero, UTSA, Six Flags, Marathon Petroleum, Microsoft, and a concentration of data centers nearby Highway 151.
ⓘ Source: listings_history table (triggers on properties + properties_extension) + one-shot
backfill from property_details.listing_events for pre-trigger history.
Nearby sold comps map
Loading sold comps map…
Walkable amenities ~0.75 mi
Loading nearby amenities…
Taxation est. · year 1
- Rental income
- $41,988
- − Mortgage interest
- −$22,742
- − Property taxes
- −$6,090
- − Insurance
- −$2,030
- − Repairs & maintenance
- −$3,359
- − Management
- −$3,359
- − HOA
- −$996
- − Depreciation
- −$11,811
- Taxable loss
- −$8,398
- Est. tax savings @ 24.0%
- +$2,016
- After-tax cash flow
- $522/yr
For passive investors: Depreciation is non-cash, so a rental often shows a tax loss while cash-flowing — sheltering income. Rental losses are passive: they offset passive income freely, and up to $25,000/yr can offset ordinary (W-2) income if you actively participate and your MAGI is under $100k (phasing out to $0 by $150k); unused losses carry forward. On sale, claimed depreciation is recaptured at up to 25%, and gains may owe capital-gains tax (a 1031 exchange can defer both). Figures are a year-1 estimate at your 24.0% rate — not tax advice; consult a CPA.
Condition & rehab AI · 13 photos
This newly constructed 2026 duplex is in excellent condition with modern finishes and a good curb appeal. Minor landscaping and interior painting would further enhance its value.
Value-add opportunities
- Both Landscaping and curb appeal improvements — Enhanced landscaping can improve both the resale and rental value of the property.
- Both Painting interior walls — Fresh paint can make the interior look more inviting and increase both resale and rental value.
Renovation cost estimate screening
Value-add ROI direction
- Both Landscaping and curb appeal improvements — Enhanced landscaping can improve both the resale and rental value of the property. ↑
- Both Painting interior walls — Fresh paint can make the interior look more inviting and increase both resale and rental value. ↑
ⓘ Cost ranges are severity-bucket heuristics (US national rule-of-thumb). Get contractor quotes + a written scope before underwriting a rehab budget.
Schools (NCES district)
- District
- Southwest ISD
- NCES district ID
- 4840950
- Math proficiency
- 21% ▼ -21.00%
- Reading proficiency
- 31% ▼ -5.00%
- Median HH income
- $43,362
- Composite
- 22.22/100
- National rank
- #8153
- State rank
- #701 of 826 in TX
Livability — San Antonio
- Score
- 80/100
- State rank
- #31
- US rank
- #1616
Category grades
Schools grade is shown separately in the Schools card above.
Census & demographics
- County
- Bexar County · 1,990,555 people
- City population
- 1,806,925
- Metro
- San Antonio-New Braunfels, TX
- Population (ZIP)
- 21,790
- Household income
- $85,518
- Rent vs Own
- Severe rent burden
- 152.0
Population outlook (Bexar County) Hauer SSP2
- Today (2025)
- 2,336,851 people
- By 2030
- 2,560,728 · +9.6%
- By 2040
- 3,020,569 · +29.3%
- By 2050
- 3,493,522 · +49.5%
- By 2075
- 4,668,459 · +99.8%
- By 2100
- 5,533,242 · +136.8%
Race, ethnicity, and origin ACS 2023
- Neighborhood character
- Predominantly Hispanic (68%)
- Race & ethnicity
- Hispanic / Latino 68% Two or more races 29% White 17% Black 8% Asian 3% Native American 1%
- Hispanic origin (detail)
- Mexican 61% Puerto Rican 1%
- Common ancestry
- Hispanic 2% Lithuanian 1% German 1%
- Foreign-born
- 12% · Canada, South Korea
- Languages at home
- 58% English-only · Spanish 38% Tagalog/Filipino 2% Other Indo-European 1%
Political lean MEDSL · Bexar
- 2024 margin
- Lean D (+9.8) · D 54.3% · R 44.6% · Other 1.1%
- 2008→2024 swing
- +4.2pp toward D · 2008: 5.6pp · 2024: 9.8pp
- All cycles
- 2024: D+9.8 2020: D+18.2 2016: D+13.5 2012: D+4.6 2008: D+5.6
Not yet ingested
- Civics
- —
Market trends
- HPI YoY
- ▬ -0.00%
- Current HPI
- 183.6413
- Rent YoY
- ▼ -1.67%
- Metro
- San Antonio-New Braunfels, TX
- State GDP YoY
- ▲ 3.95%
- F500 in state
- 110
Industry mix (Fortune 500 HQ in TX)
| Industry | F500 HQs | Revenue |
|---|---|---|
| Energy | 16 | $1,198B |
|
||
| Technology | 5 | $198B |
|
||
| Engineering / Construction | 4 | $72B |
|
||
| Energy Services | 3 | $60B |
|
||
| Utilities | 3 | $41B |
|
||
| Healthcare | 2 | $330B |
|
||
Price history
1 event — show timeline
- 2026-03-09 Listed $405,990 LERA
Cash-flow waterfall
monthlySold comps — $/sqft
last 12 mo · ≤1 miLoading sold comps…