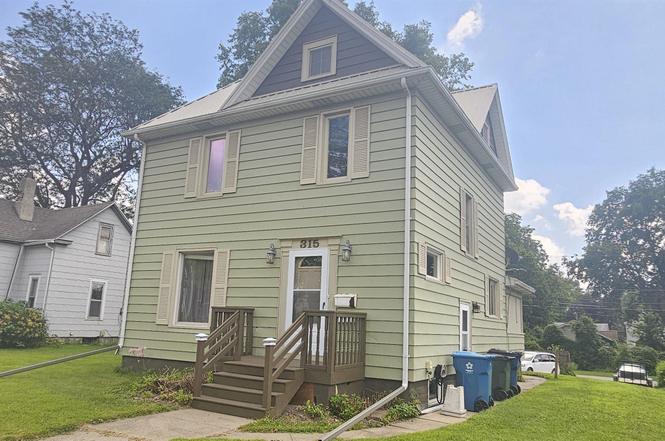
315 Leland Ave · Waterloo, IA
Flood risk 1/10 · Minimal
- FEMA flood zone
- X (unshaded)
- Chance of flooding over 30 yrs
- 0.0%
- Est. flood insurance / yr
- $473 – $860
Fire risk 1/10 · Minimal
- Est. fire insurance / yr
- $902 – $1,676
Heat risk 3/10 · Minor
- Hot days now (above 101°F)
- 7 days/yr
- Hot days in 30 yrs
- 16 days/yr
Wind risk 2/10 · Minimal
- Chance of severe wind over 30 yrs
- —
Air-quality risk 1/10 · Minimal
- Unhealthy air days now
- 0 days/yr
- Unhealthy air days in 30 yrs
- 0 days/yr
Risk factors via First Street. Map © Google.
Why this score? — see what drove the B- grade
The composite is a weighted blend of 9 inputs, each scored 0–100. Each bar is that input's sub-score; the figure is the points it added to the 100-point composite (weight × sub-score).
- Cash flow +28.9/30.0
- DSCR +10.0/10.0
- ARV discount +7.5/15.0
- 1% rule +7.4/10.0
- Schools +4.4/10.0
- Livability +4.0/5.0
- Rent growth +3.2/5.0
- Condition / age +2.5/5.0
- Appreciation +0.0/10.0
$89,900
🖨 Deal sheet (PDF) 📄 Offer letter ✓ Due diligence
Listing remarks
This is a great more for your money home that's ready for you to move in located next to all the main thorough fares 3 large bedrooms with 1.5 baths formal dining and family room and huge bathroom call your agent today for a showing before its too late
Key facts
- 8,400 sq ft lot
- 2 parking spots
- Built 1906
Property features AI
Exterior
- Parking: Carport with 2 spaces
- Security: Smoke detector(s)
- Utilities: Public water; Public sewer
- Home design: Residential single-family home; R-1 zoning
- Construction: Aluminum siding; Metal roof
- Exterior features: Privacy fencing; Gravel and paved driveway/road access
Interior
- Kitchen: Refrigerator
- Bathrooms: 1 full bathroom; 1 half bathroom
- Heating & cooling: Forced air heating (natural gas); Ceiling fan(s)
- Interior features: Eat-in kitchen; Block, unfinished basement
- Laundry & utility: Washer (located on lower level); Gas water heater
Neighborhood map
What this means for you Summary
Snapshot
- This is a 3-bed/2.5-bath single-family listed at $90k.
Deal economics
- At list price, monthly cash flow is $304 ($4k/yr) — positive.
- The deal already cash-flows at list — no discount required.
- Meets the 1% rule at list price ($1k rent vs $90k).
- Recommended offer: $79k (12.0% below list) — sets the bar for market timing.
- Cap rate 10.4% vs local median 4.2% in Waterloo — top-decile yield for the area; either an underpriced asset or a hidden risk that comps aren't pricing in. Stress-test before assuming the spread holds.
Location & tenants
- Location reads 81/100 on livability (#74 in IA, #1,589 nationally) — a professional / high-income tenant draw. Strengths: commute A+, cost of living A+, housing A+; Watch: crime F, employment D-.
- Waterloo Community School District (urban): math 50% / reading 54% proficiency, ranked #276 of 289 in IA (top 96%) — acceptable for families but not a draw, mixed tenant base, ~2y average lease.
- Zoned schools: Irving Elementary School (math 43% / reading 44%, grade F, #560 of 616 statewide, top 91%, 402 students, 92% FRL); Central Middle School (math 49% / reading 46%, grade C-, #226 of 246 statewide, top 92%, 471 students, 85% FRL); East High School (math 39% / reading 58%, grade D, #317 of 336 statewide, top 94%, 1,022 students, 73% FRL) — zoned schools average 83% FRL vs 58% district-wide (25 pts higher); higher-poverty schools than district average — tighter screening recommended.
- Market conditions: Rents rising (+2.7%/yr); 126 active listings in the ZIP; 24 comparable units currently listed for rent nearby; rentals lingering (median 46d on market — plan ~5-8 weeks vacancy on turnover, expect pricing pressure); 54% of comp listings sitting > 30 days — soft ceiling on asking rent; 287 units permitted in Black Hawk County in 2024 (67 in 5+ unit buildings).
Forward outlook
- Local home prices are declining (-3.0%/yr); year-one equity from $622 of loan paydown is wiped out by about $3k of value loss. Plan a longer hold.
- Black Hawk County population projected at +10% by 2050 — modest demand growth; plan on rents tracking national, not racing it.
- At projected returns (-3.0% appreciation + 2.7% rent growth), your $25k cash investment doubles in ~9 years — after that, you're playing with house money.
Negotiation context
- It's been on market 248 days — a 12% lower offer ($79k) is reasonable based on typical stale-listing flexibility.
- 2 sale attempts; this cycle's ask has dropped $20k (18%) from the opening price — seller is motivated, your offer sets the floor, not the list.
Risks & watch-outs
- Watch-outs: built in 1906 — expect roof / HVAC / electrical / plumbing capex.
Questions for the listing agent
- It's been on market 248 days. Have you received any prior offers? Is the seller open to a 12% concession, seller financing, or rate buy-down credit?
- Built in 1906 — when were the roof, HVAC, electrical panel, plumbing, and water heater last replaced?
- Why hasn't it sold? Are there any deal-killer items the seller is aware of (foundation, flood, title, zoning, code violations)?
- Is there a deadline driving the sale (1031 exchange, divorce, estate, relocation)? That informs how much negotiation room exists.
- Crime grade is F in this area — have there been break-ins, vandalism, or insurance claims at this property in the last 3 years? What carrier currently insures it and at what premium?
- What's the average days-on-market for RENTAL listings here right now (not sales)? A rising rental-DOM trend means longer vacancies and softer asking-rent achievability than the comps imply.
- What's the recent tenant-quality profile in this submarket — average credit score on applications, eviction rate, late-payment / NSF rate, and stable-employment percentage? A property-management company in the area should have these aggregated.
- How much new for-sale + rental construction is in the pipeline within 1–3 miles? Heavy new supply typically softens prices + rents 12–24 months out; constrained supply supports both.
Investment metrics
- 1% rule
- 1.24% ✓
- Cap rate
- 10.35%
- Cash-on-cash
- 14.50%
- DSCR
- 1.65
- GRM
- 6.7
CMA / ARV
- ARV (on-the-fly)
- $52,416
- Comps found
- 12
Show comp detail 12 sales within ~0.75 mi
| Address | Dist | Beds/Ba | Sqft | Sold | Price | $/sf | Match |
|---|---|---|---|---|---|---|---|
| 315 Leland Ave | 0.00mi | 3/1.5 | 1,488 (-9%) | 1mo | $85,000 | $57 | 80 |
| 1018 W 2nd St | 0.36mi | 3/1.5 | 1,616 (-1%) | 7mo | $51,069 | $32 | 71 |
| 1116 W Mullan Ave | 0.21mi | 3/1.0 | 1,518 (-7%) | 2mo | $35,000 | $23 | 70 |
| 403 Belmont Ave | 0.15mi | 3/1.5 | 1,462 (-11%) | 3mo | $104,000 | $71 | 68 |
| 928 W 2nd St | 0.33mi | 4/2.0 (+1) | 1,568 (-4%) | 4mo | $20,000 | $13 | 67 |
| 726 W 2nd St | 0.29mi | 3/1.0 | 1,716 (+5%) | 7mo | $47,000 | $27 | 66 |
| 1115 W 2nd St | 0.42mi | 4/1.5 (+1) | 1,619 (-1%) | 7mo | $100,000 | $62 | 64 |
| 426 Baltimore St | 0.55mi | 2/1.5 (-1) | 1,568 (-4%) | 4mo | $50,000 | $32 | 55 |
| 207 Denver St | 0.40mi | 2/1.5 (-1) | 1,420 (-13%) | 1mo | $92,500 | $65 | 49 |
| 1318 W 2nd St | 0.50mi | 4/2.0 (+1) | 1,804 (+10%) | 6mo | $53,000 | $29 | 48 |
| 524 Vermont St | 0.72mi | 4/1.5 (+1) | 1,477 (-10%) | 0mo | $72,000 | $49 | 41 |
| 418 Bayard St | 0.67mi | 3/1.0 | 1,456 (-11%) | 5mo | $35,000 | $24 | 40 |
Match score weights: distance 35% · size 25% · config 20% · recency 20%. Top-matched comps best support the ARV.
Projected returns pro-forma
-3.0% appreciation · 2.7% rent growth · sell at horizon
- IRR
- 4.6%
- Equity multiple
- 1.18×
- Total profit
- $4,458
- Equity at exit
- $13,404
- IRR
- 13.8%
- Equity multiple
- 2.09×
- Total profit
- $27,414
- Equity at exit
- $7,773
Cash invested: $25,172 (down + closing). Projections, not guarantees.
Landlord ↔ Tenant lean methodology
- Overall (STATE)
- 83 Strongly Landlord-Friendly
- State Iowa
- 83 Strongly Landlord-Friendly · R+6
- County
- — inherits STATE
- City
- — inherits STATE
ZIP-level market 50702
- Rents YoY
- 2.7%
- Active inventory
- 126
- Price-to-rent
- 6.7×
Monthly cashflow live
- Estimated rent
- $1,113 high interval (Pro) →
- Mortgage (P&I)
- −$471
- Tax from tax record
- −$66 /mo · $796/yr
- Insurance
- −$37
- HOA
- −$0
- Vacancy / Maint / Mgmt
- −$234
- Net cashflow
- $304
Break-even live
Sensitivity live
| Price | -10% $355 | -5% $330 | +0% $304 | +5% $279 | +10% $253 |
|---|---|---|---|---|---|
| Rent | -10% $216 | -5% $260 | +0% $304 | +5% $348 | +10% $392 |
| Rate | -1.0pp $349 | -0.5pp $327 | base $304 | +0.5pp $281 | +1.0pp $257 |
UW: 25.0% down · 7.5% · 30yr · 1.5% tax · 5.0% vac · 8.0% maint · 8.0% mgmt
Financing live
Cash to close
- Down payment
- $22,475
- Closing costs
- $2,697
- Reserves months
- —
- Total cash needed
- —
Loan-product check · same deal, 3 products live
Conventional
25% down · 7.5% · 30yr
- Down + closing
- —
- Monthly P&I
- —
- Monthly cashflow
- —
- DSCR
- —
- Eligible?
- —
Personal DTI + credit; lowest rate.
DSCR
20% down · 8.5% · 30yr
- Down + closing
- —
- Monthly P&I
- —
- Monthly cashflow
- —
- DSCR
- —
- Eligible?
- —
No personal income docs; deal must DSCR.
Hard money
10% down · 12.0% · 12mo
- Down + closing
- —
- Monthly P&I
- —
- Monthly cashflow
- —
- DSCR
- —
- Eligible?
- —
Short-term bridge; refi at stabilization.
Rent comps 24 comps
| Address | Beds | Baths | Sqft | Rent | $/sqft | DOM | Units | Dist |
|---|---|---|---|---|---|---|---|---|
| 416 Sunnyside Ave Waterloo, IA | 3.0 | 1.0 | 1200 | $825 | $0.69 | 45d | 1 | 0.20mi |
| 418 Sunnyside Ave Waterloo, IA | 3.0 | 1.0 | 1200 | $675 | $0.56 | 45d | 1 | 0.20mi |
| 820 W 2nd St Apt 2 Waterloo, IA | 2.0 | 1.5 | 1100 | $695 | $0.63 | 45d | 1 | 0.32mi |
| 45 W Jefferson St Waterloo, IA | 1.0–2.0 | 1.0–2.0 | 1062 | $1,750 | $1.65 | 22d | 9 | 0.34mi |
| 1427 W 2nd St Waterloo, IA | 3.0 | 1.0 | 1248 | $1,250 | $1.00 | 45d | 1 | 0.59mi |
| 223 W 4th St Ste 203 Waterloo, IA | 2.0 | 1.5 | 1466 | $1,250 | $0.85 | 45d | 1 | 0.67mi |
| 702 Western Ave Waterloo, IA | 2.0 | 1.5 | 1500 | $1,100 | $0.73 | 22d | 1 | 0.72mi |
| 1840 W 3rd St Waterloo, IA | 2.0 | 1.0 | 1770 | $700 | $0.40 | 46d | 1 | 0.77mi |
| 616 Kimball Ave Waterloo, IA | 3.0 | 1.0 | 1302 | $1,100 | $0.84 | 45d | 1 | 0.78mi |
| 719 Marsh St Waterloo, IA | 3.0 | 1.0 | 1224 | $1,100 | $0.90 | 22d | 1 | 0.86mi |
| 311 E 3rd St Waterloo, IA | 2.0 | 2.0 | 1154 | $1,500 | $1.30 | 22d | 1 | 0.88mi |
| 905 Baltimore St Waterloo, IA | 3.0 | 1.5 | 1392 | $1,025 | $0.74 | 45d | 1 | 0.93mi |
| 824 Sycamore St Unit 824-09 Waterloo, IA | 2.0 | 2.0 | 1054 | $1,250 | $1.19 | 45d | 1 | 0.99mi |
| 924 Sycamore St #1 Waterloo, IA | 2.0 | 2.0 | 1054 | $1,250 | $1.19 | 45d | 1 | 1.03mi |
| 920-928 Sycamore St Unit 920-07 Waterloo, IA | 2.0 | 2.0 | 1054 | $1,250 | $1.19 | 45d | 1 | 1.06mi |
| 2215 Falls Ave Waterloo, IA | 3.0 | 1.0 | 1290 | $1,400 | $1.09 | 45d | 1 | 1.14mi |
| 910 Mulberry St Apt 3 Waterloo, IA | 2.0 | 1.0 | 1064 | $695 | $0.65 | 22d | 1 | 1.14mi |
| 214 Edwards St Waterloo, IA | 3.0 | 1.0 | 1150 | $825 | $0.72 | 22d | 1 | 1.19mi |
| 1107 Mulberry St Waterloo, IA | 3.0 | 1.0 | 1248 | $950 | $0.76 | 22d | 1 | 1.26mi |
| 2539 W 3rd St Waterloo, IA | 3.0 | 2.5 | 1200 | $1,695 | $1.41 | 22d | 1 | 1.26mi |
| 1014 Fletcher Ave Waterloo, IA | 4.0 | 3.5 | 2123 | $2,450 | $1.15 | 45d | 1 | 1.29mi |
| 824 Logan Ave Waterloo, IA | 4.0 | 2.0 | 1572 | $1,425 | $0.91 | 22d | 1 | 1.36mi |
| 216 Courtland St Apt 1 Waterloo, IA | 4.0 | 1.0 | 1150 | $825 | $0.72 | 22d | 1 | 1.39mi |
| 203 Reed St Waterloo, IA | 3.0 | 1.5 | 1492 | $1,200 | $0.80 | 22d | 1 | 1.41mi |
Listing history 10 events
-
2026-04-28status Pending
-
2026-04-20price $89,900
-
2026-04-01price $94,900
-
2026-03-25price $97,500
-
2026-03-09price $99,999
-
2025-12-17price $103,999
-
2025-10-15status Active
-
2025-09-29status Pending
-
2025-09-08price $104,900
-
2025-08-06$109,900 Active
ⓘ Source: listings_history table (triggers on properties + properties_extension) + one-shot
backfill from property_details.listing_events for pre-trigger history.
Tax reassessment forecast IA · Partial reset (capped growth)
- Current annual tax
- $796 · $66/mo
- Projected year-2 tax
- $1,104 · $92/mo
- Expected delta
- +$308/yr (+$26/mo · 38.7%)
ⓘ Screening estimate from a state-policy table — verify with the county assessor before closing.
Climate risk First Street
- Flood 1/10 Low FEMA zone X (unshaded) · 0% chance over 30 yrs
- Wildfire 1/10 Low
- Heat 3/10 Moderate 7 d/yr ≥101°F today · 16 d/yr by 30 yrs out
- Wind 2/10 Low
- Air quality 1/10 Low 0 unhealthy d/yr today · 0 by 30 yrs out
Nearby sold comps map
Loading sold comps map…
Walkable amenities ~0.75 mi
Loading nearby amenities…
Taxation est. · year 1
- Rental income
- $13,358
- − Mortgage interest
- −$5,036
- − Property taxes
- −$796
- − Insurance
- −$450
- − Repairs & maintenance
- −$1,069
- − Management
- −$1,069
- − Depreciation
- −$2,615
- Taxable income
- $2,324
- Est. tax owed @ 24.0%
- −$558
- After-tax cash flow
- $3,092/yr
For passive investors: Depreciation is non-cash, so a rental often shows a tax loss while cash-flowing — sheltering income. Rental losses are passive: they offset passive income freely, and up to $25,000/yr can offset ordinary (W-2) income if you actively participate and your MAGI is under $100k (phasing out to $0 by $150k); unused losses carry forward. On sale, claimed depreciation is recaptured at up to 25%, and gains may owe capital-gains tax (a 1031 exchange can defer both). Figures are a year-1 estimate at your 24.0% rate — not tax advice; consult a CPA.
Schools (NCES district)
- District
- Waterloo Community School District
- NCES district ID
- 1930480
- Math proficiency
- 50% ▼ -4.00%
- Reading proficiency
- 54% ▲ 1.00%
- Median HH income
- $42,545
- Composite
- 43.72/100
- National rank
- #2950
- State rank
- #276 of 289 in IA
Livability — Waterloo
- Score
- 81/100
- State rank
- #74
- US rank
- #1589
Category grades
Schools grade is shown separately in the Schools card above.
Census & demographics
- Census place
- Waterloo, IA
- County
- Black Hawk County · 112,933 people
- City population
- 69,066
- Metro
- Waterloo-Cedar Falls, IA
- Population (ZIP)
- 20,882
- Household income
- $62,021
- Rent vs Own
- Severe rent burden
- 479.0
Population outlook (Black Hawk County) Hauer SSP2
- Today (2025)
- 139,716 people
- By 2030
- 142,853 · +2.2%
- By 2040
- 147,843 · +5.8%
- By 2050
- 153,247 · +9.7%
- By 2075
- 167,977 · +20.2%
- By 2100
- 177,320 · +26.9%
Race, ethnicity, and origin ACS 2023
- Neighborhood character
- Predominantly White (68%)
- Race & ethnicity
- White 68% Black 14% Hispanic / Latino 9% Two or more races 5% Asian 3% Pacific Islander 3% Native American 1%
- Hispanic origin (detail)
- Mexican 6% Puerto Rican 1%
- Common ancestry
- American 5% Portuguese 3% Lithuanian 2%
- Foreign-born
- 15% · Canada, Philippines
- Languages at home
- 79% English-only · Spanish 7% Russian/Polish/Slavic 6% Other Asian/Pacific 4%
Political lean MEDSL · Black Hawk
- 2024 margin
- Toss-up / Even · D 50.0% · R 48.8% · Other 1.2%
- 2008→2024 swing
- -21.3pp toward R · 2008: 22.4pp · 2024: 1.2pp
- All cycles
- 2024: D+1.2 2020: D+9.0 2016: D+7.3 2012: D+20.0 2008: D+22.4
Not yet ingested
- Civics
- —
Market trends
- HPI YoY
- ▼ -110.86%
- Current HPI
- 155.4447
- Rent YoY
- ▲ 2.70%
- Metro
- Waterloo-Cedar Falls, IA
- State GDP YoY
- ▲ 2.48%
- F500 in state
- 4
Industry mix (Fortune 500 HQ in IA)
| Industry | F500 HQs | Revenue |
|---|---|---|
| Financial Services | 1 | $16B |
|
||
| Retail / Convenience | 1 | $15B |
|
||
Price history
-18.2% since first listed10 events — show timeline
- 2026-04-28 Pending — NEIRBR as distributed by MLS GRID
- 2026-04-20 Price Changed $89,900 NEIRBR as distributed by MLS GRID
- 2026-04-01 Price Changed $94,900 NEIRBR as distributed by MLS GRID
- 2026-03-25 Price Changed $97,500 NEIRBR as distributed by MLS GRID
- 2026-03-09 Price Changed $99,999 NEIRBR as distributed by MLS GRID
- 2025-12-17 Price Changed $103,999 NEIRBR as distributed by MLS GRID
- 2025-10-15 Relisted — NEIRBR as distributed by MLS GRID
- 2025-09-29 Pending — NEIRBR as distributed by MLS GRID
- 2025-09-08 Price Changed $104,900 NEIRBR as distributed by MLS GRID
- 2025-08-06 Listed $109,900 NEIRBR as distributed by MLS GRID
Property tax history
-2.0%/yrLatest (2025): $796 · -7.7% YoY. Source: county tax records.
Cash-flow waterfall
monthlySold comps — $/sqft
last 12 mo · ≤1 miLoading sold comps…