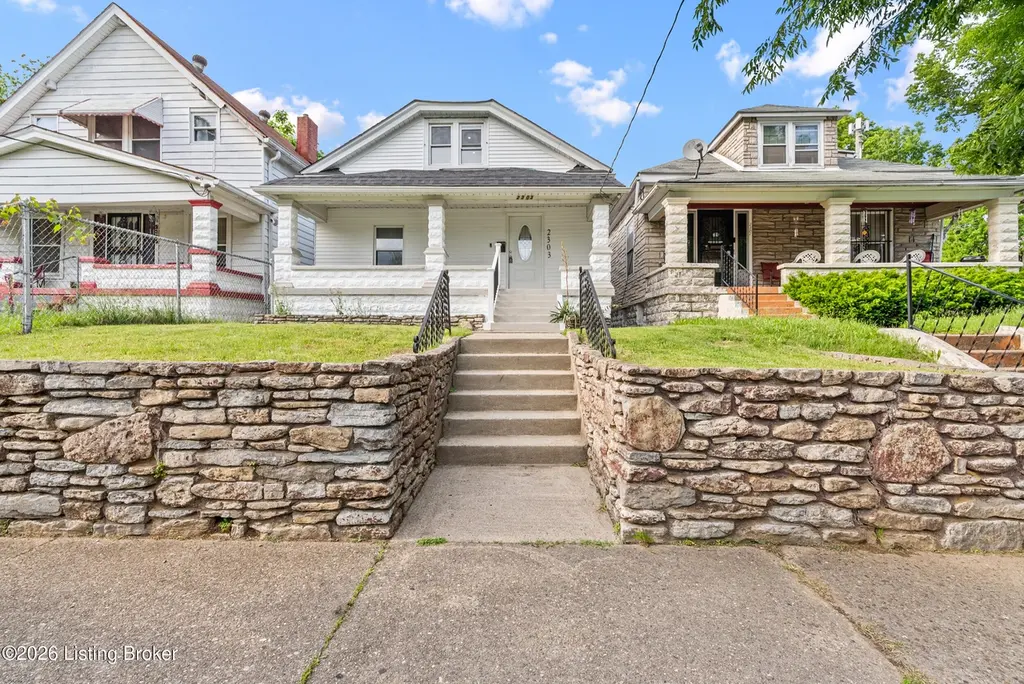
2303 Greenwood Ave · Louisville, KY
Flood risk 1/10 · Minimal
- FEMA flood zone
- X (shaded)
- Chance of flooding over 30 yrs
- 0.0%
- Est. flood insurance / yr
- $473 – $860
Fire risk 1/10 · Minimal
- Est. fire insurance / yr
- $839 – $1,559
Heat risk 5/10 · Moderate
- Hot days now (above 105°F)
- 7 days/yr
- Hot days in 30 yrs
- 20 days/yr
Wind risk 2/10 · Minimal
- Chance of severe wind over 30 yrs
- 1.0%
Air-quality risk 2/10 · Minimal
- Unhealthy air days now
- 1 days/yr
- Unhealthy air days in 30 yrs
- 3 days/yr
Risk factors via First Street. Map © Google.
Why this score? — see what drove the B- grade
The composite is a weighted blend of 9 inputs, each scored 0–100. Each bar is that input's sub-score; the figure is the points it added to the 100-point composite (weight × sub-score).
- Cash flow +19.5/30.0
- ARV discount +15.0/15.0
- Appreciation +10.0/10.0
- DSCR +6.2/10.0
- Rent growth +4.5/5.0
- 1% rule +4.0/10.0
- Livability +3.2/5.0
- Condition / age +2.5/5.0
- Schools +2.3/10.0
$214,900
🖨 Deal sheet 📄 Offer letter ✓ Due diligence
Listing remarks MLS
Attention Investors!!! This large bungalow style home has great potential for rental income! Call today for your private showing! House is being sold as-is, where-is with no warranties implied or expressed. Buyer to verify any and all information or lack of information including but not limited to square footage, lot size, utilities, foundations, etc. The seller has had all new plumbing and gas lines professionally installed throughout home.
Key facts
- 3,920 sq ft lot
- Garage
- Built 1920
Property features AI
Finance
- Other: Subdivision: None
- HOA & community: No association fee
Exterior
- Parking: Detached 1-car garage
- Utilities: Natural gas fuel; Standard municipal utilities (water/sewer/power not specified)
- Home design: Single-family bungalow; 2 stories; Built in 1920
- Construction: Aluminum siding, block and stone exterior materials; Shingle roof; Poured concrete foundation; About 2,821 total living area (1,724 above grade; 1,097 below grade)
- Exterior features: Partial chain-link fencing; Sidewalk; Cleared yard; Lot dimensions approximately 30 x 135
Interior
- Kitchen: Kitchen on the first floor
- Bedrooms: 4 bedrooms total; Primary bedroom on the first floor; Two bedrooms on the second floor; Two bedrooms on the first floor
- Bathrooms: 3 full bathrooms total; Primary bathroom on the first floor; Additional full bathroom on the second floor
- Heating & cooling: Forced air heating (natural gas); Two HVAC units; Central air conditioning (two units)
- Interior features: Finished basement; 7 total main rooms; 10 total rooms; 4 closets; No fireplaces
- Laundry & utility: No first-floor laundry
Neighborhood map
What this means for you Summary
Snapshot
- This is a 4-bed/3.0-bath single-family listed at $215k.
Deal economics
- At list price, monthly cash flow is $244 ($3k/yr) — positive.
- The deal already cash-flows at list — no discount required.
- To meet the 1% rule (rent ≥ 1% of price), the offer needs to be $194k (9.6% below list).
- Recommended offer: $194k (9.6% below list) — sets the bar for 1% rule.
- Cap rate 7.7% vs local median 5.0% in Louisville — top-decile yield for the area; either an underpriced asset or a hidden risk that comps aren't pricing in. Stress-test before assuming the spread holds.
Location & tenants
- Location reads 63/100 on livability (#333 in KY) — a middle-class / working-renter tenant base. Strengths: cost of living A+, housing A+; Watch: employment C-, health & safety D+, schools D-.
- Jefferson County (urban): math 19% / reading 35% proficiency, ranked #121 of 165 in KY (top 73%) — low school quality limits family demand, transient renter base, plan for 1-2y turnover.
- Market conditions: Rents rising fast (+8.1%/yr); 91 active listings in the ZIP; 2 comparable units currently listed for rent nearby; lower-income renter base — watch delinquency; 2,836 units permitted in Jefferson County in 2024 (1,558 in 5+ unit buildings).
Forward outlook
- In year one you build about $23k of equity ($1k loan paydown + $21k appreciation (10.0% local appreciation)).
- Jefferson County population projected at +13% by 2050 — modest demand growth; plan on rents tracking national, not racing it.
- At projected returns (10.0% appreciation + 8.0% rent growth), your $60k cash investment doubles in ~3 years — after that, you're playing with house money.
- By year 2, paydown + projected appreciation supports a ~$37k cash-out refi (75% LTV) — recoverable capital for the next deal without selling this one.
Negotiation context
- Only 6 days on market — expect competitive offers; lowballing is unlikely to land.
- 7 sale attempts since 22y ago with the ask held roughly flat each time — persistent listings suggest the price (not the market) is what's stuck; bring a comps-based counter.
- Current owner paid $38k; list at $215k implies a 473% gain — meaningful room to come down on a strong offer.
Risks & watch-outs
- Watch-outs: built in 1920 — expect roof / HVAC / electrical / plumbing capex.
- Climate carrying-cost: extreme-heat days projected 7→20/yr by 2055 (HVAC capex compounding) — expect insurance premiums to compound above CPI over the hold.
Questions for the listing agent
- Built in 1920 — when were the roof, HVAC, electrical panel, plumbing, and water heater last replaced?
- Is there a deadline driving the sale (1031 exchange, divorce, estate, relocation)? That informs how much negotiation room exists.
- Schools are D-rated, which usually means shorter tenancies and higher turnover. Who's the typical renter profile here, and what's been the actual vacancy rate?
- Crime grade is F in this area — have there been break-ins, vandalism, or insurance claims at this property in the last 3 years? What carrier currently insures it and at what premium?
- What's the average days-on-market for RENTAL listings here right now (not sales)? A rising rental-DOM trend means longer vacancies and softer asking-rent achievability than the comps imply.
- What's the recent tenant-quality profile in this submarket — average credit score on applications, eviction rate, late-payment / NSF rate, and stable-employment percentage? A property-management company in the area should have these aggregated.
- How much new for-sale + rental construction is in the pipeline within 1–3 miles? Heavy new supply typically softens prices + rents 12–24 months out; constrained supply supports both.
Investment metrics
- 1% rule
- 0.90% ✗
- Cap rate
- 7.65%
- Cash-on-cash
- 4.86%
- DSCR
- 1.22
- GRM
- 9.2
CMA / ARV
- ARV (on-the-fly)
- $265,174
- Comps found
- 2
Show comp detail 2 sales within ~0.75 mi
| Address | Dist | Beds/Ba | Sqft | Sold | Price | $/sf | Match |
|---|---|---|---|---|---|---|---|
| 2212 Grand Ave | 0.13mi | 4/2.0 | 2,573 (-9%) | 18mo | $125,000 | $49 | 60 |
| 1382 Dixie Hwy | 0.65mi | 5/2.5 (+1) | 3,152 (+12%) | 21mo | $296,000 | $94 | 25 |
Match score weights: distance 35% · size 25% · config 20% · recency 20%. Top-matched comps best support the ARV.
Projected returns pro-forma
10.0% appreciation · 8.0% rent growth · sell at horizon
- IRR
- 29.5%
- Equity multiple
- 3.37×
- Total profit
- $142,726
- Equity at exit
- $193,599
- IRR
- 27.0%
- Equity multiple
- 8.20×
- Total profit
- $433,360
- Equity at exit
- $417,503
Cash invested: $60,172 (down + closing). Projections, not guarantees.
Landlord ↔ Tenant lean methodology
- Overall (STATE)
- 83 Strongly Landlord-Friendly
- State Kentucky
- 83 Strongly Landlord-Friendly · R+16
- County
- — inherits STATE
- City
- — inherits STATE
ZIP-level market 40210
- Home prices YoY
- 12.1%
- Rents YoY
- 8.1%
- Active inventory
- 91
- Price-to-rent
- 9.2×
Monthly cashflow live
- Estimated rent
- $1,943 medium interval (Pro) →
- Mortgage (P&I)
- −$1,127
- Tax from tax record
- −$75 /mo · $895/yr
- Insurance
- −$90
- HOA
- −$0
- Vacancy / Maint / Mgmt
- −$408
- Net cashflow
- $244
Break-even live
UW: 25.0% down · 7.5% · 30yr · 1.5% tax · 5.0% vac · 8.0% maint · 8.0% mgmt
Financing live
Cash to close
- Down payment
- $53,725
- Closing costs
- $6,447
- Reserves months
- —
- Total cash needed
- —
Loan-product check · same deal, 3 products live
Conventional
25% down · 7.5% · 30yr
- Down + closing
- —
- Monthly P&I
- —
- Monthly cashflow
- —
- DSCR
- —
- Eligible?
- —
Personal DTI + credit; lowest rate.
DSCR
20% down · 8.5% · 30yr
- Down + closing
- —
- Monthly P&I
- —
- Monthly cashflow
- —
- DSCR
- —
- Eligible?
- —
No personal income docs; deal must DSCR.
Hard money
10% down · 12.0% · 12mo
- Down + closing
- —
- Monthly P&I
- —
- Monthly cashflow
- —
- DSCR
- —
- Eligible?
- —
Short-term bridge; refi at stabilization.
Rent comps 2 comps
| Address | Beds | Baths | Sqft | Rent | $/sqft | DOM | Units | Dist |
|---|---|---|---|---|---|---|---|---|
| 858 S 23rd St Louisville, KY | 5.0 | 1.0 | 2228 | $2,100 | $0.94 | 17d | 1 | 0.21mi |
| 3909 W Broadway Louisville, KY | 5.0 | 2.0 | 2000 | $1,745 | $0.87 | 16d | 1 | 1.50mi |
Listing history 21 events
-
2026-05-16status Pending
-
2026-05-11$214,900 Active
-
2022-02-14historical
-
2021-10-28$69,000 Active
-
2021-10-28price $69,000
-
2020-02-07soldstatus $37,500 Closed 445-char remark
Show marketing remark (445 chars)
Attention Investors!!! This large bungalow style home has great potential for rental income! Call today for your private showing! House is being sold as-is, where-is with no warranties implied or expressed. Buyer to verify any and all information or lack of information including but not limited to square footage, lot size, utilities, foundations, etc. The seller has had all new plumbing and gas lines professionally installed throughout home.
-
2020-01-31status Pending 445-char remark
Show marketing remark (445 chars)
Attention Investors!!! This large bungalow style home has great potential for rental income! Call today for your private showing! House is being sold as-is, where-is with no warranties implied or expressed. Buyer to verify any and all information or lack of information including but not limited to square footage, lot size, utilities, foundations, etc. The seller has had all new plumbing and gas lines professionally installed throughout home.
-
2020-01-29$45,000 Active 445-char remark
Show marketing remark (445 chars)
Attention Investors!!! This large bungalow style home has great potential for rental income! Call today for your private showing! House is being sold as-is, where-is with no warranties implied or expressed. Buyer to verify any and all information or lack of information including but not limited to square footage, lot size, utilities, foundations, etc. The seller has had all new plumbing and gas lines professionally installed throughout home.
-
2019-05-31soldstatus $15,501 Closed
-
2019-05-31soldstatus $15,501
-
2019-02-23status Pending
-
2019-02-20status Active
-
2019-02-20price $14,000
-
2019-01-23historical
-
2018-11-12price $25,000
-
2018-11-12$32,000 Active
-
2018-11-12price $32,000
-
2006-12-26historical
-
2006-06-26$85,000
-
2005-02-25historical
-
2004-11-22$88,000
ⓘ Source: listings_history table (triggers on properties + properties_extension) + one-shot
backfill from property_details.listing_events for pre-trigger history.
Tax reassessment forecast KY · Resets to sale price
- Current annual tax
- $895 · $75/mo
- Projected year-2 tax
- $1,848 · $154/mo
- Expected delta
- +$953/yr (+$79/mo · 106.5%)
ⓘ Screening estimate from a state-policy table — verify with the county assessor before closing.
Climate risk First Street
- Flood 1/10 Low FEMA zone X (shaded) · 0% chance over 30 yrs
- Wildfire 1/10 Low
- Heat 5/10 Major 7 d/yr ≥105°F today · 20 d/yr by 30 yrs out
- Wind 2/10 Low 100% chance of damaging wind over 30 yrs
- Air quality 2/10 Low 1 unhealthy d/yr today · 3 by 30 yrs out
Nearby sold comps map
Loading sold comps map…
Walkable amenities ~0.75 mi
Loading nearby amenities…
Taxation est. · year 1
- Rental income
- $23,310
- − Mortgage interest
- −$12,038
- − Property taxes
- −$895
- − Insurance
- −$1,074
- − Repairs & maintenance
- −$1,865
- − Management
- −$1,865
- − Depreciation
- −$6,252
- Taxable loss
- −$678
- Est. tax savings @ 24.0%
- +$163
- After-tax cash flow
- $3,085/yr
For passive investors: Depreciation is non-cash, so a rental often shows a tax loss while cash-flowing — sheltering income. Rental losses are passive: they offset passive income freely, and up to $25,000/yr can offset ordinary (W-2) income if you actively participate and your MAGI is under $100k (phasing out to $0 by $150k); unused losses carry forward. On sale, claimed depreciation is recaptured at up to 25%, and gains may owe capital-gains tax (a 1031 exchange can defer both). Figures are a year-1 estimate at your 24.0% rate — not tax advice; consult a CPA.
Schools (NCES district)
- District
- Jefferson County
- NCES district ID
- 2102990
- Math proficiency
- 19% ▼ -17.00%
- Reading proficiency
- 35% ▼ -11.00%
- Median HH income
- $47,885
- Composite
- 23.45/100
- National rank
- #7884
- State rank
- #121 of 165 in KY
Livability — Louisville
- Score
- 63/100
- State rank
- #333
- US rank
- #15887
Category grades
Schools grade is shown separately in the Schools card above.
Census & demographics
- Census place
- Louisville, KY
- County
- Jefferson County · 790,184 people
- City population
- 769,292
- Metro
- Louisville/Jefferson County, KY-IN
- Population (ZIP)
- 13,518
- Household income
- $35,347
- Rent vs Own
- Severe rent burden
- 815.0
Population outlook (Jefferson County) Hauer SSP2
- Today (2025)
- 823,112 people
- By 2030
- 849,343 · +3.2%
- By 2040
- 895,696 · +8.8%
- By 2050
- 933,630 · +13.4%
- By 2075
- 1,028,262 · +24.9%
- By 2100
- 1,072,675 · +30.3%
Race, ethnicity, and origin ACS 2023
- Neighborhood character
- Predominantly Black (84%)
- Race & ethnicity
- Black 84% White 8% Two or more races 5% Hispanic / Latino 3%
- Common ancestry
- Iranian 1%
- Foreign-born
- 4% · Canada
- Languages at home
- 93% English-only · Spanish 3%
Political lean MEDSL · Jefferson
- 2024 margin
- D (+16.6) · D 57.4% · R 40.9% · Other 1.7%
- 2008→2024 swing
- +4.5pp toward D · 2008: 12.0pp · 2024: 16.6pp
- All cycles
- 2024: D+16.6 2020: D+20.1 2016: D+13.3 2012: D+11.1 2008: D+12.0
Not yet ingested
- Civics
- —
Market trends
- HPI YoY
- ▲ 28.45%
- Current HPI
- 264.0146
- Rent YoY
- ▲ 8.05%
- Metro
- Louisville/Jefferson County, KY-IN
- State GDP YoY
- ▲ 1.81%
- F500 in state
- 4
Industry mix (Fortune 500 HQ in KY)
| Industry | F500 HQs | Revenue |
|---|---|---|
| Healthcare | 1 | $118B |
|
||
| Food / Beverage | 1 | $7B |
|
||
Price history
+144.2% since first listed21 events — show timeline
- 2026-05-16 Pending — Metro Search MLS
- 2026-05-11 Listed $214,900 Metro Search MLS
- 2022-02-14 Listing Removed — Metro Search MLS
- 2021-10-28 Price Changed $69,000 Metro Search MLS
- 2021-10-28 Listed $69,000 Metro Search MLS
- 2020-02-07 Sold (MLS) $37,500 Metro Search MLS
- 2020-01-31 Pending — Metro Search MLS
- 2020-01-29 Listed $45,000 Metro Search MLS
- 2019-05-31 Sold (Public Records) $15,501 Public Records
- 2019-05-31 Sold (MLS) $15,501 Metro Search MLS
- 2019-02-23 Pending — Metro Search MLS
- 2019-02-20 Relisted — Metro Search MLS
- 2019-02-20 Price Changed $14,000 Metro Search MLS
- 2019-01-23 Listing Removed — Metro Search MLS
- 2018-11-12 Price Changed $32,000 Metro Search MLS
- 2018-11-12 Listed $32,000 Metro Search MLS
- 2018-11-12 Price Changed $25,000 Metro Search MLS
- 2006-12-26 Listing Removed — Metro Search MLS
- 2006-06-26 Listed $85,000 Metro Search MLS
- 2005-02-25 Listing Removed — Metro Search MLS
- 2004-11-22 Listed $88,000 Metro Search MLS
Property tax history
+5.7%/yrLatest (2025): $895 · -1.9% YoY. Source: county tax records.
Cash-flow waterfall
monthlySold comps — $/sqft
last 12 mo · ≤1 miLoading sold comps…