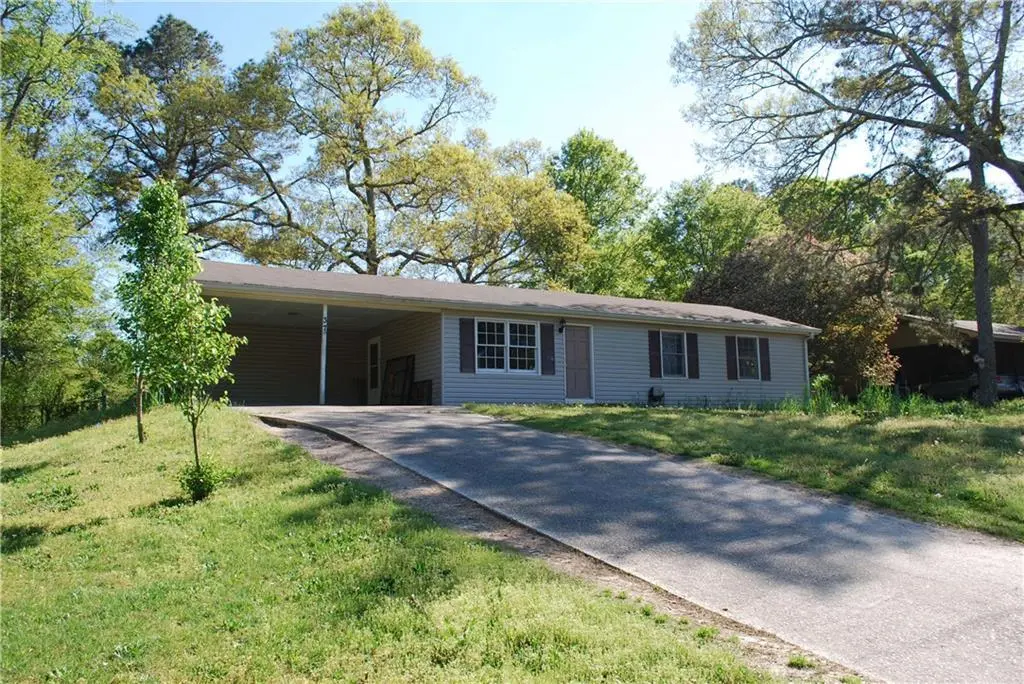
37 Forkwood Cir · Powder Springs, GA
Flood risk 1/10 · Minimal
- FEMA flood zone
- X (unshaded)
- Chance of flooding over 30 yrs
- 0.0%
- Est. flood insurance / yr
- $507 – $1,088
Fire risk 4/10 · Minor
- Est. fire insurance / yr
- $963 – $1,789
Heat risk 5/10 · Moderate
- Hot days now (above 104°F)
- 7 days/yr
- Hot days in 30 yrs
- 17 days/yr
Wind risk 4/10 · Minor
- Chance of severe wind over 30 yrs
- 21.0%
Air-quality risk 4/10 · Minor
- Unhealthy air days now
- 5 days/yr
- Unhealthy air days in 30 yrs
- 6 days/yr
Risk factors via First Street. Map © Google.
Why this score? — see what drove the C+ grade
The composite is a weighted blend of 9 inputs, each scored 0–100. Each bar is that input's sub-score; the figure is the points it added to the 100-point composite (weight × sub-score).
- Cash flow +21.7/30.0
- ARV discount +15.0/15.0
- DSCR +6.9/10.0
- 1% rule +5.3/10.0
- Schools +3.6/10.0
- Livability +3.6/5.0
- Rent growth +3.2/5.0
- Condition / age +2.5/5.0
- Appreciation +0.0/10.0
$210,000
🖨 Deal sheet (PDF) 📄 Offer letter ✓ Due diligence
Listing remarks
!!! PRICE IMPROVEMENT !!! Calling all INVESTORS!!! Beautiful Ranch Home in a Great Location. Large 3Br 2Ba Sprawling Ranch with opportunity to Expand. Can also close in Carport area for potential 4th Bedroom/3rd Bath. Huge level fenced backyard with tool shed. Home needs some work and is being sold As-Is. Home has Tremendous Potential with mostly Cosmetic Needs. Bones appear to be Solid! Tremendous opportunity for a local Handyman or Investors. Conveniently located just minutes from Downtown Hiram Shopping and Dining District!
Key facts
- Ranch home
- Tool shed
- Potential 3rd bath
Tags
Neighborhood map
What this means for you Summary
Snapshot
- This is a 3-bed/2.0-bath single-family listed at $210k.
Deal economics
- At list price, monthly cash flow is $322 ($4k/yr) — positive.
- The deal already cash-flows at list — no discount required.
- Meets the 1% rule at list price ($2k rent vs $210k).
- Recommended offer: $185k (12.0% below list) — sets the bar for market timing.
- Cap rate 8.1% vs local median 3.7% in Powder Springs — top-decile yield for the area; either an underpriced asset or a hidden risk that comps aren't pricing in. Stress-test before assuming the spread holds.
Location & tenants
- Location reads 71/100 on livability (#79 in GA) — a middle-class / working-renter tenant base. Strengths: housing A+, cost of living A, employment B+; Watch: amenities F, commute F.
- Paulding County (suburban): math 39% / reading 42% proficiency, ranked #33 of 174 in GA (top 19%) — families likely to look elsewhere, expect single-tenant / working-renter base with shorter leases.
- Market conditions: Rents rising (+2.9%/yr); 238 active listings in the ZIP; 2 comparable units currently listed for rent nearby; solid renter incomes; 1,458 units permitted in Paulding County in 2024 (0 in 5+ unit buildings).
Forward outlook
- Local home prices are declining (-3.0%/yr); year-one equity from $1k of loan paydown is wiped out by about $6k of value loss. Plan a longer hold.
- Paulding County population projected at +24% by 2050 — long-run rental-demand tailwind backs the buy-and-hold thesis.
Negotiation context
- It's been on market 136 days — a 12% lower offer ($185k) is reasonable based on typical stale-listing flexibility.
- 6 sale attempts since 7y ago; this cycle's ask has dropped $20k (9%) from the opening price — seller is motivated, your offer sets the floor, not the list.
- Current owner paid $125k; list at $210k implies a 68% gain — meaningful room to come down on a strong offer.
Risks & watch-outs
- Climate carrying-cost: extreme-heat days projected 7→17/yr by 2055 (HVAC capex compounding) — expect insurance premiums to compound above CPI over the hold.
Questions for the listing agent
- It's been on market 136 days. Have you received any prior offers? Is the seller open to a 12% concession, seller financing, or rate buy-down credit?
- Built in 1974 — when were the roof, HVAC, electrical panel, plumbing, and water heater last replaced?
- Why hasn't it sold? Are there any deal-killer items the seller is aware of (foundation, flood, title, zoning, code violations)?
- Is there a deadline driving the sale (1031 exchange, divorce, estate, relocation)? That informs how much negotiation room exists.
- What's the average days-on-market for RENTAL listings here right now (not sales)? A rising rental-DOM trend means longer vacancies and softer asking-rent achievability than the comps imply.
- What's the recent tenant-quality profile in this submarket — average credit score on applications, eviction rate, late-payment / NSF rate, and stable-employment percentage? A property-management company in the area should have these aggregated.
- How much new for-sale + rental construction is in the pipeline within 1–3 miles? Heavy new supply typically softens prices + rents 12–24 months out; constrained supply supports both.
Investment metrics
- 1% rule
- 1.03% ✓
- Cap rate
- 8.13%
- Cash-on-cash
- 6.58%
- DSCR
- 1.29
- GRM
- 8.1
CMA / ARV
- ARV (median comp)
- $302,531
- List price
- $210,000
- Delta
- -30.59%
- Verdict
- UNDERPRICED
- Comps
- 20 within 1.0 mi
Show comp detail 9 sales within ~0.75 mi
| Address | Dist | Beds/Ba | Sqft | Sold | Price | $/sf | Match |
|---|---|---|---|---|---|---|---|
| 46 Forkwood Cir | 0.03mi | 3/2.0 | 1,584 (-10%) | 10mo | $285,000 | $180 | 74 |
| 708 Morris Rd | 0.08mi | 3/2.0 | 1,536 (-12%) | 8mo | $240,000 | $156 | 68 |
| 398 Forkwood Way | 0.20mi | 3/2.0 | 1,508 (-14%) | 18mo | $435,000 | $288 | 52 |
| 303 Morris Rd | 0.50mi | 2/1.5 (-1) | 1,800 (+2%) | 17mo | $339,500 | $189 | 51 |
| 30 Hunters Cv | 0.31mi | 3/2.0 | 1,500 (-15%) | 21mo | $293,000 | $195 | 44 |
| 214 S Lake Dr | 0.31mi | 2/1.0 (-1) | 1,508 (-14%) | 11mo | $145,000 | $96 | 43 |
| 25 Echo Ridge Dr | 0.37mi | 4/3.0 (+1) | 2,012 (+15%) | 8mo | $305,000 | $152 | 43 |
| 810 Morningside Dr | 0.71mi | 3/2.5 | 1,862 (+6%) | 17mo | $310,000 | $166 | 40 |
| 157 Pat Dr | 0.48mi | 4/3.0 (+1) | 1,985 (+13%) | 14mo | $319,000 | $161 | 35 |
Match score weights: distance 35% · size 25% · config 20% · recency 20%. Top-matched comps best support the ARV.
Projected returns pro-forma
-3.0% appreciation · 2.9% rent growth · sell at horizon
- IRR
- -6.3%
- Equity multiple
- 0.77×
- Total profit
- $-13,720
- Equity at exit
- $31,312
- IRR
- 3.2%
- Equity multiple
- 1.23×
- Total profit
- $13,581
- Equity at exit
- $18,157
Cash invested: $58,800 (down + closing). Projections, not guarantees.
Landlord ↔ Tenant lean methodology
- Overall (STATE)
- 90 Strongly Landlord-Friendly
- State Georgia
- 90 Strongly Landlord-Friendly · R+3
- County
- — inherits STATE
- City
- — inherits STATE
ZIP-level market 30141
- Home prices YoY
- -17.3%
- Rents YoY
- 2.9%
- Active inventory
- 238
- Price-to-rent
- 8.1×
Monthly cashflow live
- Estimated rent
- $2,170 medium interval (Pro) →
- Mortgage (P&I)
- −$1,101
- Tax from tax record
- −$203 /mo · $2,434/yr
- Insurance
- −$88
- HOA
- −$0
- Vacancy / Maint / Mgmt
- −$456
- Net cashflow
- $322
Break-even live
Sensitivity live
| Price | -10% $441 | -5% $382 | +0% $322 | +5% $263 | +10% $203 |
|---|---|---|---|---|---|
| Rent | -10% $151 | -5% $237 | +0% $322 | +5% $408 | +10% $494 |
| Rate | -1.0pp $428 | -0.5pp $376 | base $322 | +0.5pp $268 | +1.0pp $213 |
UW: 25.0% down · 7.5% · 30yr · 1.5% tax · 5.0% vac · 8.0% maint · 8.0% mgmt
Financing live
Cash to close
- Down payment
- $52,500
- Closing costs
- $6,300
- Reserves months
- —
- Total cash needed
- —
Loan-product check · same deal, 3 products live
Conventional
25% down · 7.5% · 30yr
- Down + closing
- —
- Monthly P&I
- —
- Monthly cashflow
- —
- DSCR
- —
- Eligible?
- —
Personal DTI + credit; lowest rate.
DSCR
20% down · 8.5% · 30yr
- Down + closing
- —
- Monthly P&I
- —
- Monthly cashflow
- —
- DSCR
- —
- Eligible?
- —
No personal income docs; deal must DSCR.
Hard money
10% down · 12.0% · 12mo
- Down + closing
- —
- Monthly P&I
- —
- Monthly cashflow
- —
- DSCR
- —
- Eligible?
- —
Short-term bridge; refi at stabilization.
Rent comps 2 comps
| Address | Beds | Baths | Sqft | Rent | $/sqft | DOM | Units | Dist |
|---|---|---|---|---|---|---|---|---|
| 48 Deerhunter Ln Powder Springs, GA | 3.0 | 2.0 | 1436 | $1,795 | $1.25 | 5d | 1 | 0.32mi |
| 4590 Ridgeview Dr Powder Springs, GA | 4.0 | 2.0 | 1228 | $1,781 | $1.45 | 3d | 1 | 1.16mi |
Listing history 34 events
-
2026-06-21days on market $210,000 Active 136 DOM
-
2026-06-18days on market $210,000 Active 133 DOM
-
2026-06-17days on market $210,000 Active 132 DOM
-
2026-06-16days on market $210,000 Active 131 DOM
-
2026-06-15days on market $210,000 Active 130 DOM
-
2026-06-13days on market $210,000 Active 128 DOM
-
2026-06-13days on market $210,000 Active 127 DOM
-
2026-06-09days on market $210,000 Active 124 DOM
-
2026-06-08days on market $210,000 Active 123 DOM
-
2026-06-07days on market $210,000 Active 122 DOM
-
2026-06-04statusdays on market $210,000 Active 119 DOM
-
2026-06-03days on market $210,000 Back On Market 118 DOM
-
2026-06-02days on market $210,000 Back On Market 117 DOM
-
2026-06-01statusdays on market $210,000 Back On Market 116 DOM
-
2026-05-04historical
-
2026-05-04historical
-
2026-03-16status Back On Market
-
2026-03-16status Active
-
2026-03-15historical
-
2026-03-15historical
-
2026-02-08price $210,000
-
2026-02-08price $210,000
-
2026-01-04$230,000 Active
-
2026-01-04$230,000 New
-
2019-05-21soldstatus $125,000
-
2019-05-17soldstatus $125,000 Closed
-
2019-05-17soldstatus $125,000 Sold
-
2019-04-20status Under Contract
-
2019-04-20status Pending
-
2019-04-12price $122,900
-
2019-04-11price $122,900
-
2019-02-18$139,900 Active
-
2019-02-18$139,900 New
-
1999-07-09soldstatus $74,500
ⓘ Source: listings_history table (triggers on properties + properties_extension) + one-shot
backfill from property_details.listing_events for pre-trigger history.
Tax reassessment forecast GA · Resets to sale price
- Current annual tax
- $2,434 · $203/mo
- Projected year-2 tax
- $2,434 · $203/mo
- Expected delta
- $0/yr ($0/mo · 0.0%)
ⓘ Screening estimate from a state-policy table — verify with the county assessor before closing.
Climate risk First Street
- Flood 1/10 Low FEMA zone X (unshaded) · 0% chance over 30 yrs
- Wildfire 4/10 Moderate
- Heat 5/10 Major 7 d/yr ≥104°F today · 17 d/yr by 30 yrs out
- Wind 4/10 Moderate 21% chance of damaging wind over 30 yrs
- Air quality 4/10 Moderate 5 unhealthy d/yr today · 6 by 30 yrs out
Nearby sold comps map
Loading sold comps map…
Walkable amenities ~0.75 mi
Loading nearby amenities…
Taxation est. · year 1
- Rental income
- $26,035
- − Mortgage interest
- −$11,763
- − Property taxes
- −$2,434
- − Insurance
- −$1,050
- − Repairs & maintenance
- −$2,083
- − Management
- −$2,083
- − Depreciation
- −$6,109
- Taxable income
- $513
- Est. tax owed @ 24.0%
- −$123
- After-tax cash flow
- $3,745/yr
For passive investors: Depreciation is non-cash, so a rental often shows a tax loss while cash-flowing — sheltering income. Rental losses are passive: they offset passive income freely, and up to $25,000/yr can offset ordinary (W-2) income if you actively participate and your MAGI is under $100k (phasing out to $0 by $150k); unused losses carry forward. On sale, claimed depreciation is recaptured at up to 25%, and gains may owe capital-gains tax (a 1031 exchange can defer both). Figures are a year-1 estimate at your 24.0% rate — not tax advice; consult a CPA.
Schools (NCES district)
- District
- Paulding County
- NCES district ID
- 1304020
- Math proficiency
- 39% ▼ -6.00%
- Reading proficiency
- 42% ▼ -7.00%
- Median HH income
- $61,447
- Composite
- 36.0/100
- National rank
- #4784
- State rank
- #33 of 174 in GA
Livability — Powder Springs
- Score
- 71/100
- State rank
- #79
- US rank
- #6846
Category grades
Schools grade is shown separately in the Schools card above.
Census & demographics
- County
- Paulding County · 134,013 people
- City population
- 71,626
- Metro
- Atlanta-Sandy Springs-Alpharetta, GA
- Population (ZIP)
- 27,220
- Household income
- $86,824
- Rent vs Own
- Severe rent burden
- 498.0
Population outlook (Paulding County) Hauer SSP2
- Today (2025)
- 175,714 people
- By 2030
- 186,082 · +5.9%
- By 2040
- 204,414 · +16.3%
- By 2050
- 217,040 · +23.5%
- By 2075
- 236,980 · +34.9%
- By 2100
- 238,314 · +35.6%
Race, ethnicity, and origin ACS 2023
- Neighborhood character
- Diverse neighborhood (Simpson 0.61)
- Race & ethnicity
- White 52% Black 33% Two or more races 9% Hispanic / Latino 8% Asian 1%
- Hispanic origin (detail)
- Mexican 4%
- Common ancestry
- Slovak 3% Lithuanian 2% Iranian 2%
- Foreign-born
- 10% · Canada
- Languages at home
- 89% English-only · Spanish 7% Other Indo-European 1%
Political lean MEDSL · Paulding
- 2024 margin
- Strong R (+24.1) · D 37.6% · R 61.7%
- 2008→2024 swing
- +14.4pp toward D · 2008: -38.5pp · 2024: -24.1pp
- All cycles
- 2024: R+24.1 2020: R+29.1 2016: R+41.2 2012: R+43.6 2008: R+38.5
Not yet ingested
- Civics
- —
Market trends
- HPI YoY
- ▼ -41.28%
- Current HPI
- 197.6767
- Rent YoY
- ▲ 2.90%
- Metro
- Atlanta-Sandy Springs-Alpharetta, GA
- State GDP YoY
- ▲ 2.66%
- F500 in state
- 28
Industry mix (Fortune 500 HQ in GA)
| Industry | F500 HQs | Revenue |
|---|---|---|
| Paper / Packaging | 2 | $29B |
|
||
| Retail | 1 | $160B |
|
||
| Transportation / Logistics | 1 | $91B |
|
||
| Airlines | 1 | $62B |
|
||
| Consumer Goods | 1 | $47B |
|
||
| Utilities | 1 | $25B |
|
||
Price history
+181.9% since first listed20 events — show timeline
- 2026-05-04 Listing Removed — GAMLS
- 2026-05-04 Listing Removed — FMLS
- 2026-03-16 Relisted — GAMLS
- 2026-03-16 Relisted — FMLS
- 2026-03-15 Listing Removed — GAMLS
- 2026-03-15 Listing Removed — FMLS
- 2026-02-08 Price Changed $210,000 FMLS
- 2026-02-08 Price Changed $210,000 GAMLS
- 2026-01-04 Listed $230,000 GAMLS
- 2026-01-04 Listed $230,000 FMLS
- 2019-05-21 Sold (Public Records) $125,000 Public Records
- 2019-05-17 Sold (MLS) $125,000 GAMLS
- 2019-05-17 Sold (MLS) $125,000 FMLS
- 2019-04-20 Pending — GAMLS
- 2019-04-20 Pending — FMLS
- 2019-04-12 Price Changed $122,900 GAMLS
- 2019-04-11 Price Changed $122,900 FMLS
- 2019-02-18 Listed $139,900 GAMLS
- 2019-02-18 Listed $139,900 FMLS
- 1999-07-09 Sold (Public Records) $74,500 Public Records
Property tax history
+5.3%/yrLatest (2025): $2,434 · +0.4% YoY. Source: county tax records.
Cash-flow waterfall
monthlySold comps — $/sqft
last 12 mo · ≤1 miLoading sold comps…