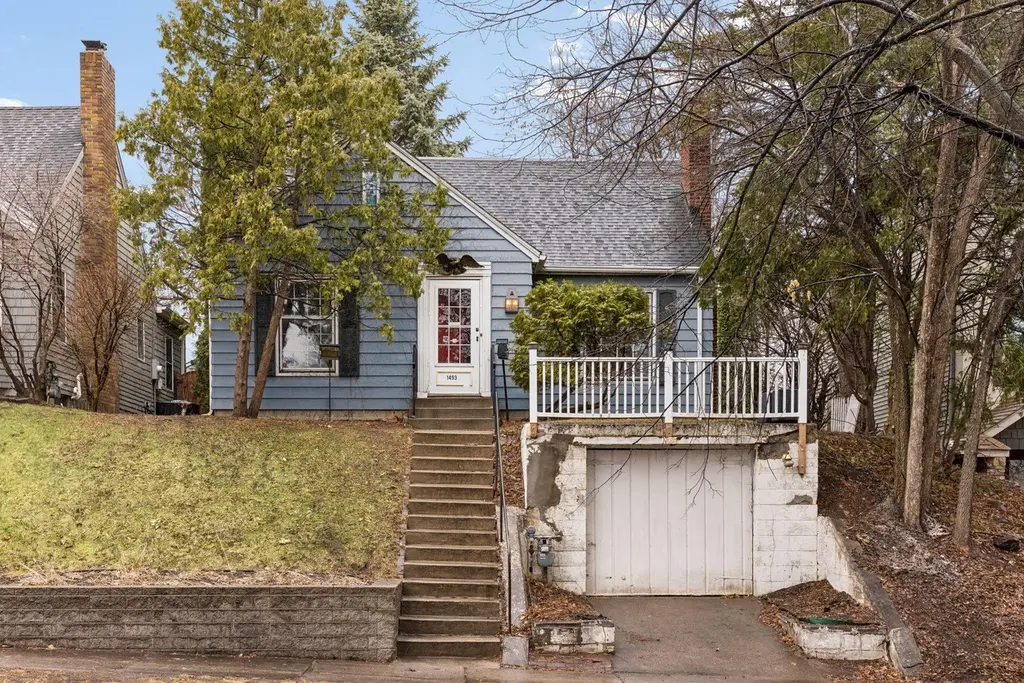
1493 Eleanor Ave · St. Paul, MN
Flood risk 1/10 · Minimal
- FEMA flood zone
- X (unshaded)
- Chance of flooding over 30 yrs
- 0.0%
- Est. flood insurance / yr
- $473 – $860
Fire risk 1/10 · Minimal
- Est. fire insurance / yr
- $888 – $1,650
Heat risk 2/10 · Minimal
- Hot days now (above 99°F)
- 7 days/yr
- Hot days in 30 yrs
- 14 days/yr
Wind risk 2/10 · Minimal
- Chance of severe wind over 30 yrs
- —
Air-quality risk 2/10 · Minimal
- Unhealthy air days now
- 1 days/yr
- Unhealthy air days in 30 yrs
- 2 days/yr
Risk factors via First Street. Map © Google.
Why this score? — see what drove the C- grade
The composite is a weighted blend of 9 inputs, each scored 0–100. Each bar is that input's sub-score; the figure is the points it added to the 100-point composite (weight × sub-score).
- Cash flow +20.8/30.0
- ARV discount +7.5/15.0
- DSCR +6.6/10.0
- 1% rule +5.6/10.0
- Rent growth +3.2/5.0
- Livability +2.5/5.0
- Condition / age +2.5/5.0
- Schools +2.4/10.0
- Appreciation +0.0/10.0
$315,000
🖨 Deal sheet 📄 Offer letter ✓ Due diligence
Listing remarks
* Offer Received, highest and best due by April 11th at 5pm * Charming 3-bedroom, 1-bath home located in the highly desirable Highland neighborhood, just minutes from variety restaurants, shops, walking paths, Highland Golf Course, and offering convenient access to 35E, Highway 5, and the airport. This well loved home has been lovingly cared for by the same owner for over 40 years and features a new roof in 2025.The location also offers access to a variety of school options, including Highland Elementary, Highland Middle School, Highland High School, St. Paul School of Northern Lights Charter School, and several additional nearby private school options. Step inside through the front entr
Key facts
- 5,749 sq ft lot
- Garage
- Built 1947
Property features AI
Exterior
- Parking: Attached tuck-under garage (1 garage space)
- Utilities: City water connected; City sewer connected; Natural gas
- Home design: Residential property; One-and-a-half story; Main and upper living levels
- Construction: Foundation area approximately 670; Roof age 8 years or less
- Exterior features: City-maintained streets with curbs, paved streets and sidewalks; Lot dimensions approximately 45 x 124
Interior
- Kitchen: Refrigerator
- Bedrooms: 3 bedrooms (two on main level, one upper-level bedroom); Upper-level loft (17 x 17)
- Flooring: Hardwood floors
- Bathrooms: Main floor full bathroom
- Heating & cooling: Forced air heating; Central air conditioning
- Interior features: Hardwood floors; Kitchen window; Separate/formal dining room; Basement with block construction
- Laundry & utility: Laundry on lower level
Neighborhood map
What this means for you Summary
Snapshot
- This is a 3-bed/1.0-bath single-family listed at $315k.
Deal economics
- At list price, monthly cash flow is $430 ($5k/yr) — positive.
- The deal already cash-flows at list — no discount required.
- Meets the 1% rule at list price ($3k rent vs $315k).
Location & tenants
- Location reads: area grade C — affects rentability + tenant quality, not the cash-flow math above.
- St. Paul Public School District (urban): math 21% / reading 33% proficiency, ranked #270 of 301 in MN (top 90%) — low school quality limits family demand, transient renter base, plan for 1-2y turnover; 64% free/reduced lunch — lower-income household profile, screen leases tightly.
- Market conditions: Rents rising (+2.6%/yr); 122 active listings in the ZIP; 3 comparable units currently listed for rent nearby; rentals leasing fast (median 2d on market — plan ~1-2 weeks tenant-placement turnaround); solid renter incomes; 1,202 units permitted in Ramsey County in 2024 (880 in 5+ unit buildings).
- At $3,348/mo this rent would consume 50% of the median local household income ($81k/yr) (locally 1609% of renters already pay >50% of income on rent) — very limited rent-growth headroom before tenants either downsize or default.
Forward outlook
- Local home prices are declining (-3.0%/yr); year-one equity from $2k of loan paydown is wiped out by about $9k of value loss. Plan a longer hold.
- Ramsey County population projected at +27% by 2050 — long-run rental-demand tailwind backs the buy-and-hold thesis.
Negotiation context
- Only 3 days on market — expect competitive offers; lowballing is unlikely to land.
Risks & watch-outs
- Watch-outs: built in 1947 — expect roof / HVAC / electrical / plumbing capex.
Questions for the listing agent
- Built in 1947 — when were the roof, HVAC, electrical panel, plumbing, and water heater last replaced?
- Is there a deadline driving the sale (1031 exchange, divorce, estate, relocation)? That informs how much negotiation room exists.
- What's the average days-on-market for RENTAL listings here right now (not sales)? A rising rental-DOM trend means longer vacancies and softer asking-rent achievability than the comps imply.
- What's the recent tenant-quality profile in this submarket — average credit score on applications, eviction rate, late-payment / NSF rate, and stable-employment percentage? A property-management company in the area should have these aggregated.
- How much new for-sale + rental construction is in the pipeline within 1–3 miles? Heavy new supply typically softens prices + rents 12–24 months out; constrained supply supports both.
Investment metrics
- 1% rule
- 1.06% ✓
- Cap rate
- 7.93%
- Cash-on-cash
- 5.85%
- DSCR
- 1.26
- GRM
- 7.8
CMA / ARV
No comps found within radius.
Projected returns pro-forma
-3.0% appreciation · 2.62% rent growth · sell at horizon
- IRR
- -7.7%
- Equity multiple
- 0.72×
- Total profit
- $-24,872
- Equity at exit
- $46,968
- IRR
- 1.4%
- Equity multiple
- 1.10×
- Total profit
- $8,696
- Equity at exit
- $27,235
Cash invested: $88,200 (down + closing). Projections, not guarantees.
Landlord ↔ Tenant lean methodology
- Overall (STATE)
- 46 Balanced
- State Minnesota
- 46 Balanced · D+2
- County
- — inherits STATE
- City
- — inherits STATE
ZIP-level market 55116
- Rents YoY
- 2.6%
- Active inventory
- 122
- Price-to-rent
- 7.8×
Monthly cashflow live
- Estimated rent
- $3,348 medium interval (Pro) →
- Mortgage (P&I)
- −$1,652
- Tax from tax record
- −$432 /mo · $5,184/yr
- Insurance
- −$131
- HOA
- −$0
- Vacancy / Maint / Mgmt
- −$703
- Net cashflow
- $430
Break-even live
UW: 25.0% down · 7.5% · 30yr · 1.5% tax · 5.0% vac · 8.0% maint · 8.0% mgmt
Financing live
Cash to close
- Down payment
- $78,750
- Closing costs
- $9,450
- Reserves months
- —
- Total cash needed
- —
Loan-product check · same deal, 3 products live
Conventional
25% down · 7.5% · 30yr
- Down + closing
- —
- Monthly P&I
- —
- Monthly cashflow
- —
- DSCR
- —
- Eligible?
- —
Personal DTI + credit; lowest rate.
DSCR
20% down · 8.5% · 30yr
- Down + closing
- —
- Monthly P&I
- —
- Monthly cashflow
- —
- DSCR
- —
- Eligible?
- —
No personal income docs; deal must DSCR.
Hard money
10% down · 12.0% · 12mo
- Down + closing
- —
- Monthly P&I
- —
- Monthly cashflow
- —
- DSCR
- —
- Eligible?
- —
Short-term bridge; refi at stabilization.
Rent comps 3 comps
| Address | Beds | Baths | Sqft | Rent | $/sqft | DOM | Units | Dist |
|---|---|---|---|---|---|---|---|---|
| 470 Lexington Pkwy S Saint Paul, MN | 2.0 | 1.0–2.0 | 1175 | $3,500 | $2.98 | 2d | 19 | 0.95mi |
| 740 Victoria St S Saint Paul, MN | 3.0 | 1.0–2.0 | 1076 | $3,746 | $3.48 | 2d | 39 | 1.39mi |
| 800 Cretin Ave S Saint Paul, MN | 2.0 | 1.0–2.0 | 970 | $4,810 | $4.96 | 2d | 19 | 1.46mi |
Listing history 4 events
-
2026-04-27status Pending
-
2026-04-11status Pending
-
2026-04-09$315,000 Active
-
2026-04-06historical $315,000
ⓘ Source: listings_history table (triggers on properties + properties_extension) + one-shot
backfill from property_details.listing_events for pre-trigger history.
Tax reassessment forecast MN · Partial reset (capped growth)
- Current annual tax
- $5,184 · $432/mo
- Projected year-2 tax
- $5,184 · $432/mo
- Expected delta
- $0/yr ($0/mo · 0.0%)
ⓘ Screening estimate from a state-policy table — verify with the county assessor before closing.
Climate risk First Street
- Flood 1/10 Low FEMA zone X (unshaded) · 0% chance over 30 yrs
- Wildfire 1/10 Low
- Heat 2/10 Low 7 d/yr ≥99°F today · 14 d/yr by 30 yrs out
- Wind 2/10 Low
- Air quality 2/10 Low 1 unhealthy d/yr today · 2 by 30 yrs out
Nearby sold comps map
Loading sold comps map…
Walkable amenities ~0.75 mi
Loading nearby amenities…
Taxation est. · year 1
- Rental income
- $40,176
- − Mortgage interest
- −$17,645
- − Property taxes
- −$5,184
- − Insurance
- −$1,575
- − Repairs & maintenance
- −$3,214
- − Management
- −$3,214
- − Depreciation
- −$9,164
- Taxable income
- $180
- Est. tax owed @ 24.0%
- −$43
- After-tax cash flow
- $5,114/yr
For passive investors: Depreciation is non-cash, so a rental often shows a tax loss while cash-flowing — sheltering income. Rental losses are passive: they offset passive income freely, and up to $25,000/yr can offset ordinary (W-2) income if you actively participate and your MAGI is under $100k (phasing out to $0 by $150k); unused losses carry forward. On sale, claimed depreciation is recaptured at up to 25%, and gains may owe capital-gains tax (a 1031 exchange can defer both). Figures are a year-1 estimate at your 24.0% rate — not tax advice; consult a CPA.
Schools (NCES district)
- District
- St. Paul Public School District
- NCES district ID
- 2733840
- Math proficiency
- 21% ▼ -11.00%
- Reading proficiency
- 33% ▼ -7.00%
- Median HH income
- $48,316
- Composite
- 23.51/100
- National rank
- #7868
- State rank
- #270 of 301 in MN
Livability — St. Paul
No livability data for this city. (Only ~50 U.S. cities are tracked.)
Census & demographics
- Census place
- St. Paul, MN
- County
- Ramsey County · 542,837 people
- City population
- 280,599
- Metro
- Minneapolis-St. Paul-Bloomington, MN-WI
- Population (ZIP)
- 25,918
- Household income
- $81,141
- Rent vs Own
- Severe rent burden
- 1609.0
Population outlook (Ramsey County) Hauer SSP2
- Today (2025)
- 603,431 people
- By 2030
- 636,459 · +5.5%
- By 2040
- 700,596 · +16.1%
- By 2050
- 765,819 · +26.9%
- By 2075
- 929,297 · +54.0%
- By 2100
- 1,053,924 · +74.7%
Race, ethnicity, and origin ACS 2023
- Neighborhood character
- Predominantly White (73%)
- Race & ethnicity
- White 73% Black 13% Two or more races 7% Hispanic / Latino 4% Asian 4%
- Common ancestry
- Portuguese 11% Lithuanian 4% Romanian 3%
- Foreign-born
- 15% · Canada, South Korea, China
- Languages at home
- 83% English-only · Spanish 3% Russian/Polish/Slavic 1% Chinese 1%
Political lean MEDSL · Ramsey
- 2024 margin
- Solid D (+43.3) · D 70.5% · R 27.2% · Other 2.3%
- 2008→2024 swing
- +9.4pp toward D · 2008: 33.9pp · 2024: 43.3pp
- All cycles
- 2024: D+43.3 2020: D+45.4 2016: D+39.4 2012: D+35.3 2008: D+33.9
Not yet ingested
- Civics
- —
Market trends
- HPI YoY
- ▼ -451.66%
- Current HPI
- 230.3529
- Rent YoY
- ▲ 2.62%
- Metro
- Minneapolis-St. Paul-Bloomington, MN-WI
- State GDP YoY
- ▲ 2.41%
- F500 in state
- 34
Industry mix (Fortune 500 HQ in MN)
| Industry | F500 HQs | Revenue |
|---|---|---|
| Healthcare | 2 | $407B |
|
||
| Retail | 2 | $150B |
|
||
| Consumer Goods | 2 | $32B |
|
||
| Industrial Machinery | 2 | $6B |
|
||
| Agriculture | 1 | $40B |
|
||
| Healthcare / Medical Devices | 1 | $32B |
|
||
Price history
+0.0% since first listed4 events — show timeline
- 2026-04-27 Pending — NORTHSTARMLS as Distributed by MLS Grid
- 2026-04-11 Pending — NORTHSTARMLS as Distributed by MLS Grid
- 2026-04-09 Listed $315,000 NORTHSTARMLS as Distributed by MLS Grid
- 2026-04-06 Coming Soon $315,000 NORTHSTARMLS as Distributed by MLS Grid
Property tax history
+1.2%/yrLatest (2025): $5,184 · +10.1% YoY. Source: county tax records.
Cash-flow waterfall
monthlySold comps — $/sqft
last 12 mo · ≤1 miLoading sold comps…