6210 Magnolia Dr · Laurel Lake, NJ
Flood risk 1/10 · Minimal
- FEMA flood zone
- X (unshaded)
- Chance of flooding over 30 yrs
- 0.0%
- Est. flood insurance / yr
- $507 – $1,088
Fire risk 4/10 · Minor
- Est. fire insurance / yr
- $526 – $976
Heat risk 7/10 · Major
- Hot days now (above 102°F)
- 7 days/yr
- Hot days in 30 yrs
- 15 days/yr
Wind risk 8/10 · Major
- Chance of severe wind over 30 yrs
- 80.0%
Air-quality risk 3/10 · Minor
- Unhealthy air days now
- 3 days/yr
- Unhealthy air days in 30 yrs
- 5 days/yr
Risk factors via First Street. Map © Google.
Why this score? — see what drove the B grade
The composite is a weighted blend of 9 inputs, each scored 0–100. Each bar is that input's sub-score; the figure is the points it added to the 100-point composite (weight × sub-score).
- Cash flow +30.0/30.0
- ARV discount +15.0/15.0
- DSCR +10.0/10.0
- 1% rule +9.9/10.0
- Rent growth +3.0/5.0
- Livability +2.8/5.0
- Condition / age +2.5/5.0
- Schools +1.5/10.0
- Appreciation +0.0/10.0
$145,000
🖨 Deal sheet (PDF) 📄 Offer letter ✓ Due diligence
Listing remarks MLS
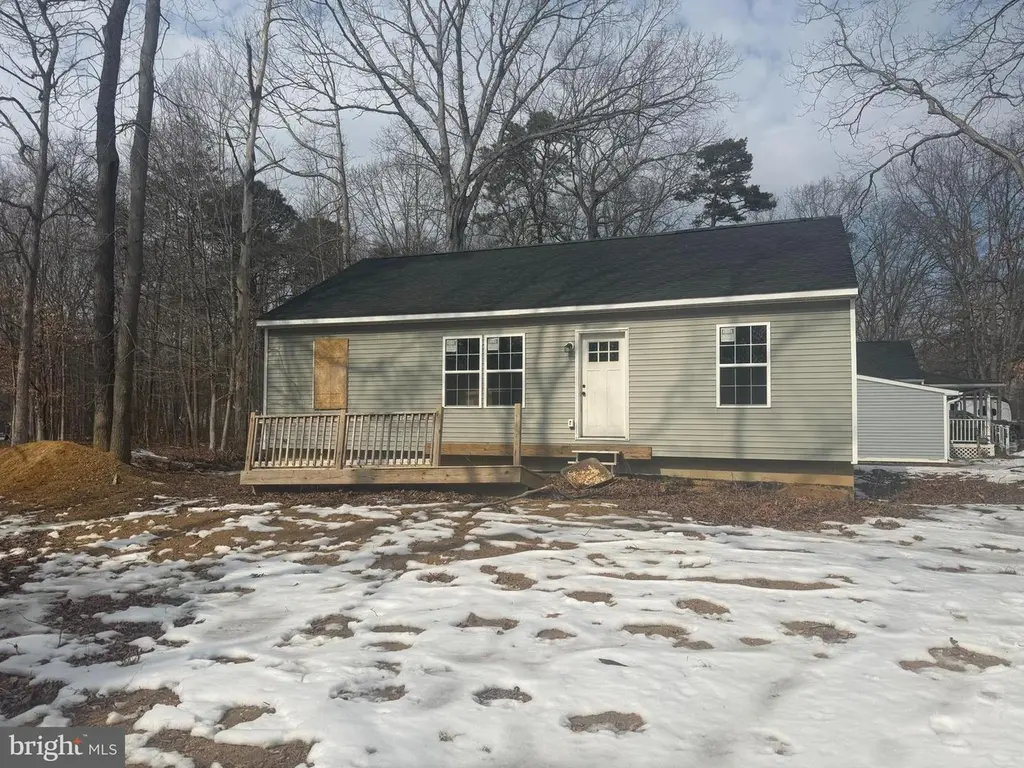
Here is your opportunity to finish this home and be the first to live in it. Home is 90% complete but will need to be moved to meet the zoning requirements. Buyer should check with Commercial Township to confirm what the Township will require. No Septic or Well has been installed yet and the Buyer will be responsible to apply for permits and have an engineer prepare the septic design. Seller is unable to complete the required work and property is being sold as is in the shape and condition as it sits. Currently unable to access the interior of the property.
Key facts
- 0.23 acre lot
- Listed 119 days
Neighborhood map
What this means for you Summary
Snapshot
- This is a 3-bed/2.0-bath land listed at $145k.
Deal economics
- At list price, monthly cash flow is $855 ($10k/yr) — positive.
- The deal already cash-flows at list — no discount required.
- Meets the 1% rule at list price ($2k rent vs $145k).
- Recommended offer: $132k (9.0% below list) — sets the bar for market timing.
- Cap rate 13.4% vs local median 7.3% in Laurel Lake — top-decile yield for the area; either an underpriced asset or a hidden risk that comps aren't pricing in. Stress-test before assuming the spread holds.
Location & tenants
- Location reads 56/100 on livability (#521 in NJ) — a working-class tenant base; expect higher turnover. Strengths: crime A+, housing A+, cost of living B; Watch: schools F, amenities F, commute F.
- Commercial Township School District (rural): math 5% / reading 29% proficiency, ranked #449 of 472 in NJ (top 95%) — low school quality limits family demand, transient renter base, plan for 1-2y turnover; 65% free/reduced lunch — lower-income household profile, screen leases tightly.
- Market conditions: Rents rising (+1.9%/yr); 296 active listings in the ZIP; 3 comparable units currently listed for rent nearby; rentals lingering (median 45d on market — plan ~5-8 weeks vacancy on turnover, expect pricing pressure); 100% of comp listings sitting > 30 days — soft ceiling on asking rent; 216 units permitted in Cumberland County in 2024 (73 in 5+ unit buildings).
- This rent runs 38% of the median local income ($67k/yr) — at the standard rent-burdened threshold; future hikes will face affordability resistance.
Forward outlook
- Local home prices are declining (-3.0%/yr); year-one equity from $1k of loan paydown is wiped out by about $4k of value loss. Plan a longer hold.
- Cumberland County population projected to shrink 7% by 2050 — rents likely to lag national; underwrite the cash flow, not the appreciation.
- At projected returns (-3.0% appreciation + 1.9% rent growth), your $41k cash investment doubles in ~6 years — after that, you're playing with house money.
Negotiation context
- It's been on market 120 days — a 9% lower offer ($132k) is reasonable based on typical stale-listing flexibility.
- 7 sale attempts since 16y ago with the ask held roughly flat each time — persistent listings suggest the price (not the market) is what's stuck; bring a comps-based counter.
- Current owner paid $6k; list at $145k implies a 2317% gain — meaningful room to come down on a strong offer.
Risks & watch-outs
- Climate carrying-cost: severe wind risk, 80% chance of damaging wind over 30y; extreme-heat days projected 7→15/yr by 2055 (HVAC capex compounding) — expect insurance premiums to compound above CPI over the hold.
Questions for the listing agent
- It's been on market 120 days. Have you received any prior offers? Is the seller open to a 9% concession, seller financing, or rate buy-down credit?
- What does the HOA fee cover, when was the last increase, and are there any pending special assessments or reserve-fund shortfalls?
- Why hasn't it sold? Are there any deal-killer items the seller is aware of (foundation, flood, title, zoning, code violations)?
- Is there a deadline driving the sale (1031 exchange, divorce, estate, relocation)? That informs how much negotiation room exists.
- Schools are F-rated, which usually means shorter tenancies and higher turnover. Who's the typical renter profile here, and what's been the actual vacancy rate?
- What's the average days-on-market for RENTAL listings here right now (not sales)? A rising rental-DOM trend means longer vacancies and softer asking-rent achievability than the comps imply.
- What's the recent tenant-quality profile in this submarket — average credit score on applications, eviction rate, late-payment / NSF rate, and stable-employment percentage? A property-management company in the area should have these aggregated.
- How much new for-sale + rental construction is in the pipeline within 1–3 miles? Heavy new supply typically softens prices + rents 12–24 months out; constrained supply supports both.
Investment metrics
- 1% rule
- 1.49% ✓
- Cap rate
- 13.37%
- Cash-on-cash
- 25.28%
- DSCR
- 2.12
- GRM
- 5.6
CMA / ARV
- ARV (median comp)
- $196,845
- List price
- $145,000
- Delta
- -26.34%
- Verdict
- UNDERPRICED
- Comps
- 20 within 1.0 mi
Projected returns pro-forma
-3.0% appreciation · 1.94% rent growth · sell at horizon
- IRR
- 17.7%
- Equity multiple
- 1.71×
- Total profit
- $28,635
- Equity at exit
- $21,620
- IRR
- 25.4%
- Equity multiple
- 3.11×
- Total profit
- $85,673
- Equity at exit
- $12,537
Cash invested: $40,600 (down + closing). Projections, not guarantees.
Landlord ↔ Tenant lean methodology
- Overall (STATE)
- 21 Tenant-Leaning
- State New Jersey
- 21 Tenant-Leaning · D+6
- County
- — inherits STATE
- City
- — inherits STATE
ZIP-level market 08332
- Home prices YoY
- -28.9%
- Rents YoY
- 1.9%
- Active inventory
- 296
- Price-to-rent
- 5.6×
Monthly cashflow live
- Estimated rent
- $2,161 medium interval (Pro) →
- Mortgage (P&I)
- −$760
- Tax from tax record
- −$27 /mo · $324/yr
- Insurance
- −$60
- HOA
- −$4
- Vacancy / Maint / Mgmt
- −$454
- Net cashflow
- $855
Break-even live
Sensitivity live
| Price | -10% $937 | -5% $896 | +0% $855 | +5% $814 | +10% $773 |
|---|---|---|---|---|---|
| Rent | -10% $685 | -5% $770 | +0% $855 | +5% $941 | +10% $1,026 |
| Rate | -1.0pp $928 | -0.5pp $892 | base $855 | +0.5pp $818 | +1.0pp $779 |
UW: 25.0% down · 7.5% · 30yr · 1.5% tax · 5.0% vac · 8.0% maint · 8.0% mgmt
Financing live
Cash to close
- Down payment
- $36,250
- Closing costs
- $4,350
- Reserves months
- —
- Total cash needed
- —
Loan-product check · same deal, 3 products live
Conventional
25% down · 7.5% · 30yr
- Down + closing
- —
- Monthly P&I
- —
- Monthly cashflow
- —
- DSCR
- —
- Eligible?
- —
Personal DTI + credit; lowest rate.
DSCR
20% down · 8.5% · 30yr
- Down + closing
- —
- Monthly P&I
- —
- Monthly cashflow
- —
- DSCR
- —
- Eligible?
- —
No personal income docs; deal must DSCR.
Hard money
10% down · 12.0% · 12mo
- Down + closing
- —
- Monthly P&I
- —
- Monthly cashflow
- —
- DSCR
- —
- Eligible?
- —
Short-term bridge; refi at stabilization.
Rent comps 3 comps
| Address | Beds | Baths | Sqft | Rent | $/sqft | DOM | Units | Dist |
|---|---|---|---|---|---|---|---|---|
| 136 Robin Rd Millville, NJ | 4.0 | 1.0 | 1308 | $2,500 | $1.91 | 44d | 1 | 0.31mi |
| 32 Rosewood Rd Millville, NJ | 3.0 | 1.0 | 1340 | $2,200 | $1.64 | 44d | 1 | 0.72mi |
| 7357 William Ave Millville, NJ | 2.0 | 1.0 | 938 | $1,550 | $1.65 | 44d | 1 | 1.08mi |
HOA detail
- Monthly dues
- $4 · $48/yr
Listing history 33 events
-
2026-06-19days on market $145,000 Active 120 DOM
-
2026-06-18days on market $145,000 Active 119 DOM
-
2026-06-17days on market $145,000 Active 118 DOM
-
2026-06-16days on market $145,000 Active 117 DOM
-
2026-06-15days on market $145,000 Active 116 DOM
-
2026-06-14days on market $145,000 Active 114 DOM
-
2026-06-13days on market $145,000 Active 113 DOM
-
2026-06-10days on market $145,000 Active 111 DOM
-
2026-06-09days on market $145,000 Active 110 DOM
-
2026-06-08days on market $145,000 Active 109 DOM
-
2026-06-07days on market $145,000 Active 108 DOM
-
2026-06-02days on market $145,000 Active 103 DOM
-
2026-06-01days on market $145,000 Active 102 DOM
-
2026-05-31days on market $145,000 Active 101 DOM
-
2026-05-30days on market $145,000 Active 100 DOM
-
2026-02-19$145,000 Active 563-char remark
Show marketing remark (563 chars)
Here is your opportunity to finish this home and be the first to live in it. Home is 90% complete but will need to be moved to meet the zoning requirements. Buyer should check with Commercial Township to confirm what the Township will require. No Septic or Well has been installed yet and the Buyer will be responsible to apply for permits and have an engineer prepare the septic design. Seller is unable to complete the required work and property is being sold as is in the shape and condition as it sits. Currently unable to access the interior of the property.
-
2023-07-30status Pending
-
2023-07-30historical
-
2023-07-22status Active
-
2023-02-10historical
-
2022-10-27price $229,000
-
2022-09-06$239,000 Active
-
2021-11-19soldstatus $6,000
-
2021-06-25soldstatus $6,000 Closed
-
2021-05-26status Pending
-
2021-04-16price $9,000
-
2020-09-20$10,000 Active
-
2019-03-01historical
-
2018-05-03$7,500 Active
-
2011-08-17historical
-
2010-11-17historical
-
2010-08-16$20,000
-
2010-05-01$20,000
ⓘ Source: listings_history table (triggers on properties + properties_extension) + one-shot
backfill from property_details.listing_events for pre-trigger history.
Tax reassessment forecast NJ · Partial reset (capped growth)
- Current annual tax
- $324 · $27/mo
- Projected year-2 tax
- $1,967 · $164/mo
- Expected delta
- +$1,643/yr (+$137/mo · 507.6%)
ⓘ Screening estimate from a state-policy table — verify with the county assessor before closing.
Climate risk First Street
- Flood 1/10 Low FEMA zone X (unshaded) · 0% chance over 30 yrs
- Wildfire 4/10 Moderate
- Heat 7/10 Severe 7 d/yr ≥102°F today · 15 d/yr by 30 yrs out
- Wind 8/10 Severe 80% chance of damaging wind over 30 yrs
- Air quality 3/10 Moderate 3 unhealthy d/yr today · 5 by 30 yrs out
Nearby sold comps map
Loading sold comps map…
Walkable amenities ~0.75 mi
Loading nearby amenities…
Taxation est. · year 1
- Rental income
- $25,930
- − Mortgage interest
- −$8,122
- − Property taxes
- −$324
- − Insurance
- −$725
- − Repairs & maintenance
- −$2,074
- − Management
- −$2,074
- − HOA
- −$48
- − Depreciation
- −$4,218
- Taxable income
- $8,344
- Est. tax owed @ 24.0%
- −$2,003
- After-tax cash flow
- $8,261/yr
For passive investors: Depreciation is non-cash, so a rental often shows a tax loss while cash-flowing — sheltering income. Rental losses are passive: they offset passive income freely, and up to $25,000/yr can offset ordinary (W-2) income if you actively participate and your MAGI is under $100k (phasing out to $0 by $150k); unused losses carry forward. On sale, claimed depreciation is recaptured at up to 25%, and gains may owe capital-gains tax (a 1031 exchange can defer both). Figures are a year-1 estimate at your 24.0% rate — not tax advice; consult a CPA.
Schools (NCES district)
- District
- Commercial Township School District
- NCES district ID
- 3403480
- Math proficiency
- 5% ▼ -7.00%
- Reading proficiency
- 29% ▲ 10.00%
- Median HH income
- $45,143
- Composite
- 14.86/100
- National rank
- #9378
- State rank
- #449 of 472 in NJ
Livability — Laurel Lake
- Score
- 56/100
- State rank
- #521
- US rank
- #22397
Category grades
Schools grade is shown separately in the Schools card above.
Census & demographics
- Census place
- Laurel Lake, NJ
- County
- Cumberland County · 80,266 people
- Metro
- Vineland-Bridgeton, NJ
- Population (ZIP)
- 35,228
- Household income
- $67,496
- Rent vs Own
- Severe rent burden
- 1761.0
Population outlook (Cumberland County) Hauer SSP2
- Today (2025)
- 152,743 people
- By 2030
- 150,373 · -1.6%
- By 2040
- 146,881 · -3.8%
- By 2050
- 142,653 · -6.6%
- By 2075
- 129,468 · -15.2%
- By 2100
- 107,456 · -29.6%
Race, ethnicity, and origin ACS 2023
- Neighborhood character
- Diverse neighborhood (Simpson 0.60)
- Race & ethnicity
- White 59% Hispanic / Latino 17% Black 15% Two or more races 11% Asian 2%
- Hispanic origin (detail)
- Mexican 4% Puerto Rican 10%
- Common ancestry
- Romanian 4% Lithuanian 2% Slovak 1%
- Foreign-born
- 7% · Canada
- Languages at home
- 85% English-only · Spanish 11% Other Indo-European 1% Other Asian/Pacific 1%
Political lean MEDSL · Cumberland
- 2024 margin
- Toss-up / Even · D 47.6% · R 51.3% · Other 1.1%
- 2008→2024 swing
- -25.4pp toward R · 2008: 21.6pp · 2024: -3.8pp
- All cycles
- 2024: R+3.8 2020: D+6.0 2016: D+5.3 2012: D+23.1 2008: D+21.6
Not yet ingested
- Civics
- —
Market trends
- HPI YoY
- ▼ -111.45%
- Current HPI
- 274.8011
- Rent YoY
- ▲ 1.94%
- Metro
- Vineland-Bridgeton, NJ
- State GDP YoY
- ▲ 2.05%
- F500 in state
- 34
Industry mix (Fortune 500 HQ in NJ)
| Industry | F500 HQs | Revenue |
|---|---|---|
| Consumer Goods | 3 | $31B |
|
||
| Pharmaceuticals | 2 | $153B |
|
||
| Technology | 2 | $21B |
|
||
| Insurance | 2 | $20B |
|
||
| Healthcare | 2 | $19B |
|
||
| Financial Services | 1 | $70B |
|
||
Price history
+625.0% since first listed18 events — show timeline
- 2026-02-19 Listed $145,000 BRIGHT MLS
- 2023-07-30 Pending — BRIGHT MLS
- 2023-07-30 Listing Removed — BRIGHT MLS
- 2023-07-22 Relisted — BRIGHT MLS
- 2023-02-10 Listing Removed — BRIGHT MLS
- 2022-10-27 Price Changed $229,000 BRIGHT MLS
- 2022-09-06 Listed $239,000 BRIGHT MLS
- 2021-11-19 Sold (Public Records) $6,000 Public Records
- 2021-06-25 Sold (MLS) $6,000 BRIGHT MLS
- 2021-05-26 Pending — BRIGHT MLS
- 2021-04-16 Price Changed $9,000 BRIGHT MLS
- 2020-09-20 Listed $10,000 BRIGHT MLS
- 2019-03-01 Listing Removed — BRIGHT MLS
- 2018-05-03 Listed $7,500 BRIGHT MLS
- 2011-08-17 Listing Removed — SJSRMLS
- 2010-11-17 Listing Removed — BRIGHT MLS
- 2010-08-16 Listed $20,000 SJSRMLS
- 2010-05-01 Listed $20,000 BRIGHT MLS
Property tax history
+2.8%/yrLatest (2025): $324 · +4.9% YoY. Source: county tax records.
Cash-flow waterfall
monthlySold comps — $/sqft
last 12 mo · ≤1 miLoading sold comps…