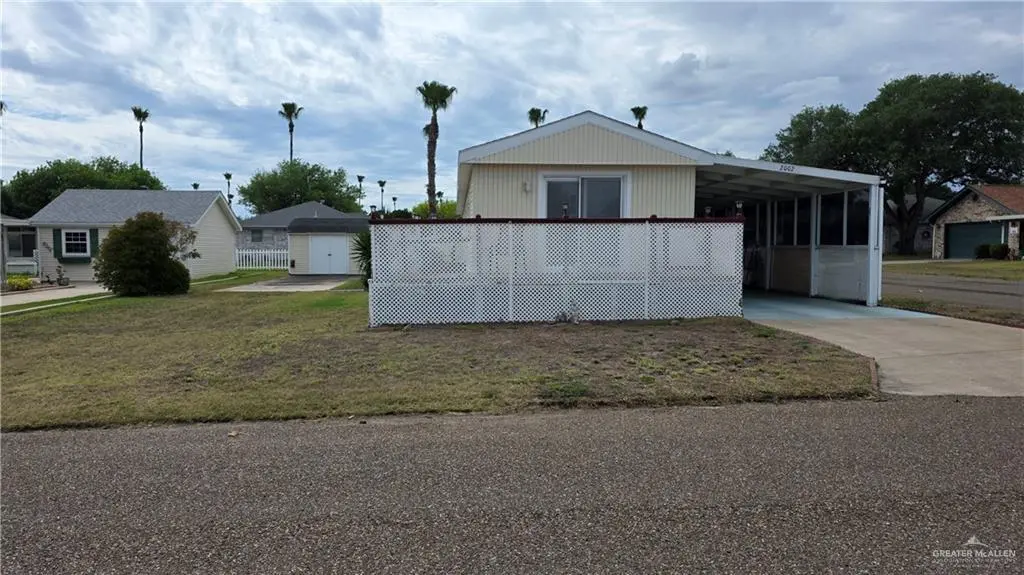
2002 Green Gate Cir N · Palmview, TX
Flood risk 1/10 · Minimal
- FEMA flood zone
- X
- Chance of flooding over 30 yrs
- 0.0%
- Est. flood insurance / yr
- $507 – $1,088
Fire risk 8/10 · Major
- Est. fire insurance / yr
- $1,222 – $2,270
Heat risk 9/10 · Severe
- Hot days now (above 112°F)
- 7 days/yr
- Hot days in 30 yrs
- 22 days/yr
Wind risk 8/10 · Major
- Chance of severe wind over 30 yrs
- 96.0%
Air-quality risk 1/10 · Minimal
- Unhealthy air days now
- 0 days/yr
- Unhealthy air days in 30 yrs
- 0 days/yr
Risk factors via First Street. Map © Google.
Why this score? — see what drove the C grade
The composite is a weighted blend of 9 inputs, each scored 0–100. Each bar is that input's sub-score; the figure is the points it added to the 100-point composite (weight × sub-score).
- Cash flow +22.6/30.0
- 1% rule +8.1/10.0
- ARV discount +7.5/15.0
- DSCR +7.2/10.0
- Livability +2.9/5.0
- Rent growth +2.7/5.0
- Condition / age +2.5/5.0
- Schools +1.9/10.0
- Appreciation +0.0/10.0
$92,500
🖨 Deal sheet 📄 Offer letter ✓ Due diligence
Listing remarks MLS
Price to sell in Green Gate Grove, a 55+ senior community offering an active lifestyle. This 1993 Schult manufactured home features 2 bedrooms and 2 full bathrooms across 1,024 square feet of living space. Being sold fully furnished, this home is truly move-in ready—ideal for seasonal or full-time living. The front-facing kitchen offers wonderful light and ventilation. Situated on a 4,944 sq ft lot & an additional 2,475 sq ft (lot and a half), the property provides flexibility, including space for RV parking. Recent updates include a roof replaced approximately three years ago and an HVAC system refurbished within the same timeframe. A wheelchair-accessible ramp provides easy entry and added convenience. Positioned on a desirable corner lot, the home offers extra privacy and curb appeal. A storage shed with electricity is also included—perfect for tools, hobbies, or additional storage. Enjoy the benefits of secure, gated community living with access to a variety of amenities.
Key facts
- Rv parking
- Front facing kitchen
- Move in ready
Tags
Neighborhood map
What this means for you Summary
Snapshot
- This is a 3-bed/2.0-bath manufactured listed at $92k.
Deal economics
- At list price, monthly cash flow is $157 ($2k/yr) — positive.
- The deal already cash-flows at list — no discount required.
- Meets the 1% rule at list price ($1k rent vs $92k).
- Recommended offer: $87k (6.0% below list) — sets the bar for market timing.
- Cap rate 8.3% vs local median 4.2% in Palmview — top-decile yield for the area; either an underpriced asset or a hidden risk that comps aren't pricing in. Stress-test before assuming the spread holds.
Location & tenants
- Location reads 57/100 on livability (#1,267 in TX) — a working-class tenant base; expect higher turnover. Strengths: cost of living A+, housing A; Watch: crime D, schools F, amenities F.
- La Joya ISD (suburban): math 18% / reading 29% proficiency, ranked #759 of 826 in TX (top 92%) — low school quality limits family demand, transient renter base, plan for 1-2y turnover.
- Market conditions: Rents flat; 852 active listings in the ZIP; 2 comparable units currently listed for rent nearby; 7,378 units permitted in Hidalgo County in 2024 (641 in 5+ unit buildings).
Forward outlook
- Local home prices are declining (-3.0%/yr); year-one equity from $640 of loan paydown is wiped out by about $3k of value loss. Plan a longer hold.
- Hidalgo County population projected at +28% by 2050 — long-run rental-demand tailwind backs the buy-and-hold thesis.
Negotiation context
- It's been on market 70 days — a 6% lower offer ($87k) is reasonable based on typical stale-listing flexibility.
Risks & watch-outs
- Climate carrying-cost: severe wind risk, 96% chance of damaging wind over 30y; severe wildfire risk; extreme-heat days projected 7→22/yr by 2055 (HVAC capex compounding) — expect insurance premiums to compound above CPI over the hold.
Questions for the listing agent
- It's been on market 70 days. Have you received any prior offers? Is the seller open to a 6% concession, seller financing, or rate buy-down credit?
- What does the HOA fee cover, when was the last increase, and are there any pending special assessments or reserve-fund shortfalls?
- Why hasn't it sold? Are there any deal-killer items the seller is aware of (foundation, flood, title, zoning, code violations)?
- Is there a deadline driving the sale (1031 exchange, divorce, estate, relocation)? That informs how much negotiation room exists.
- Schools are F-rated, which usually means shorter tenancies and higher turnover. Who's the typical renter profile here, and what's been the actual vacancy rate?
- Crime grade is D in this area — have there been break-ins, vandalism, or insurance claims at this property in the last 3 years? What carrier currently insures it and at what premium?
- What's the average days-on-market for RENTAL listings here right now (not sales)? A rising rental-DOM trend means longer vacancies and softer asking-rent achievability than the comps imply.
- What's the recent tenant-quality profile in this submarket — average credit score on applications, eviction rate, late-payment / NSF rate, and stable-employment percentage? A property-management company in the area should have these aggregated.
- How much new for-sale + rental construction is in the pipeline within 1–3 miles? Heavy new supply typically softens prices + rents 12–24 months out; constrained supply supports both.
Investment metrics
- 1% rule
- 1.31% ✓
- Cap rate
- 8.33%
- Cash-on-cash
- 7.27%
- DSCR
- 1.32
- GRM
- 6.3
CMA / ARV
- ARV (median comp)
- $61,635
- List price
- $92,500
- Delta
- 50.08%
- Verdict
- OVERPRICED
- Comps
- 2 within 1.0 mi
Show comp detail 2 sales within ~0.75 mi
| Address | Dist | Beds/Ba | Sqft | Sold | Price | $/sf | Match |
|---|---|---|---|---|---|---|---|
| 103 Lampshire Ln | 0.38mi | 2/2.0 (-1) | 938 (+5%) | 2mo | $49,900 | $53 | 68 |
| 2423 Bobolink Cir E #299 | 0.29mi | 2/1.5 (-1) | 800 (-11%) | 17mo | $99,750 | $125 | 48 |
Match score weights: distance 35% · size 25% · config 20% · recency 20%. Top-matched comps best support the ARV.
Projected returns pro-forma
-3.0% appreciation · 0.93% rent growth · sell at horizon
- IRR
- -7.9%
- Equity multiple
- 0.72×
- Total profit
- $-7,359
- Equity at exit
- $13,792
- IRR
- -1.8%
- Equity multiple
- 0.89×
- Total profit
- $-2,820
- Equity at exit
- $7,998
Cash invested: $25,900 (down + closing). Projections, not guarantees.
Landlord ↔ Tenant lean methodology
- Overall (STATE)
- 87 Strongly Landlord-Friendly
- State Texas
- 87 Strongly Landlord-Friendly · R+5
- County
- — inherits STATE
- City
- — inherits STATE
ZIP-level market 78572
- Home prices YoY
- -22.9%
- Rents YoY
- 0.9%
- Active inventory
- 852
- Price-to-rent
- 6.3×
Monthly cashflow live
- Estimated rent
- $1,215 medium interval (Pro) →
- Mortgage (P&I)
- −$485
- Tax from tax record
- −$164 /mo · $1,972/yr
- Insurance
- −$39
- HOA
- −$115
- Vacancy / Maint / Mgmt
- −$255
- Net cashflow
- $157
Break-even live
UW: 25.0% down · 7.5% · 30yr · 1.5% tax · 5.0% vac · 8.0% maint · 8.0% mgmt
Financing live
Cash to close
- Down payment
- $23,125
- Closing costs
- $2,775
- Reserves months
- —
- Total cash needed
- —
Loan-product check · same deal, 3 products live
Conventional
25% down · 7.5% · 30yr
- Down + closing
- —
- Monthly P&I
- —
- Monthly cashflow
- —
- DSCR
- —
- Eligible?
- —
Personal DTI + credit; lowest rate.
DSCR
20% down · 8.5% · 30yr
- Down + closing
- —
- Monthly P&I
- —
- Monthly cashflow
- —
- DSCR
- —
- Eligible?
- —
No personal income docs; deal must DSCR.
Hard money
10% down · 12.0% · 12mo
- Down + closing
- —
- Monthly P&I
- —
- Monthly cashflow
- —
- DSCR
- —
- Eligible?
- —
Short-term bridge; refi at stabilization.
Rent comps 2 comps
| Address | Beds | Baths | Sqft | Rent | $/sqft | DOM | Units | Dist |
|---|---|---|---|---|---|---|---|---|
| 4321 Royal Palm Dr Mission, TX | 2.0 | 1.0 | 572 | $800 | $1.40 | 23d | 1 | 0.77mi |
| 2508 U.S. 83 Business Unit 16 Mission, TX | 2.0 | 1.0 | 650 | $730 | $1.12 | 23d | 1 | 1.03mi |
HOA detail
- Monthly dues
- $115 · $1,380/yr
- Likely covers
- electricsecurity
Listing history 18 events
-
2026-06-18days on market $92,500 Active 70 DOM
-
2026-06-17days on market $92,500 Active 69 DOM
-
2026-06-16days on market $92,500 Active 68 DOM
-
2026-06-15days on market $92,500 Active 67 DOM
-
2026-06-14days on market $92,500 Active 65 DOM
-
2026-06-13days on market $92,500 Active 64 DOM
-
2026-06-10days on market $92,500 Active 62 DOM
-
2026-06-09days on market $92,500 Active 61 DOM
-
2026-06-08days on market $92,500 Active 60 DOM
-
2026-06-07days on market $92,500 Active 59 DOM
-
2026-06-05days on market $92,500 Active 56 DOM
-
2026-06-03days on market $92,500 Active 55 DOM
-
2026-06-02days on market $92,500 Active 54 DOM
-
2026-06-01days on market $92,500 Active 53 DOM
-
2026-05-31days on market $92,500 Active 52 DOM
-
2026-05-31days on market $92,500 Active 51 DOM
-
2026-04-09$92,500 Active 1012-char remark
Show marketing remark (1012 chars)
Price to sell in Green Gate Grove, a 55+ senior community offering an active lifestyle. This 1993 Schult manufactured home features 2 bedrooms and 2 full bathrooms across 1,024 square feet of living space. Being sold fully furnished, this home is truly move-in ready—ideal for seasonal or full-time living. The front-facing kitchen offers wonderful light and ventilation. Situated on a 4,944 sq ft lot & an additional 2,475 sq ft (lot and a half), the property provides flexibility, including space for RV parking. Recent updates include a roof replaced approximately three years ago and an HVAC system refurbished within the same timeframe. A wheelchair-accessible ramp provides easy entry and added convenience. Positioned on a desirable corner lot, the home offers extra privacy and curb appeal. A storage shed with electricity is also included—perfect for tools, hobbies, or additional storage. Enjoy the benefits of secure, gated community living with access to a variety of amenities.
-
1997-04-21soldstatus
ⓘ Source: listings_history table (triggers on properties + properties_extension) + one-shot
backfill from property_details.listing_events for pre-trigger history.
Tax reassessment forecast TX · Resets to sale price
- Current annual tax
- $1,972 · $164/mo
- Projected year-2 tax
- $1,972 · $164/mo
- Expected delta
- $0/yr ($0/mo · -0.0%)
ⓘ Screening estimate from a state-policy table — verify with the county assessor before closing.
Climate risk First Street
- Flood 1/10 Low FEMA zone X · 0% chance over 30 yrs
- Wildfire 8/10 Severe
- Heat 9/10 Extreme 7 d/yr ≥112°F today · 22 d/yr by 30 yrs out
- Wind 8/10 Severe 96% chance of damaging wind over 30 yrs
- Air quality 1/10 Low 0 unhealthy d/yr today · 0 by 30 yrs out
Nearby sold comps map
Loading sold comps map…
Walkable amenities ~0.75 mi
Loading nearby amenities…
Taxation est. · year 1
- Rental income
- $14,579
- − Mortgage interest
- −$5,181
- − Property taxes
- −$1,972
- − Insurance
- −$462
- − Repairs & maintenance
- −$1,166
- − Management
- −$1,166
- − HOA
- −$1,380
- − Depreciation
- −$2,691
- Taxable income
- $560
- Est. tax owed @ 24.0%
- −$134
- After-tax cash flow
- $1,748/yr
For passive investors: Depreciation is non-cash, so a rental often shows a tax loss while cash-flowing — sheltering income. Rental losses are passive: they offset passive income freely, and up to $25,000/yr can offset ordinary (W-2) income if you actively participate and your MAGI is under $100k (phasing out to $0 by $150k); unused losses carry forward. On sale, claimed depreciation is recaptured at up to 25%, and gains may owe capital-gains tax (a 1031 exchange can defer both). Figures are a year-1 estimate at your 24.0% rate — not tax advice; consult a CPA.
Schools (NCES district)
- District
- La Joya ISD
- NCES district ID
- 4826130
- Math proficiency
- 18% ▼ -35.00%
- Reading proficiency
- 29% ▼ -10.00%
- Median HH income
- $27,845
- Composite
- 18.65/100
- National rank
- #8891
- State rank
- #759 of 826 in TX
Livability — Palmview
- Score
- 57/100
- State rank
- #1267
- US rank
- #22043
Category grades
Schools grade is shown separately in the Schools card above.
Census & demographics
- Census place
- Palmview, TX
- County
- Hidalgo County · 623,128 people
- Metro
- McAllen-Edinburg-Mission, TX
- Population (ZIP)
- 78,024
- Household income
- $54,298
- Rent vs Own
- Severe rent burden
- 1714.0
Population outlook (Hidalgo County) Hauer SSP2
- Today (2025)
- 955,232 people
- By 2030
- 1,009,774 · +5.7%
- By 2040
- 1,120,332 · +17.3%
- By 2050
- 1,225,036 · +28.2%
- By 2075
- 1,439,189 · +50.7%
- By 2100
- 1,533,429 · +60.5%
Race, ethnicity, and origin ACS 2023
- Neighborhood character
- Predominantly Hispanic (85%)
- Race & ethnicity
- Hispanic / Latino 85% Two or more races 47% White 12% Asian 2%
- Hispanic origin (detail)
- Mexican 80%
- Common ancestry
- Slovak 1% Portuguese 0%
- Foreign-born
- 28% · Canada, South Korea
- Languages at home
- 22% English-only · Spanish 76%
Political lean MEDSL · Hidalgo
- 2024 margin
- Toss-up / Even · D 48.1% · R 51.0%
- 2008→2024 swing
- -41.6pp toward R · 2008: 38.7pp · 2024: -2.9pp
- All cycles
- 2024: R+2.9 2020: D+17.1 2016: D+40.5 2012: D+41.8 2008: D+38.7
Not yet ingested
- Civics
- —
Market trends
- HPI YoY
- ▼ -62.35%
- Current HPI
- 209.3573
- Rent YoY
- ▲ 0.93%
- Metro
- McAllen-Edinburg-Mission, TX
- State GDP YoY
- ▲ 3.95%
- F500 in state
- 110
Industry mix (Fortune 500 HQ in TX)
| Industry | F500 HQs | Revenue |
|---|---|---|
| Energy | 16 | $1,198B |
|
||
| Technology | 5 | $198B |
|
||
| Engineering / Construction | 4 | $72B |
|
||
| Energy Services | 3 | $60B |
|
||
| Utilities | 3 | $41B |
|
||
| Healthcare | 2 | $330B |
|
||
Price history
2 events — show timeline
- 2026-04-09 Listed $92,500 MCALLENMLS
- 1997-04-21 Sold (Public Records) — Public Records
Property tax history
+4.9%/yrLatest (2025): $1,972 · +8.6% YoY. Source: county tax records.
Cash-flow waterfall
monthlySold comps — $/sqft
last 12 mo · ≤1 miLoading sold comps…