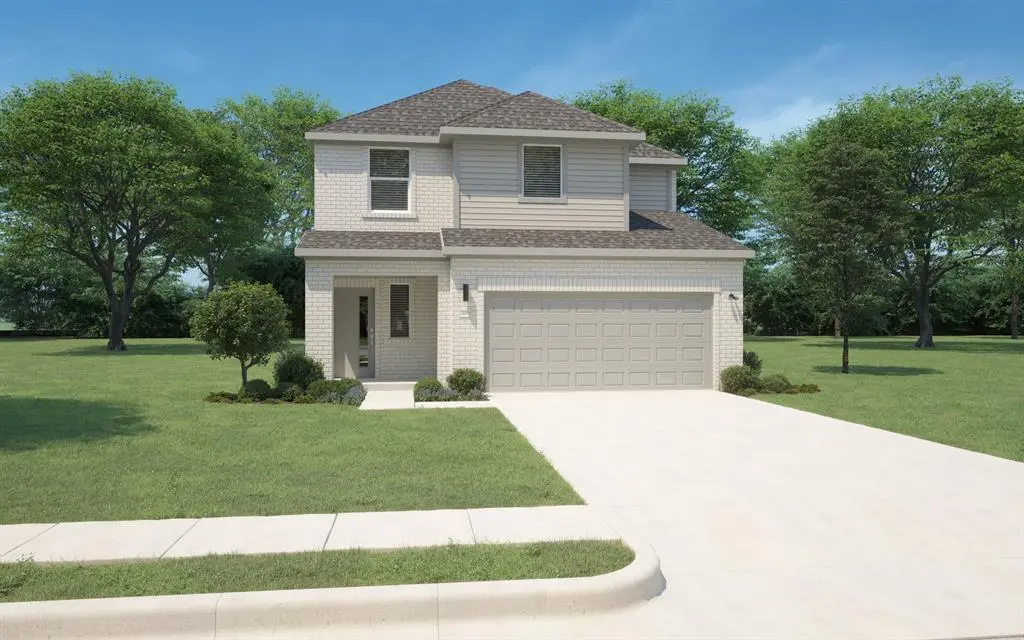
1855 Balfour Bnd · Forney, TX
Flood risk No data
- FEMA flood zone
- —
- Chance of flooding over 30 yrs
- —
- Est. flood insurance / yr
- —
Fire risk No data
- Est. fire insurance / yr
- —
Heat risk No data
- Hot days now (above threshold)
- —
- Hot days in 30 yrs
- —
Wind risk No data
- Chance of severe wind over 30 yrs
- —
Air-quality risk No data
- Unhealthy air days now
- —
- Unhealthy air days in 30 yrs
- —
Risk factors via First Street. Map © Google.
Why this score? — see what drove the D grade
The composite is a weighted blend of 9 inputs, each scored 0–100. Each bar is that input's sub-score; the figure is the points it added to the 100-point composite (weight × sub-score).
- Cash flow +11.4/30.0
- ARV discount +9.7/15.0
- Schools +4.0/10.0
- Condition / age +4.0/5.0
- Livability +3.8/5.0
- 1% rule +3.6/10.0
- DSCR +3.3/10.0
- Rent growth +2.9/5.0
- Appreciation +0.0/10.0
$322,990
🖨 Deal sheet 📄 Offer letter ✓ Due diligence
Listing remarks
MLS# 21227606 - Built by Trophy Signature Homes - Jun 2026 completion! ~ A floor plan that epitomizes grace and functionality, offering a harmonious blend of classic charm and contemporary comfort - the Magnolia. Designed with meticulous attention to detail, this layout creates an inviting space ideal for both relaxed living and elegant entertaining. In essence, the Magnolia floor plan offers a perfect blend of elegance and everyday convenience, delivering a living experience that is both refined and accommodating. Discover the Magnolia, where timeless beauty meets modern living.
Key facts
- 5,400 sq ft lot
- 2 garage spots
- Community pool
Property features AI
Finance
- Financial info: Treat as clear loan type; No second mortgage indicated
- HOA & community: Mandatory association (Devonshire Residential Association, Inc.); Quarterly association fee; Association fee covers use of facilities, management, grounds and structure maintenance; Community amenities: clubhouse, community pool, greenbelt, jogging/bike path, park, perimeter fencing, sidewalks
Exterior
- Parking: Attached 2-car garage (20' x 20'); Two covered parking spaces (2-car single door)
- Security: Smoke detector(s); Carbon monoxide detector(s)
- Utilities: MUD water; MUD sewer; Curbs and sidewalks; Municipal utility district; Energy-efficient appliances, HVAC, insulation, lighting, windows and water heater; Low-flow fixtures and water-smart landscaping
- Home design: Single family residence; Two stories; New construction (incomplete, 2025); Part of Devonshire planned development; Smart home features included
- Construction: Brick, rock/stone and siding exterior; Composition roof; Slab foundation
- Exterior features: Covered porch(es); Covered patio; Gutters; Exterior lighting; Private yard; Back yard fencing
Interior
- Kitchen: Built-in gas range; Gas oven; Dishwasher; Microwave; Disposal
- Bedrooms: Primary bedroom on main level; Three additional bedrooms (several on second level); Walk-in closet(s)
- Flooring: Luxury vinyl plank; Tile; Carpet
- Bathrooms: Two full bathrooms; One half bathroom
- Heating & cooling: Central heating (natural gas); Central air; Zoned cooling; Ceiling fan(s)
- Interior features: Open floorplan; Vaulted ceilings; Pantry; Decorative lighting; Cable TV available; High-speed internet available; Room count: 9; One living area; One dining area
- Laundry & utility: Full-size washer/dryer area; Washer hookup; Electric dryer hookup; Utility room; Tankless water heater
Neighborhood map
What this means for you Summary
Snapshot
- This is a 4-bed/2.5-bath single-family listed at $323k. Condition is rated good.
Deal economics
- At list price, monthly cash flow is $-114 ($-1k/yr) — negative.
- To cash-flow at today's rent, offer at most $306k (5.1% below list).
- To meet the 1% rule (rent ≥ 1% of price), the offer needs to be $276k (14.5% below list).
- Recommended offer: $276k (14.5% below list) — sets the bar for 1% rule.
- Cap rate 5.9% vs local median 4.1% in Forney — top-decile yield for the area; either an underpriced asset or a hidden risk that comps aren't pricing in. Stress-test before assuming the spread holds.
Location & tenants
- Location reads 76/100 on livability (#98 in TX, #3,339 nationally) — a middle-class / working-renter tenant base. Strengths: crime A+, employment A+, cost of living A+; Watch: amenities C-, commute F.
- Forney ISD (rural): math 41% / reading 44% proficiency, ranked #234 of 826 in TX (top 28%) — families likely to look elsewhere, expect single-tenant / working-renter base with shorter leases.
- Zoned schools: Griffin El (782 students, 48% FRL) — zoned schools average 48% FRL vs 26% district-wide (22 pts higher); higher-poverty schools than district average — tighter screening recommended.
- Market conditions: Rents rising (+1.4%/yr); 2179 active listings in the ZIP; 40 comparable units currently listed for rent nearby; rentals at typical pace (median 24d on market — plan ~3-4 weeks tenant-placement turnaround); solid renter incomes; 1,747 units permitted in Kaufman County in 2024 (180 in 5+ unit buildings).
- This rent runs 32% of the median local income ($104k/yr) — at the standard rent-burdened threshold; future hikes will face affordability resistance.
Forward outlook
- Local home prices are declining (-3.0%/yr); year-one equity from $2k of loan paydown is wiped out by about $10k of value loss. Plan a longer hold.
- Kaufman County population projected at +43% by 2050 — long-run rental-demand tailwind backs the buy-and-hold thesis.
Negotiation context
- Only 9 days on market — expect competitive offers; lowballing is unlikely to land.
Questions for the listing agent
- What do current leases actually rent for vs. the listed asking? Can we see a recent rent roll and the last 12 months of T-12 income?
- What does the HOA fee cover, when was the last increase, and are there any pending special assessments or reserve-fund shortfalls?
- Is there a deadline driving the sale (1031 exchange, divorce, estate, relocation)? That informs how much negotiation room exists.
- Schools are B-rated — typically a magnet for longer-tenancy family renters. What's the average tenant stay here, and is there a school-zone premium baked into asking?
- The area grade is low — what's the realistic commute time and amenity access for the typical tenant pool here? Any planned neighborhood developments (good or bad) we should know about?
- What's the average days-on-market for RENTAL listings here right now (not sales)? A rising rental-DOM trend means longer vacancies and softer asking-rent achievability than the comps imply.
- What's the recent tenant-quality profile in this submarket — average credit score on applications, eviction rate, late-payment / NSF rate, and stable-employment percentage? A property-management company in the area should have these aggregated.
- How much new for-sale + rental construction is in the pipeline within 1–3 miles? Heavy new supply typically softens prices + rents 12–24 months out; constrained supply supports both.
Investment metrics
- 1% rule
- 0.86% ✗
- Cap rate
- 5.87%
- Cash-on-cash
- -1.52%
- DSCR
- 0.93
- GRM
- 9.7
CMA / ARV
- ARV (on-the-fly)
- $339,692
- Comps found
- 12
Show comp detail 12 sales within ~0.75 mi
| Address | Dist | Beds/Ba | Sqft | Sold | Price | $/sf | Match |
|---|---|---|---|---|---|---|---|
| 1859 Balfour Bnd | 0.02mi | 4/2.0 | 1,866 (-10%) | 0mo | $304,990 | $163 | 79 |
| 1165 Nora Ln | 0.21mi | 3/2.5 (-1) | 2,171 (+4%) | 0mo | $399,900 | $184 | 78 |
| 1861 Balfour Bnd | 0.03mi | 3/2.0 (-1) | 1,909 (-8%) | 1mo | $309,990 | $162 | 77 |
| 2235 Willowbank Dr | 0.17mi | 3/2.0 (-1) | 1,986 (-5%) | 0mo | $317,990 | $160 | 77 |
| 2929 Soaring Hills Dr | 0.29mi | 4/3.0 | 2,188 (+5%) | 1mo | $374,900 | $171 | 76 |
| 1181 Nora Ln | 0.20mi | 4/2.5 | 2,318 (+11%) | 0mo | $329,990 | $142 | 72 |
| 2019 Brewers Ln | 0.35mi | 3/2.0 (-1) | 1,984 (-5%) | 1mo | $352,900 | $178 | 68 |
| 1184 Nora Ln | 0.18mi | 4/2.0 | 1,791 (-14%) | 0mo | $312,990 | $175 | 66 |
| 1290 Binfield Dr | 0.45mi | 3/2.0 (-1) | 1,901 (-9%) | 0mo | $294,990 | $155 | 57 |
| 1017 Knoxbridge Rd | 0.59mi | 4/2.0 | 2,296 (+10%) | 1mo | $350,000 | $152 | 53 |
| 2122 Winsbury Way | 0.34mi | 3/2.0 (-1) | 1,771 (-15%) | 0mo | $285,000 | $161 | 52 |
| 2162 Charming Forge Rd | 0.73mi | 4/3.0 | 2,285 (+10%) | 1mo | $484,480 | $212 | 47 |
Match score weights: distance 35% · size 25% · config 20% · recency 20%. Top-matched comps best support the ARV.
Projected returns pro-forma
-3.0% appreciation · 1.42% rent growth · sell at horizon
- IRR
- -20.6%
- Equity multiple
- 0.29×
- Total profit
- $-63,869
- Equity at exit
- $48,159
- IRR
- -17.9%
- Equity multiple
- 0.09×
- Total profit
- $-81,858
- Equity at exit
- $27,926
Cash invested: $90,437 (down + closing). Projections, not guarantees.
Landlord ↔ Tenant lean methodology
- Overall (STATE)
- 87 Strongly Landlord-Friendly
- State Texas
- 87 Strongly Landlord-Friendly · R+5
- County
- — inherits STATE
- City
- — inherits STATE
ZIP-level market 75126
- Rents YoY
- 1.4%
- Active inventory
- 2179
- Price-to-rent
- 9.7×
Monthly cashflow live
- Estimated rent
- $2,763 high interval (Pro) →
- Mortgage (P&I)
- −$1,694
- Tax est. 1.5%
- −$404 /mo · $4,845/yr
- Insurance
- −$135
- HOA
- −$65
- Vacancy / Maint / Mgmt
- −$580
- Net cashflow
- $-114
Break-even live
UW: 25.0% down · 7.5% · 30yr · 1.5% tax · 5.0% vac · 8.0% maint · 8.0% mgmt
Financing live
Cash to close
- Down payment
- $80,748
- Closing costs
- $9,690
- Reserves months
- —
- Total cash needed
- —
Loan-product check · same deal, 3 products live
Conventional
25% down · 7.5% · 30yr
- Down + closing
- —
- Monthly P&I
- —
- Monthly cashflow
- —
- DSCR
- —
- Eligible?
- —
Personal DTI + credit; lowest rate.
DSCR
20% down · 8.5% · 30yr
- Down + closing
- —
- Monthly P&I
- —
- Monthly cashflow
- —
- DSCR
- —
- Eligible?
- —
No personal income docs; deal must DSCR.
Hard money
10% down · 12.0% · 12mo
- Down + closing
- —
- Monthly P&I
- —
- Monthly cashflow
- —
- DSCR
- —
- Eligible?
- —
Short-term bridge; refi at stabilization.
Rent comps 40 comps
| Address | Beds | Baths | Sqft | Rent | $/sqft | DOM | Units | Dist |
|---|---|---|---|---|---|---|---|---|
| 2029 Dovedale Dr Forney, TX | 4.0 | 3.0 | 2426 | $3,200 | $1.32 | 43d | 1 | 0.17mi |
| 1806 Balfour Bnd Forney, TX | 3.0 | 2.0 | 1981 | $2,600 | $1.31 | 24d | 1 | 0.21mi |
| 635 Brockwell Bnd Forney, TX | 4.0 | 3.0 | 2506 | $3,300 | $1.32 | 19d | 1 | 0.32mi |
| 2023 Avondown Rd Forney, TX | 3.0 | 2.0 | 1640 | $2,296 | $1.40 | 4d | 1 | 0.47mi |
| 1448 Kingswell Ln Forney, TX | 4.0 | 3.0 | 2208 | $2,950 | $1.34 | 24d | 1 | 0.48mi |
| 1128 Queensdown Way Forney, TX | 4.0 | 3.0 | 2097 | $2,999 | $1.43 | 43d | 1 | 0.52mi |
| 2116 Sunnymede Dr Forney, TX | 5.0 | 3.0 | 2854 | $3,300 | $1.16 | 20d | 1 | 0.57mi |
| 1410 Crossford Trl Forney, TX | 3.0 | 2.5 | 2707 | $2,650 | $0.98 | 1d | 1 | 0.62mi |
| 2136 Sunnymede Dr Forney, TX | 4.0 | 4.0 | 2805 | $3,200 | $1.14 | 1d | 1 | 0.63mi |
| 1421 Kirkhill Ln Unit 1421 Heath, TX | 4.0 | 3.0 | 2545 | $3,500 | $1.38 | 20d | 1 | 0.68mi |
| 1421 Kirkhill Ln Forney, TX | 4.0 | 3.0 | 2545 | $3,600 | $1.41 | 24d | 1 | 0.68mi |
| 1120 Canterbury Ln Forney, TX | 4.0 | 3.0 | 2450 | $2,950 | $1.20 | 12d | 1 | 0.68mi |
| 2217 Perrymead Dr Forney, TX | 3.0 | 2.0 | 1423 | $2,360 | $1.66 | 4d | 1 | 0.69mi |
| 2239 Heaton Forney, TX | 5.0 | 2.5 | 2780 | $3,299 | $1.19 | 17d | 1 | 0.69mi |
| 2225 Heaton Forney, TX | 3.0 | 2.0 | 1909 | $2,150 | $1.13 | 43d | 1 | 0.73mi |
| 2213 Heaton Forney, TX | 3.0 | 2.0 | 2146 | $2,395 | $1.12 | 16d | 1 | 0.76mi |
| 2213 Heaton Forney, TX | 3.0 | 2.0 | 2146 | $2,395 | $1.12 | 7d | 1 | 0.76mi |
| 2207 Heaton Forney, TX | 3.0 | 2.0 | 1423 | $2,100 | $1.48 | 43d | 1 | 0.78mi |
| 1728 High Perch Ln Forney, TX | 3.0 | 2.0 | 1474 | $1,800 | $1.22 | 18d | 1 | 0.85mi |
| 1729 High Perch Ln Forney, TX | 4.0 | 2.0 | 1720 | $2,350 | $1.37 | 43d | 1 | 0.86mi |
| 2003 Pine Stone Ln Forney, TX | 3.0 | 2.0 | 1488 | $2,000 | $1.34 | 43d | 1 | 0.86mi |
| 1017 Somerset Cir Forney, TX | 3.0 | 2.0 | 2185 | $2,375 | $1.09 | 7d | 1 | 0.86mi |
| 1025 Dunhill Ln Forney, TX | 4.0 | 2.0 | 2273 | $2,450 | $1.08 | 1d | 1 | 0.87mi |
| 2287 Cliff Springs Dr Forney, TX | 4.0 | 2.0 | 2000 | $2,195 | $1.10 | 43d | 1 | 0.87mi |
| 1147 Barbary Fields St Forney, TX | 3.0 | 2.0 | 1522 | $2,100 | $1.38 | 2d | 1 | 0.87mi |
| 1158 Barbary Fields St Forney, TX | 4.0 | 2.0 | 1780 | $2,300 | $1.29 | 43d | 1 | 0.87mi |
| 1947 Aves Glen Ln Forney, TX | 3.0 | 2.0 | 1411 | $2,195 | $1.56 | 24d | 1 | 0.89mi |
| 1355 Wedgeleaf Ln Forney, TX | 3.0 | 2.0 | 1461 | $2,200 | $1.51 | 43d | 1 | 0.91mi |
| 1633 Briar Hunt Dr Forney, TX | 5.0 | 2.5 | 2470 | $2,500 | $1.01 | 20d | 1 | 0.95mi |
| 1636 Briar Hunt Dr Forney, TX | 4.0 | 2.5 | 2000 | $2,250 | $1.12 | 43d | 1 | 0.98mi |
| 1650 Briar Hunt Dr Forney, TX | 3.0 | 2.0 | 1559 | $1,995 | $1.28 | 24d | 1 | 0.99mi |
| 1036 Edgefield Ln Forney, TX | 3.0 | 2.5 | 2800 | $6,700 | $2.39 | 43d | 1 | 0.99mi |
| 1405 Merlin Bluff St Forney, TX | 3.0 | 2.0 | 1500 | $2,400 | $1.60 | 6d | 1 | 1.02mi |
| 1631 Rosy Finch Dr Heath, TX | 4.0 | 2.0 | 1665 | $2,600 | $1.56 | 16d | 1 | 1.02mi |
| 1718 Cecil Crest Ln Forney, TX | 4.0 | 2.5 | 2147 | $2,395 | $1.12 | 43d | 1 | 1.03mi |
| 1625 Rosy Finch Dr Forney, TX | 4.0 | 2.0 | 1667 | $2,095 | $1.26 | 43d | 1 | 1.04mi |
| 2330 Aspen Hill Dr Forney, TX | 3.0 | 2.0 | 1498 | $1,795 | $1.20 | 18d | 1 | 1.04mi |
| 1289 Wedgeleaf Ln Forney, TX | 3.0 | 2.0 | 1522 | $1,785 | $1.17 | 22d | 1 | 1.05mi |
| 1725 Crossbill St Forney, TX | 3.0 | 2.0 | 1451 | $1,785 | $1.23 | 43d | 1 | 1.06mi |
| 1723 Crossbill St Forney, TX | 3.0 | 2.0 | 1461 | $1,785 | $1.22 | 43d | 1 | 1.06mi |
HOA detail
- Monthly dues
- $65 · $780/yr
Listing history 2 events
-
2026-04-11status Pending
-
2026-04-02$322,990 Active
ⓘ Source: listings_history table (triggers on properties + properties_extension) + one-shot
backfill from property_details.listing_events for pre-trigger history.
Nearby sold comps map
Loading sold comps map…
Walkable amenities ~0.75 mi
Loading nearby amenities…
Taxation est. · year 1
- Rental income
- $33,155
- − Mortgage interest
- −$18,092
- − Property taxes
- −$4,845
- − Insurance
- −$1,615
- − Repairs & maintenance
- −$2,652
- − Management
- −$2,652
- − HOA
- −$780
- − Depreciation
- −$9,396
- Taxable loss
- −$6,878
- Est. tax savings @ 24.0%
- +$1,651
- After-tax cash flow
- $278/yr
For passive investors: Depreciation is non-cash, so a rental often shows a tax loss while cash-flowing — sheltering income. Rental losses are passive: they offset passive income freely, and up to $25,000/yr can offset ordinary (W-2) income if you actively participate and your MAGI is under $100k (phasing out to $0 by $150k); unused losses carry forward. On sale, claimed depreciation is recaptured at up to 25%, and gains may owe capital-gains tax (a 1031 exchange can defer both). Figures are a year-1 estimate at your 24.0% rate — not tax advice; consult a CPA.
Condition & rehab AI · 12 photos
This home is in excellent condition with a good condition score of 80. It is move-in ready with no visible repairs or maintenance needed. The highest-ROI updates would be painting the exterior and interior walls, landscaping improvements, upgrading the kitchen appliances, and upgrading the HVAC system.
Value-add opportunities
- Both Painting the exterior and interior walls — Fresh paint can enhance curb appeal and interior aesthetics
- Both Landscaping improvements — Enhanced landscaping can increase curb appeal and property value
- Resale Upgrading the kitchen appliances — Modern appliances can attract more buyers
- Both Upgrading the HVAC system — A more efficient HVAC system can improve comfort and energy efficiency
Renovation cost estimate screening
Value-add ROI direction
- Both Painting the exterior and interior walls — Fresh paint can enhance curb appeal and interior aesthetics ↑
- Both Landscaping improvements — Enhanced landscaping can increase curb appeal and property value ↑
- Resale Upgrading the kitchen appliances — Modern appliances can attract more buyers ↑
- Both Upgrading the HVAC system — A more efficient HVAC system can improve comfort and energy efficiency ↑
ⓘ Cost ranges are severity-bucket heuristics (US national rule-of-thumb). Get contractor quotes + a written scope before underwriting a rehab budget.
Schools (NCES district)
- District
- Forney ISD
- NCES district ID
- 4819560
- Math proficiency
- 41% ▼ -20.00%
- Reading proficiency
- 44% ▼ -12.00%
- Median HH income
- $86,679
- Composite
- 40.07/100
- National rank
- #3812
- State rank
- #234 of 826 in TX
Livability — Forney
- Score
- 76/100
- State rank
- #98
- US rank
- #3339
Category grades
Schools grade is shown separately in the Schools card above.
Census & demographics
- County
- Kaufman County · 122,338 people
- Metro
- Dallas-Fort Worth-Arlington, TX
- Population (ZIP)
- 84,799
- Household income
- $103,673
- Rent vs Own
- Severe rent burden
- 1306.0
Population outlook (Kaufman County) Hauer SSP2
- Today (2025)
- 138,716 people
- By 2030
- 150,815 · +8.7%
- By 2040
- 174,877 · +26.1%
- By 2050
- 198,020 · +42.8%
- By 2075
- 251,908 · +81.6%
- By 2100
- 285,325 · +105.7%
Race, ethnicity, and origin ACS 2023
- Neighborhood character
- Diverse neighborhood (Simpson 0.68)
- Race & ethnicity
- White 45% Black 25% Hispanic / Latino 23% Two or more races 14% Asian 3%
- Hispanic origin (detail)
- Mexican 18% Puerto Rican 1%
- Common ancestry
- Italian 2% Slovak 1% Portuguese 1%
- Foreign-born
- 12% · Canada, Vietnam
- Languages at home
- 79% English-only · Spanish 14% Arabic 1% Vietnamese 1%
Political lean MEDSL · Kaufman
- 2024 margin
- Strong R (+27.9) · D 35.6% · R 63.5%
- 2008→2024 swing
- +7.9pp toward D · 2008: -35.8pp · 2024: -27.9pp
- All cycles
- 2024: R+27.9 2020: R+33.9 2016: R+47.0 2012: R+44.4 2008: R+35.8
Not yet ingested
- Civics
- —
Market trends
- HPI YoY
- ▼ -102.93%
- Current HPI
- 148.5749
- Rent YoY
- ▲ 1.42%
- Metro
- Dallas-Fort Worth-Arlington, TX
- State GDP YoY
- ▲ 3.95%
- F500 in state
- 110
Industry mix (Fortune 500 HQ in TX)
| Industry | F500 HQs | Revenue |
|---|---|---|
| Energy | 16 | $1,198B |
|
||
| Technology | 5 | $198B |
|
||
| Engineering / Construction | 4 | $72B |
|
||
| Energy Services | 3 | $60B |
|
||
| Utilities | 3 | $41B |
|
||
| Healthcare | 2 | $330B |
|
||
Price history
2 events — show timeline
- 2026-04-11 Pending — NTREIS
- 2026-04-02 Listed $322,990 NTREIS
Cash-flow waterfall
monthlySold comps — $/sqft
last 12 mo · ≤1 miLoading sold comps…