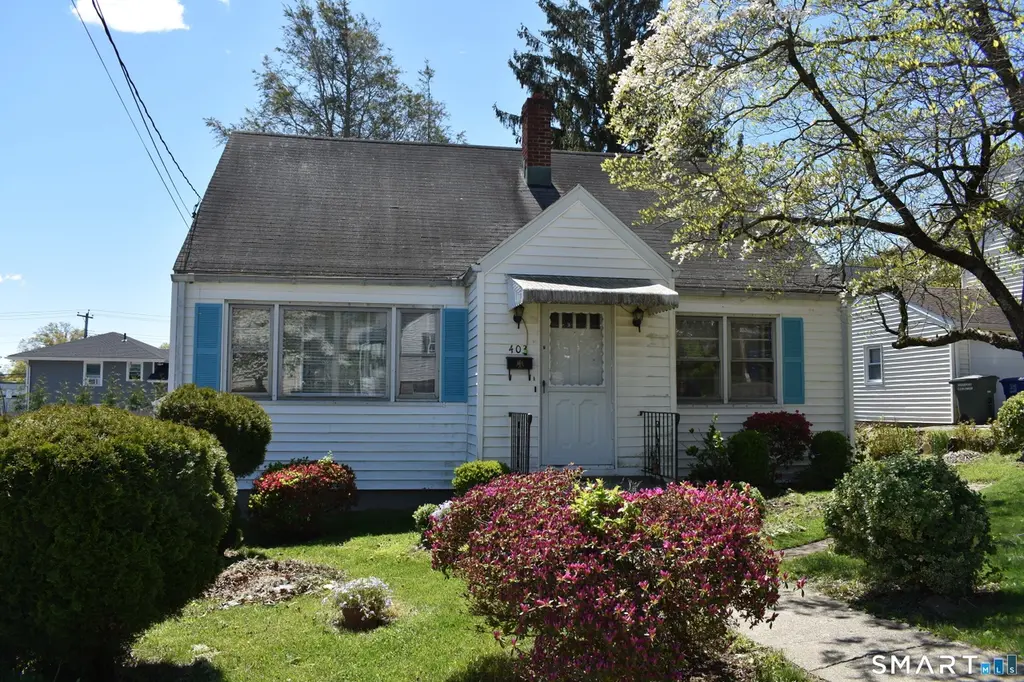
403 Clark St · Bridgeport, CT
Flood risk 1/10 · Minimal
- FEMA flood zone
- X (unshaded)
- Chance of flooding over 30 yrs
- 0.0%
- Est. flood insurance / yr
- $473 – $860
Fire risk 1/10 · Minimal
- Est. fire insurance / yr
- $829 – $1,539
Heat risk 6/10 · Moderate
- Hot days now (above 97°F)
- 7 days/yr
- Hot days in 30 yrs
- 15 days/yr
Wind risk 6/10 · Moderate
- Chance of severe wind over 30 yrs
- 41.0%
Air-quality risk 4/10 · Minor
- Unhealthy air days now
- 5 days/yr
- Unhealthy air days in 30 yrs
- 7 days/yr
Risk factors via First Street. Map © Google.
Why this score? — see what drove the C grade
The composite is a weighted blend of 9 inputs, each scored 0–100. Each bar is that input's sub-score; the figure is the points it added to the 100-point composite (weight × sub-score).
- Cash flow +19.7/30.0
- ARV discount +14.4/15.0
- DSCR +6.2/10.0
- 1% rule +5.6/10.0
- Livability +4.0/5.0
- Rent growth +3.3/5.0
- Condition / age +2.5/5.0
- Schools +1.2/10.0
- Appreciation +0.0/10.0
$350,000
🖨 Deal sheet 📄 Offer letter ✓ Due diligence
Listing remarks
Welcome to your next project-a charming Cape Cod-style home located in the desirable North End, offering incredible potential for transformation. This 3-bedroom, 1.5-bath property with a 1-car garage is a fantastic opportunity for buyers with vision and creativity. The home requires renovation and updates, making it ideal for investors or those looking to customize their dream space. With the right improvements, this property can truly shine. Being sold as-is. Don't miss the chance to bring this hidden gem back to life! MULTIPLE OFFER SITUATION: HIGHEST AND BEST DUE SATURDAY MAY 9, 2026 BY 3pm.
Key facts
- 6,098 sq ft lot
- Garage
- Built 1957
Property features AI
Exterior
- Parking: Detached garage (1-car)
- Utilities: Public water connected; Public sewer connected
- Home design: Single-family home
- Construction: Concrete foundation; Concrete construction
- Exterior features: Patio; Level lot; Vinyl siding; Asphalt shingle roof
Interior
- Kitchen: Electric range; Refrigerator
- Bedrooms: Three bedrooms
- Bathrooms: One full bathroom; One half bathroom
- Heating & cooling: Baseboard heating; Oil-fired heat; Ceiling fans for cooling; Tankless hot water (oil-fired) with fuel tank in basement
- Interior features: Seven total rooms; Full unfinished basement; Attic with access via hatch; Ceiling fans
- Laundry & utility: Washer included; Main-level laundry
Neighborhood map
What this means for you Summary
Snapshot
- This is a 5-bed/1.5-bath single-family listed at $350k.
Deal economics
- At list price, monthly cash flow is $409 ($5k/yr) — positive.
- The deal already cash-flows at list — no discount required.
- Meets the 1% rule at list price ($4k rent vs $350k).
- Cap rate 7.7% vs local median 5.0% in Bridgeport — top-decile yield for the area; either an underpriced asset or a hidden risk that comps aren't pricing in. Stress-test before assuming the spread holds.
Location & tenants
- Location reads 81/100 on livability (#15 in CT, #1,374 nationally) — a professional / high-income tenant draw. Strengths: amenities A+, commute A+, health & safety A+; Watch: crime C-, employment D+, schools D-.
- Bridgeport School District (urban): math 9% / reading 19% proficiency, ranked #151 of 153 in CT (top 99%) — low school quality limits family demand, transient renter base, plan for 1-2y turnover; 97% free/reduced lunch — lower-income household profile, screen leases tightly.
- Market conditions: Rents rising (+3.1%/yr); 152 active listings in the ZIP; 14 comparable units currently listed for rent nearby; rentals at typical pace (median 15d on market — plan ~3-4 weeks tenant-placement turnaround); 852 units permitted in Greater Bridgeport Planning Region in 2024 (698 in 5+ unit buildings).
- At $3,718/mo this rent would consume 61% of the median local household income ($73k/yr) (locally 2163% of renters already pay >50% of income on rent) — very limited rent-growth headroom before tenants either downsize or default.
Forward outlook
- Local home prices are declining (-3.0%/yr); year-one equity from $2k of loan paydown is wiped out by about $10k of value loss. Plan a longer hold.
Negotiation context
- Only 9 days on market — expect competitive offers; lowballing is unlikely to land.
- 2 sale attempts with the ask held roughly flat each time — persistent listings suggest the price (not the market) is what's stuck; bring a comps-based counter.
Risks & watch-outs
- Watch-outs: built in 1957 — expect roof / HVAC / electrical / plumbing capex.
- Climate carrying-cost: major wind risk, 41% chance of damaging wind over 30y; extreme-heat days projected 7→15/yr by 2055 (HVAC capex compounding) — expect insurance premiums to compound above CPI over the hold.
Questions for the listing agent
- Built in 1957 — when were the roof, HVAC, electrical panel, plumbing, and water heater last replaced?
- Is there a deadline driving the sale (1031 exchange, divorce, estate, relocation)? That informs how much negotiation room exists.
- Schools are D-rated, which usually means shorter tenancies and higher turnover. Who's the typical renter profile here, and what's been the actual vacancy rate?
- What's the average days-on-market for RENTAL listings here right now (not sales)? A rising rental-DOM trend means longer vacancies and softer asking-rent achievability than the comps imply.
- What's the recent tenant-quality profile in this submarket — average credit score on applications, eviction rate, late-payment / NSF rate, and stable-employment percentage? A property-management company in the area should have these aggregated.
- How much new for-sale + rental construction is in the pipeline within 1–3 miles? Heavy new supply typically softens prices + rents 12–24 months out; constrained supply supports both.
Investment metrics
- 1% rule
- 1.06% ✓
- Cap rate
- 7.70%
- Cash-on-cash
- 5.01%
- DSCR
- 1.22
- GRM
- 7.8
CMA / ARV
- ARV (median comp)
- $413,436
- List price
- $350,000
- Delta
- -15.34%
- Verdict
- UNDERPRICED
- Comps
- 20 within 1.0 mi
Show comp detail 12 sales within ~0.75 mi
| Address | Dist | Beds/Ba | Sqft | Sold | Price | $/sf | Match |
|---|---|---|---|---|---|---|---|
| 715 Burnsford Ave | 0.31mi | 6/2.0 (+1) | 1,373 (0%) | 10mo | $450,000 | $328 | 70 |
| 376 Savoy St | 0.22mi | 4/2.0 (-1) | 1,307 (-5%) | 6mo | $392,500 | $300 | 70 |
| 11 Stratfield Pl | 0.44mi | 4/1.0 (-1) | 1,358 (-1%) | 2mo | $426,000 | $314 | 69 |
| 405 Ruth St | 0.25mi | 4/2.0 (-1) | 1,320 (-4%) | 7mo | $442,000 | $335 | 69 |
| 2346 Madison Ave | 0.43mi | 4/1.5 (-1) | 1,384 (+1%) | 7mo | $440,000 | $318 | 68 |
| 241 Sampson St | 0.65mi | 4/1.5 (-1) | 1,386 (+1%) | 4mo | $395,000 | $285 | 60 |
| 88 Plankton St | 0.58mi | 4/2.0 (-1) | 1,381 (+1%) | 9mo | $475,000 | $344 | 58 |
| 37 Herald Ave | 0.67mi | 4/1.5 (-1) | 1,332 (-3%) | 2mo | $390,000 | $293 | 57 |
| 120 Clark St | 0.27mi | 4/2.0 (-1) | 1,556 (+13%) | 2mo | $550,000 | $353 | 56 |
| 200 Stratfield Pl | 0.35mi | 4/3.0 (-1) | 1,507 (+10%) | 8mo | $485,000 | $322 | 49 |
| 129 Ashton St | 0.58mi | 4/2.0 (-1) | 1,248 (-9%) | 6mo | $440,000 | $353 | 46 |
| 514 Peet St | 0.45mi | 4/2.0 (-1) | 1,572 (+14%) | 9mo | $420,000 | $267 | 40 |
Match score weights: distance 35% · size 25% · config 20% · recency 20%. Top-matched comps best support the ARV.
Projected returns pro-forma
-3.0% appreciation · 3.12% rent growth · sell at horizon
- IRR
- -8.3%
- Equity multiple
- 0.69×
- Total profit
- $-30,087
- Equity at exit
- $52,186
- IRR
- 1.4%
- Equity multiple
- 1.10×
- Total profit
- $9,701
- Equity at exit
- $30,262
Cash invested: $98,000 (down + closing). Projections, not guarantees.
Landlord ↔ Tenant lean methodology
- Overall (STATE)
- 27 Tenant-Leaning
- State Connecticut
- 27 Tenant-Leaning · D+7
- County
- — inherits STATE
- City
- — inherits STATE
ZIP-level market 06606
- Rents YoY
- 3.1%
- Active inventory
- 152
- Price-to-rent
- 7.8×
Monthly cashflow live
- Estimated rent
- $3,718 high interval (Pro) →
- Mortgage (P&I)
- −$1,835
- Tax from tax record
- −$547 /mo · $6,564/yr
- Insurance
- −$146
- HOA
- −$0
- Vacancy / Maint / Mgmt
- −$781
- Net cashflow
- $409
Break-even live
UW: 25.0% down · 7.5% · 30yr · 1.5% tax · 5.0% vac · 8.0% maint · 8.0% mgmt
Financing live
Cash to close
- Down payment
- $87,500
- Closing costs
- $10,500
- Reserves months
- —
- Total cash needed
- —
Loan-product check · same deal, 3 products live
Conventional
25% down · 7.5% · 30yr
- Down + closing
- —
- Monthly P&I
- —
- Monthly cashflow
- —
- DSCR
- —
- Eligible?
- —
Personal DTI + credit; lowest rate.
DSCR
20% down · 8.5% · 30yr
- Down + closing
- —
- Monthly P&I
- —
- Monthly cashflow
- —
- DSCR
- —
- Eligible?
- —
No personal income docs; deal must DSCR.
Hard money
10% down · 12.0% · 12mo
- Down + closing
- —
- Monthly P&I
- —
- Monthly cashflow
- —
- DSCR
- —
- Eligible?
- —
Short-term bridge; refi at stabilization.
Rent comps 14 comps
| Address | Beds | Baths | Sqft | Rent | $/sqft | DOM | Units | Dist |
|---|---|---|---|---|---|---|---|---|
| 927 Birmingham St Bridgeport, CT | 4.0 | 2.0 | 1362 | $3,800 | $2.79 | 2d | 1 | 0.39mi |
| 68-70 Westfield Ave Bridgeport, CT | 4.0 | 2.0 | 1470 | $3,200 | $2.18 | 14d | 1 | 0.47mi |
| 120 Englewood Ave Bridgeport, CT | 4.0 | 2.0 | 1675 | $3,650 | $2.18 | 3d | 1 | 0.51mi |
| 340 Pleasantview Ave Unit 2nd/3rd floors Bridgeport, CT | 4.0 | 2.0 | 1728 | $3,000 | $1.74 | 43d | 1 | 0.58mi |
| 145 Rooster River Blvd Bridgeport, CT | 5.0 | 2.0 | 1452 | $3,800 | $2.62 | 2d | 1 | 0.62mi |
| 318 Valley Ave Bridgeport, CT | 4.0 | 2.0 | 1718 | $3,250 | $1.89 | 23d | 1 | 0.63mi |
| 95 Marcel St Bridgeport, CT | 5.0 | 2.0 | 1404 | $4,000 | $2.85 | 43d | 1 | 0.71mi |
| 111 Vanguard St Bridgeport, CT | 5.0 | 3.5 | 1868 | $4,800 | $2.57 | 3d | 1 | 0.78mi |
| 139 Little Deer Rd Bridgeport, CT | 4.0 | 2.0 | 1420 | $3,600 | $2.54 | 43d | 1 | 1.02mi |
| 70 Pitt St Bridgeport, CT | 4.0 | 1.0 | 1208 | $3,200 | $2.65 | 21d | 1 | 1.17mi |
| 95 Parrott Ave Bridgeport, CT | 4.0 | 1.0 | 1782 | $3,450 | $1.94 | 23d | 1 | 1.21mi |
| 124 Minturn Pl Bridgeport, CT | 5.0 | 2.0 | 1685 | $4,000 | $2.37 | 2d | 1 | 1.40mi |
| 1787 Stratfield Rd Fairfield, CT | 4.0 | 2.0 | 1200 | $3,250 | $2.71 | 3d | 1 | 1.43mi |
| 34 Seaver Cir Bridgeport, CT | 4.0 | 2.0 | 1555 | $3,500 | $2.25 | 2d | 1 | 1.47mi |
Listing history 5 events
-
2026-05-12status Under Contract 604-char remark
-
2026-05-09historical Under Contract - Continue to Show 604-char remark
-
2026-05-04$350,000 Active 604-char remark
-
2026-05-01historical $350,000 604-char remark
-
1991-05-02soldstatus $120,000
ⓘ Source: listings_history table (triggers on properties + properties_extension) + one-shot
backfill from property_details.listing_events for pre-trigger history.
Tax reassessment forecast CT · Partial reset (capped growth)
- Current annual tax
- $6,564 · $547/mo
- Projected year-2 tax
- $7,027 · $586/mo
- Expected delta
- +$463/yr (+$39/mo · 7.1%)
ⓘ Screening estimate from a state-policy table — verify with the county assessor before closing.
Climate risk First Street
- Flood 1/10 Low FEMA zone X (unshaded) · 0% chance over 30 yrs
- Wildfire 1/10 Low
- Heat 6/10 Major 7 d/yr ≥97°F today · 15 d/yr by 30 yrs out
- Wind 6/10 Major 41% chance of damaging wind over 30 yrs
- Air quality 4/10 Moderate 5 unhealthy d/yr today · 7 by 30 yrs out
Nearby sold comps map
Loading sold comps map…
Walkable amenities ~0.75 mi
Loading nearby amenities…
Taxation est. · year 1
- Rental income
- $44,618
- − Mortgage interest
- −$19,605
- − Property taxes
- −$6,564
- − Insurance
- −$1,750
- − Repairs & maintenance
- −$3,569
- − Management
- −$3,569
- − Depreciation
- −$10,182
- Taxable loss
- −$622
- Est. tax savings @ 24.0%
- +$149
- After-tax cash flow
- $5,058/yr
For passive investors: Depreciation is non-cash, so a rental often shows a tax loss while cash-flowing — sheltering income. Rental losses are passive: they offset passive income freely, and up to $25,000/yr can offset ordinary (W-2) income if you actively participate and your MAGI is under $100k (phasing out to $0 by $150k); unused losses carry forward. On sale, claimed depreciation is recaptured at up to 25%, and gains may owe capital-gains tax (a 1031 exchange can defer both). Figures are a year-1 estimate at your 24.0% rate — not tax advice; consult a CPA.
Schools (NCES district)
- District
- Bridgeport School District
- NCES district ID
- 0900450
- Math proficiency
- 9% ▼ -7.00%
- Reading proficiency
- 19% ▼ -10.00%
- Median HH income
- $41,507
- Composite
- 12.09/100
- National rank
- #9656
- State rank
- #151 of 153 in CT
Livability — Bridgeport
- Score
- 81/100
- State rank
- #15
- US rank
- #1374
Category grades
Schools grade is shown separately in the Schools card above.
Census & demographics
- Census place
- Bridgeport, CT
- County
- Fairfield County · 765,532 people
- City population
- 149,153
- Metro
- Bridgeport-Stamford-Norwalk, CT
- Population (ZIP)
- 49,308
- Household income
- $73,372
- Rent vs Own
- Severe rent burden
- 2163.0
Population outlook (Greater Bridgeport County) Hauer SSP2
- By 2040
- 365,581
Race, ethnicity, and origin ACS 2023
- Neighborhood character
- Highly diverse neighborhood (Simpson 0.73)
- Race & ethnicity
- Hispanic / Latino 37% White 31% Black 19% Two or more races 11% Asian 7%
- Hispanic origin (detail)
- Mexican 5% Puerto Rican 12% Dominican 4%
- Common ancestry
- Estonian 5% Russian 4% Romanian 3%
- Foreign-born
- 37% · Canada, Jamaica, Vietnam
- Languages at home
- 50% English-only · Spanish 27% Other Indo-European 15% French/Haitian/Cajun 2%
Political lean MEDSL · Greater Bridgeport
- 2024 margin
- Strong D (+23.3) · D 60.9% · R 37.6% · Other 1.5%
- All cycles
- 2024: D+23.3
Not yet ingested
- Civics
- —
Market trends
- HPI YoY
- ▼ -270.11%
- Current HPI
- 345.647
- Rent YoY
- ▲ 3.12%
- Metro
- Bridgeport-Stamford-Norwalk, CT
- State GDP YoY
- ▲ 1.06%
- F500 in state
- 38
Industry mix (Fortune 500 HQ in CT)
| Industry | F500 HQs | Revenue |
|---|---|---|
| Industrial Machinery | 4 | $38B |
|
||
| Insurance | 3 | $71B |
|
||
| Financial Services | 2 | $25B |
|
||
| Transportation / Logistics | 2 | $18B |
|
||
| Healthcare | 1 | $247B |
|
||
| Telecommunications | 1 | $55B |
|
||
Price history
+212.5% since first listed8 events — show timeline
- 2026-06-16 Sold (MLS) $375,000 Smart MLS
- 2026-05-28 Pending — Smart MLS
- 2026-05-28 Relisted — Smart MLS
- 2026-05-12 Pending — Smart MLS
- 2026-05-09 Contingent — Smart MLS
- 2026-05-04 Listed $350,000 Smart MLS
- 2026-05-01 Coming Soon $350,000 Smart MLS
- 1991-05-02 Sold (Public Records) $120,000 Public Records
Property tax history
+1.7%/yrLatest (2023): $6,564 · +0.0% YoY. Source: county tax records.
Cash-flow waterfall
monthlySold comps — $/sqft
last 12 mo · ≤1 miLoading sold comps…