 8-Plex
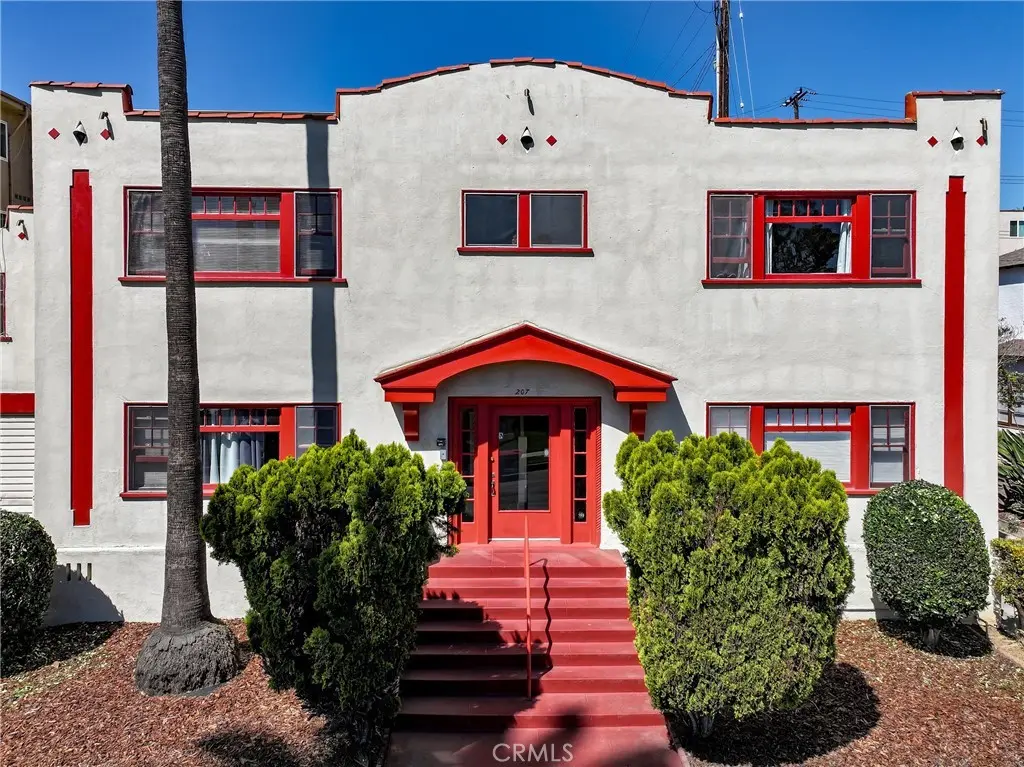
207 Mira Mar · Long Beach, CA
Flood risk 1/10 · Minimal
- FEMA flood zone
- X (unshaded)
- Chance of flooding over 30 yrs
- 0.0%
- Est. flood insurance / yr
- $507 – $1,088
Fire risk 1/10 · Minimal
- Est. fire insurance / yr
- $659 – $1,223
Heat risk 4/10 · Minor
- Hot days now (above 86°F)
- 7 days/yr
- Hot days in 30 yrs
- 23 days/yr
Wind risk 1/10 · Minimal
- Chance of severe wind over 30 yrs
- —
Air-quality risk 5/10 · Moderate
- Unhealthy air days now
- 7 days/yr
- Unhealthy air days in 30 yrs
- 9 days/yr
Risk factors via First Street. Map © Google.
Why this score? — see what drove the C- grade
The composite is a weighted blend of 9 inputs, each scored 0–100. Each bar is that input's sub-score; the figure is the points it added to the 100-point composite (weight × sub-score).
- Cash flow +25.1/30.0
- DSCR +8.2/10.0
- 1% rule +5.7/10.0
- Schools +3.7/10.0
- ARV discount +3.6/15.0
- Livability +3.4/5.0
- Rent growth +2.9/5.0
- Condition / age +2.5/5.0
- Appreciation +0.0/10.0
$1,945,000
🖨 Deal sheet 📄 Offer letter ✓ Due diligence
Multi-family units
County records classify this as Multi-Family (5+ Unit). Listing-text estimate: 8 units. confirmed
5+ unit building — per-unit beds/baths from public records are typically unavailable; the breakdown below (if shown) is an estimate from the listing text.
Listing remarks
Investment highlights: 5 turnkey 1-bed/1-bath units in a highly desirable coastal rental market. sq ft 520sq ft. to 700 sq ft. ALL UNITS ARE RENTED Prime Belmont Heights location near the beach, dining, and retail, supporting strong long-term tenant demand. Classic 1920s construction with character, updated interiors, and on-site parking (2 garages + 2 additional spaces). This asset offers solid in-place income with value-add potential through rent optimization, cosmetic improvements, and repositioning over time. ADU POTENTIAL Reach out to me for the more information. If you need financing I will put you in touch with a couple of lenders who will walk you through projected returns ba
Key facts
- Adu potential
- On-site parking
- Updated interiors
Tags
Property features AI
Finance
- Other: Total building area reported: 3,592 (unit of measure not shown); Lot features: 2-5 units per acre
- Financial info: Gross scheduled income: $10,950; Actual/total rent reported: $10,350; Gross income: $10,950; Net operating income: $8,128; Laundry income: $150; Operating expense: $2,822; Other expense: $75 (Fire); Pest control expense: $660; Licenses expense: $718; Insurance expense: $3,260; Electric expense: $47; New taxes expense: $26,257; Property is subject to rent control
- HOA & community: Community features: street lighting, storm drains, sidewalks, park
Exterior
- Parking: Two garage spaces; Two uncovered parking spaces; Assigned parking; Built-in storage in parking; Total of four parking spaces; Two rented garages
- Utilities: Public/District water; Public sewer; Standard electric service; Telephone and cable available and connected; Separate water, gas, and electric meters for each unit (5 separate meters)
- Home design: Attached community apartment (multi-unit building); Two stories; One building with five total units; Common wall: 1 common wall; Entry level: 1
- Construction: Year built from assessor (year not shown)
- Exterior features: No pool
Interior
- Kitchen: Gas cooktop; Microwave; Built-in range; Gas oven; All units include range and refrigerator (5 units)
- Bedrooms: Five total bedrooms (unit-level breakdown not shown)
- Bathrooms: Five full bathrooms (unit-level breakdown not shown)
- Heating & cooling: Space heater(s); Wall/window cooling units
- Interior features: Unfurnished; Storage space; Two levels
- Laundry & utility: Laundry area; Laundry income from on-site machines
Neighborhood map
What this means for you Summary
Snapshot
- This is a 8 × 3-bed/3.1-bath units multifamily listed at $1.95M.
Deal economics
- At list price, monthly cash flow is $4k ($51k/yr) — positive. Per door: $534/mo.
- The deal already cash-flows at list — no discount required.
- Meets the 1% rule at list price ($21k rent vs $1.95M).
- Cap rate 8.9% vs local median 1.9% in Long Beach — top-decile yield for the area; either an underpriced asset or a hidden risk that comps aren't pricing in. Stress-test before assuming the spread holds.
Location & tenants
- Location reads 67/100 on livability (#319 in CA) — a middle-class / working-renter tenant base. Strengths: amenities A+, commute A+, employment B+; Watch: health & safety C-, crime F, cost of living F.
- Long Beach Unified (urban): math 34% / reading 50% proficiency, ranked #216 of 517 in CA (top 42%) — families likely to look elsewhere, expect single-tenant / working-renter base with shorter leases.
- Market conditions: Rents rising (+1.7%/yr); 135 active listings in the ZIP; 5 comparable units currently listed for rent nearby; rentals lingering (median 44d on market — plan ~5-8 weeks vacancy on turnover, expect pricing pressure); 60% of comp listings sitting > 30 days — soft ceiling on asking rent; high-income renter base; 19,697 units permitted in Los Angeles County in 2024 (9,426 in 5+ unit buildings).
- At $20,795/mo this rent would consume 218% of the median local household income ($115k/yr) (locally 1537% of renters already pay >50% of income on rent) — very limited rent-growth headroom before tenants either downsize or default.
Forward outlook
- Local home prices are declining (-3.0%/yr); year-one equity from $13k of loan paydown is wiped out by about $58k of value loss. Plan a longer hold.
- Los Angeles County population projected at +9% by 2050 — modest demand growth; plan on rents tracking national, not racing it.
Negotiation context
- Only 14 days on market — expect competitive offers; lowballing is unlikely to land.
- 10 sale attempts since 20y ago with the ask held roughly flat each time — persistent listings suggest the price (not the market) is what's stuck; bring a comps-based counter.
- Current owner paid $810k; list at $1.95M implies a 140% gain — meaningful room to come down on a strong offer.
Risks & watch-outs
- Watch-outs: built in 1922 — expect roof / HVAC / electrical / plumbing capex.
Questions for the listing agent
- Can we see the unit-by-unit rent roll, current vacancy, and any below-market leases? What's the average tenancy length?
- What capital expenditures (roof, boiler, parking lot, exteriors) have been made in the last 5 years, and what's planned in the next 2?
- Built in 1922 — when were the roof, HVAC, electrical panel, plumbing, and water heater last replaced?
- Is there a deadline driving the sale (1031 exchange, divorce, estate, relocation)? That informs how much negotiation room exists.
- Crime grade is F in this area — have there been break-ins, vandalism, or insurance claims at this property in the last 3 years? What carrier currently insures it and at what premium?
- What's the average days-on-market for RENTAL listings here right now (not sales)? A rising rental-DOM trend means longer vacancies and softer asking-rent achievability than the comps imply.
- What's the recent tenant-quality profile in this submarket — average credit score on applications, eviction rate, late-payment / NSF rate, and stable-employment percentage? A property-management company in the area should have these aggregated.
- How much new apartment / multifamily construction is in the pipeline within 1–3 miles? Heavy new supply (>2% of stock underway) typically softens rents 12–24 months out; light construction supports rent growth.
Investment metrics
- 1% rule
- 1.07% ✓
- Cap rate
- 8.93%
- Cash-on-cash
- 9.42%
- DSCR
- 1.42
- GRM
- 7.8
CMA / ARV
- ARV (on-the-fly)
- $1,790,208
- Comps found
- 12
Show comp detail 12 sales within ~0.75 mi
| Address | Dist | Beds/Ba | Sqft | Sold | Price | $/sf | Match |
|---|---|---|---|---|---|---|---|
| 254 Newport Ave | 0.34mi | 4/4.0 | 2,893 (-4%) | 12mo | $1,660,000 | $574 | 67 |
| 150 Saint Joseph | 0.57mi | 4/5.0 | 2,966 (-2%) | 1mo | $1,850,000 | $624 | 66 |
| 101 Argonne | 0.59mi | 4/3.5 | 3,028 (+0%) | 7mo | $2,300,000 | $760 | 65 |
| 24 Roswell | 0.29mi | 3/5.0 (-1) | 2,780 (-8%) | 3mo | $1,875,000 | $674 | 62 |
| 223 Bennett | 0.26mi | 5/2.0 (+1) | 3,240 (+7%) | 3mo | $1,660,000 | $512 | 60 |
| 208 Park Ave | 0.57mi | 4/— | 3,046 (+1%) | 15mo | $1,550,000 | $509 | 60 |
| 262 Euclid Ave | 0.31mi | 5/4.0 (+1) | 2,813 (-7%) | 15mo | $1,930,000 | $686 | 56 |
| 118 Roycroft Ave | 0.48mi | 5/3.0 (+1) | 2,722 (-10%) | 2mo | $1,610,000 | $591 | 50 |
| 4112 E 5th St | 0.68mi | 5/3.0 (+1) | 2,992 (-1%) | 12mo | $1,542,000 | $515 | 48 |
| 132 St Joseph Ave | 0.57mi | 4/2.0 | 2,745 (-9%) | 9mo | $1,625,000 | $592 | 43 |
| 268 Park Ave | 0.62mi | 4/3.5 | 2,715 (-10%) | 14mo | $1,950,000 | $718 | 40 |
| 338 Prospect Ave | 0.60mi | 5/3.0 (+1) | 2,674 (-12%) | 9mo | $1,561,000 | $584 | 36 |
Match score weights: distance 35% · size 25% · config 20% · recency 20%. Top-matched comps best support the ARV.
Projected returns pro-forma
-3.0% appreciation · 1.68% rent growth · sell at horizon
- IRR
- -3.5%
- Equity multiple
- 0.87×
- Total profit
- $-70,665
- Equity at exit
- $290,006
- IRR
- 4.7%
- Equity multiple
- 1.33×
- Total profit
- $178,155
- Equity at exit
- $168,168
Cash invested: $544,600 (down + closing). Projections, not guarantees.
Landlord ↔ Tenant lean methodology
- Overall (STATE)
- 18 Strongly Tenant-Friendly
- State California
- 18 Strongly Tenant-Friendly · D+13
- County
- — inherits STATE
- City
- — inherits STATE
ZIP-level market 90803
- Rents YoY
- 1.7%
- Active inventory
- 135
- Price-to-rent
- 62.4×
Monthly cashflow live
- Estimated rent
- $20,795 medium interval (Pro) →
- Mortgage (P&I)
- −$10,200
- Tax from tax record
- −$1,143 /mo · $13,720/yr
- Insurance
- −$810
- HOA
- −$0
- Vacancy / Maint / Mgmt
- −$4,367
- Net cashflow
- $4,275
Break-even live
8-unit breakdown (identical units grouped — click to expand)
| Units | Beds | Baths | Est. rent |
|---|---|---|---|
| 8× units | 3 | 3.1 | $20,792 |
| #1 | 3 | 3.1 | $2,599 |
| #2 | 3 | 3.1 | $2,599 |
| #3 | 3 | 3.1 | $2,599 |
| #4 | 3 | 3.1 | $2,599 |
| #5 | 3 | 3.1 | $2,599 |
| #6 | 3 | 3.1 | $2,599 |
| #7 | 3 | 3.1 | $2,599 |
| #8 | 3 | 3.1 | $2,599 |
| Total (8 units) | $20,795 | ||
UW: 25.0% down · 7.5% · 30yr · 1.5% tax · 5.0% vac · 8.0% maint · 8.0% mgmt
Financing live
Cash to close
- Down payment
- $486,250
- Closing costs
- $58,350
- Reserves months
- —
- Total cash needed
- —
Loan-product check · same deal, 3 products live
Conventional
25% down · 7.5% · 30yr
- Down + closing
- —
- Monthly P&I
- —
- Monthly cashflow
- —
- DSCR
- —
- Eligible?
- —
Personal DTI + credit; lowest rate.
DSCR
20% down · 8.5% · 30yr
- Down + closing
- —
- Monthly P&I
- —
- Monthly cashflow
- —
- DSCR
- —
- Eligible?
- —
No personal income docs; deal must DSCR.
Hard money
10% down · 12.0% · 12mo
- Down + closing
- —
- Monthly P&I
- —
- Monthly cashflow
- —
- DSCR
- —
- Eligible?
- —
Short-term bridge; refi at stabilization.
Rent comps 5 comps
| Address | Beds | Baths | Sqft | Rent | $/sqft | DOM | Units | Dist |
|---|---|---|---|---|---|---|---|---|
| 386 Orlena Ave Long Beach, CA | 4.0 | 4.0 | 2948 | $8,500 | $2.88 | 44d | 1 | 1.11mi |
| 927 Freeman Ave Long Beach, CA | 4.0 | 4.0 | 2300 | $5,700 | $2.48 | 5d | 1 | 1.19mi |
| 13 Rivo Alto Canal Long Beach, CA | 3.0 | 3.5 | 2246 | $10,800 | $4.81 | 19d | 1 | 1.33mi |
| 1724 Bluff Pl Long Beach, CA | 4.0 | 3.5 | 3100 | $16,500 | $5.32 | 44d | 1 | 1.43mi |
| 309 La Jolla St Long Beach, CA | 3.0 | 3.0 | 2325 | $7,995 | $3.44 | 44d | 1 | 1.49mi |
Listing history 10 events
-
2026-06-18days on market $1,945,000 Active 14 DOM
-
2026-06-17days on market $1,945,000 Active 13 DOM
-
2026-06-16days on market $1,945,000 Active 12 DOM
-
2026-06-15days on market $1,945,000 Active 11 DOM
-
2026-06-13days on market $1,945,000 Active 9 DOM
-
2026-06-13days on market $1,945,000 Active 8 DOM
-
2026-06-09days on market $1,945,000 Active 5 DOM
-
2026-06-08days on market $1,945,000 Active 4 DOM
-
2026-06-07remarks 699-char remark
-
2026-06-07$1,945,000 Active 3 DOM
ⓘ Source: listings_history table (triggers on properties + properties_extension) + one-shot
backfill from property_details.listing_events for pre-trigger history.
Tax reassessment forecast CA · Resets to sale price
- Current annual tax
- $13,720 · $1,143/mo
- Projected year-2 tax
- $14,782 · $1,232/mo
- Expected delta
- +$1,062/yr (+$89/mo · 7.7%)
ⓘ Screening estimate from a state-policy table — verify with the county assessor before closing.
Climate risk First Street
- Flood 1/10 Low FEMA zone X (unshaded) · 0% chance over 30 yrs
- Wildfire 1/10 Low
- Heat 4/10 Moderate 7 d/yr ≥86°F today · 23 d/yr by 30 yrs out
- Wind 1/10 Low
- Air quality 5/10 Major 7 unhealthy d/yr today · 9 by 30 yrs out
Nearby sold comps map
Loading sold comps map…
Walkable amenities ~0.75 mi
Loading nearby amenities…
Taxation est. · year 1
- Rental income
- $249,540
- − Mortgage interest
- −$108,950
- − Property taxes
- −$13,720
- − Insurance
- −$9,725
- − Repairs & maintenance
- −$19,963
- − Management
- −$19,963
- − Depreciation
- −$56,582
- Taxable income
- $20,637
- Est. tax owed @ 24.0%
- −$4,953
- After-tax cash flow
- $46,342/yr
For passive investors: Depreciation is non-cash, so a rental often shows a tax loss while cash-flowing — sheltering income. Rental losses are passive: they offset passive income freely, and up to $25,000/yr can offset ordinary (W-2) income if you actively participate and your MAGI is under $100k (phasing out to $0 by $150k); unused losses carry forward. On sale, claimed depreciation is recaptured at up to 25%, and gains may owe capital-gains tax (a 1031 exchange can defer both). Figures are a year-1 estimate at your 24.0% rate — not tax advice; consult a CPA.
Schools (NCES district)
- District
- Long Beach Unified
- NCES district ID
- 0622500
- Math proficiency
- 34% ▼ -11.00%
- Reading proficiency
- 50% ▼ -4.00%
- Median HH income
- $56,092
- Composite
- 36.67/100
- National rank
- #4607
- State rank
- #216 of 517 in CA
Livability — Long Beach
- Score
- 67/100
- State rank
- #319
- US rank
- #10758
Category grades
Schools grade is shown separately in the Schools card above.
Census & demographics
- Census place
- Long Beach, CA
- County
- Los Angeles County · 9,444,647 people
- City population
- 466,088
- Metro
- Los Angeles-Long Beach-Anaheim, CA
- Population (ZIP)
- 31,526
- Household income
- $114,656
- Rent vs Own
- Severe rent burden
- 1537.0
Population outlook (Los Angeles County) Hauer SSP2
- Today (2025)
- 10,940,515 people
- By 2030
- 11,256,481 · +2.9%
- By 2040
- 11,729,929 · +7.2%
- By 2050
- 11,948,407 · +9.2%
- By 2075
- 11,818,114 · +8.0%
- By 2100
- 10,842,928 · -0.9%
Race, ethnicity, and origin ACS 2023
- Neighborhood character
- Majority White (65%)
- Race & ethnicity
- White 65% Hispanic / Latino 19% Two or more races 10% Asian 6% Black 3% Native American 1% Pacific Islander 1%
- Hispanic origin (detail)
- Mexican 12%
- Common ancestry
- Italian 3% Romanian 3% Lithuanian 2%
- Foreign-born
- 14% · Canada, China, Jamaica
- Languages at home
- 84% English-only · Spanish 9% Other Asian/Pacific 2% Tagalog/Filipino 1%
Political lean MEDSL · Los Angeles
- 2024 margin
- Solid D (+32.9) · D 64.8% · R 31.9% · Other 3.3%
- 2008→2024 swing
- -7.4pp toward R · 2008: 40.4pp · 2024: 32.9pp
- All cycles
- 2024: D+32.9 2020: D+44.2 2016: D+48.0 2012: D+40.0 2008: D+40.4
Not yet ingested
- Civics
- —
Market trends
- HPI YoY
- ▼ -634.69%
- Current HPI
- 377.3105
- Rent YoY
- ▲ 1.68%
- Metro
- Los Angeles-Long Beach-Anaheim, CA
- State GDP YoY
- ▲ 3.21%
- F500 in state
- 116
Industry mix (Fortune 500 HQ in CA)
| Industry | F500 HQs | Revenue |
|---|---|---|
| Technology | 27 | $1,492B |
|
||
| Financial Services | 3 | $174B |
|
||
| Retail | 3 | $44B |
|
||
| Insurance | 3 | $26B |
|
||
| Media / Entertainment | 2 | $115B |
|
||
| Pharmaceuticals / Biotech | 2 | $62B |
|
||
Price history
+69.1% since first listed25 events — show timeline
- 2026-06-04 Listed $1,945,000 CRMLS
- 2026-04-03 Listing Removed — CRMLS
- 2025-10-17 Listed $2,099,000 CRMLS
- 2025-10-10 Listing Removed — CRMLS
- 2025-08-28 Relisted — CRMLS
- 2025-07-20 Price Changed $2,150,000 CRMLS
- 2025-07-02 Listed $2,250,000 CRMLS
- 2013-01-25 Listed $810,000 CRMLS
- 2013-01-25 Sold (MLS) $810,000 CRMLS
- 2011-09-30 Listing Removed — CRMLS
- 2011-09-22 Price Changed $848,500 CRMLS
- 2011-08-24 Price Changed $849,000 CRMLS
- 2011-08-15 Price Changed $849,900 CRMLS
- 2011-07-25 Price Changed $856,000 CRMLS
- 2011-06-25 Listed $859,000 CRMLS
- 2010-12-02 Listing Removed — CRMLS
- 2010-08-06 Listed $890,000 CRMLS
- 2010-05-04 Listing Removed — CRMLS
- 2010-04-05 Price Changed $899,000 CRMLS
- 2010-02-11 Price Changed $899,500 CRMLS
- 2009-10-17 Listed $899,900 CRMLS
- 2008-09-02 Listing Removed — CRMLS
- 2008-07-22 Listed $1,080,000 CRMLS
- 2006-10-16 Listing Removed — CRMLS
- 2006-03-09 Listed $1,149,900 CRMLS
Property tax history
+5.0%/yrLatest (2025): $13,720 · +4.6% YoY. Source: county tax records.
Cash-flow waterfall
monthlySold comps — $/sqft
last 12 mo · ≤1 miLoading sold comps…