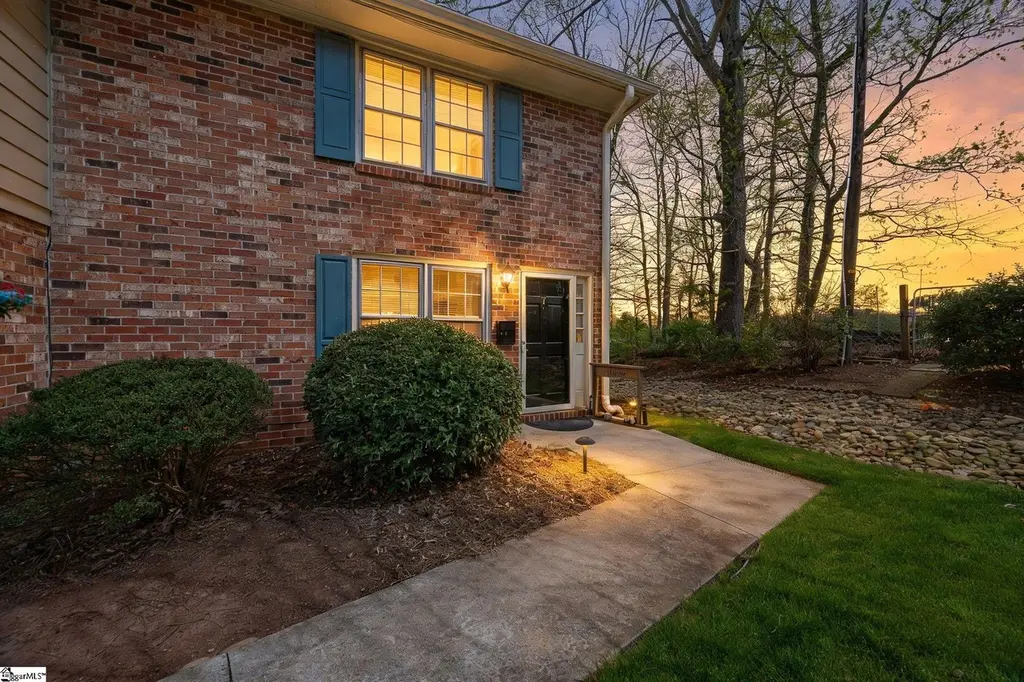
710 Hunts Bridge Rd Unit 6 · Berea, SC
Flood risk 1/10 · Minimal
- FEMA flood zone
- X (unshaded)
- Chance of flooding over 30 yrs
- 0.0%
- Est. flood insurance / yr
- $507 – $1,088
Fire risk 4/10 · Minor
- Est. fire insurance / yr
- $783 – $1,453
Heat risk 6/10 · Moderate
- Hot days now (above 103°F)
- 7 days/yr
- Hot days in 30 yrs
- 17 days/yr
Wind risk 2/10 · Minimal
- Chance of severe wind over 30 yrs
- 0.0%
Air-quality risk 4/10 · Minor
- Unhealthy air days now
- 3 days/yr
- Unhealthy air days in 30 yrs
- 4 days/yr
Risk factors via First Street. Map © Google.
Why this score? — see what drove the D grade
The composite is a weighted blend of 9 inputs, each scored 0–100. Each bar is that input's sub-score; the figure is the points it added to the 100-point composite (weight × sub-score).
- Cash flow +15.0/30.0
- ARV discount +7.5/15.0
- DSCR +4.6/10.0
- Schools +4.2/10.0
- 1% rule +3.9/10.0
- Livability +3.6/5.0
- Rent growth +2.8/5.0
- Condition / age +2.5/5.0
- Appreciation +0.0/10.0
$174,900
🖨 Deal sheet (PDF) 📄 Offer letter ✓ Due diligence
Listing remarks
Location, Lifestyle & Potential — Welcome to Bridgeview Condos Welcome to this 2-bedroom, 1.5-bath end-unit condo located in the desirable Bridgeview Condos community in Greenville (29617)—offering a rare combination of privacy, convenience, and opportunity. This end unit provides added natural light and a more private feel, along with a fenced-in back patio, perfect for relaxing, entertaining, or enjoying a low-maintenance outdoor space. Inside, the home offers a functional layout with spacious living areas and well-sized bedrooms. While the interior could benefit from some updates, it presents a great opportunity for a buyer to add value, personalize the space, and crea
Key facts
- Fenced in back patio
- Natural light
- $133 HOA
Tags
Property features AI
Finance
- Other: Community amenities include clubhouse, lights, playground, pool, and landscape maintenance
- HOA & community: Community has an HOA; HOA covers exterior maintenance, lawn maintenance, pool, street lights, trash service, termite contract, parking, and enforces by-laws and restrictive covenants
Exterior
- Parking: Assigned parking (1 space); Paved asphalt driveway
- Utilities: Public water; Electric water heater; Public sewer; Private garbage pickup
- Home design: Two-story home; Approximate age: 31–50 years; Attic storage
- Construction: Architectural roof; Slab foundation
- Exterior features: Fenced yard; Level lot; Brick veneer (full)
Interior
- Kitchen: Kitchen approx. 10 x 7; Dishwasher; Electric freestanding range
- Bedrooms: Primary bedroom on 2nd level with full bath and tub/shower (primary approx. 20 x 11); Second bedroom approx. 14 x 10
- Flooring: Carpet; Vinyl; Luxury vinyl tile/plank
- Bathrooms: One full bathroom; One half bathroom
- Heating & cooling: Forced air heating; Heat pump; Central electric cooling; Attic fan
- Interior features: Ceiling fans; Blown ceiling insulation; Laminate countertops; No fireplace
- Laundry & utility: Laundry on 1st floor with walk-in area
Neighborhood map
What this means for you Summary
Snapshot
- This is a 2-bed/1.5-bath condo listed at $175k.
Deal economics
- At list price, monthly cash flow is $54 ($653/yr) — positive.
- The deal already cash-flows at list — no discount required.
- To meet the 1% rule (rent ≥ 1% of price), the offer needs to be $155k (11.1% below list).
- Recommended offer: $155k (11.1% below list) — sets the bar for 1% rule.
- Cap rate 6.7% vs local median 3.9% in Berea — top-decile yield for the area; either an underpriced asset or a hidden risk that comps aren't pricing in. Stress-test before assuming the spread holds.
Location & tenants
- Location reads 72/100 on livability (#44 in SC) — a middle-class / working-renter tenant base. Strengths: cost of living A+, housing A+, commute A; Watch: crime F, amenities F, employment F.
- Greenville 01 (suburban): math 44% / reading 54% proficiency, ranked #10 of 80 in SC (top 12%) — families likely to look elsewhere, expect single-tenant / working-renter base with shorter leases.
- Zoned schools: Armstrong Elementary (math 37% / reading 32%, grade F, #344 of 597 statewide, top 60%, 380 students, 100% FRL) — zoned schools average 100% FRL vs 42% district-wide (58 pts higher); higher-poverty schools than district average — tighter screening recommended.
- Zoned-school proficiency averages 34% at this address vs 49% district-wide (-14 pts) — the specific schools serving this property underperform the Greenville 01 average; the district grade overstates school quality for this exact location.
- Market conditions: Rents rising (+1.2%/yr); 173 active listings in the ZIP; 9 comparable units currently listed for rent nearby; rentals leasing fast (median 14d on market — plan ~1-2 weeks tenant-placement turnaround); 5,595 units permitted in Greenville County in 2024 (566 in 5+ unit buildings).
- This rent runs 34% of the median local income ($55k/yr) — at the standard rent-burdened threshold; future hikes will face affordability resistance.
Forward outlook
- Local home prices are declining (-3.0%/yr); year-one equity from $1k of loan paydown is wiped out by about $5k of value loss. Plan a longer hold.
- Greenville County population projected at +34% by 2050 — long-run rental-demand tailwind backs the buy-and-hold thesis.
Negotiation context
- It's been on market 84 days — a 6% lower offer ($164k) is reasonable based on typical stale-listing flexibility.
- Current owner paid $90k; list at $175k implies a 93% gain — meaningful room to come down on a strong offer.
Risks & watch-outs
- Climate carrying-cost: extreme-heat days projected 7→17/yr by 2055 (HVAC capex compounding) — expect insurance premiums to compound above CPI over the hold.
Questions for the listing agent
- It's been on market 84 days. Have you received any prior offers? Is the seller open to a 11% concession, seller financing, or rate buy-down credit?
- Built in 1973 — when were the roof, HVAC, electrical panel, plumbing, and water heater last replaced?
- What does the HOA fee cover, when was the last increase, and are there any pending special assessments or reserve-fund shortfalls?
- Any open or pending special assessments — roof, HVAC, plumbing, elevator, façade? What's the per-unit balance and payoff schedule, and is the seller paying it off at close or rolling it to the buyer?
- Why hasn't it sold? Are there any deal-killer items the seller is aware of (foundation, flood, title, zoning, code violations)?
- Is there a deadline driving the sale (1031 exchange, divorce, estate, relocation)? That informs how much negotiation room exists.
- Schools are D-rated, which usually means shorter tenancies and higher turnover. Who's the typical renter profile here, and what's been the actual vacancy rate?
- Crime grade is F in this area — have there been break-ins, vandalism, or insurance claims at this property in the last 3 years? What carrier currently insures it and at what premium?
- The area grade is low — what's the realistic commute time and amenity access for the typical tenant pool here? Any planned neighborhood developments (good or bad) we should know about?
- What's the average days-on-market for RENTAL listings here right now (not sales)? A rising rental-DOM trend means longer vacancies and softer asking-rent achievability than the comps imply.
- What's the recent tenant-quality profile in this submarket — average credit score on applications, eviction rate, late-payment / NSF rate, and stable-employment percentage? A property-management company in the area should have these aggregated.
- How much new apartment / multifamily construction is in the pipeline within 1–3 miles? Heavy new supply (>2% of stock underway) typically softens rents 12–24 months out; light construction supports rent growth.
Investment metrics
- 1% rule
- 0.89% ✗
- Cap rate
- 6.67%
- Cash-on-cash
- 1.33%
- DSCR
- 1.06
- GRM
- 9.4
CMA / ARV
No comps found within radius.
Projected returns pro-forma
-3.0% appreciation · 1.22% rent growth · sell at horizon
- IRR
- -16.1%
- Equity multiple
- 0.44×
- Total profit
- $-27,612
- Equity at exit
- $26,078
- IRR
- -11.2%
- Equity multiple
- 0.38×
- Total profit
- $-30,408
- Equity at exit
- $15,122
Cash invested: $48,972 (down + closing). Projections, not guarantees.
Landlord ↔ Tenant lean methodology
- Overall (STATE)
- 90 Strongly Landlord-Friendly
- State South Carolina
- 90 Strongly Landlord-Friendly · R+6
- County
- — inherits STATE
- City
- — inherits STATE
ZIP-level market 29617
- Rents YoY
- 1.2%
- Active inventory
- 173
- Price-to-rent
- 9.4×
Monthly cashflow live
- Estimated rent
- $1,555 high interval (Pro) →
- Mortgage (P&I)
- −$917
- Tax from tax record
- −$51 /mo · $608/yr
- Insurance
- −$73
- HOA
- −$133
- Vacancy / Maint / Mgmt
- −$326
- Net cashflow
- $54
Break-even live
Sensitivity live
| Price | -10% $153 | -5% $104 | +0% $54 | +5% $5 | +10% $-45 |
|---|---|---|---|---|---|
| Rent | -10% $-68 | -5% $-7 | +0% $54 | +5% $116 | +10% $177 |
| Rate | -1.0pp $142 | -0.5pp $99 | base $54 | +0.5pp $9 | +1.0pp $-37 |
UW: 25.0% down · 7.5% · 30yr · 1.5% tax · 5.0% vac · 8.0% maint · 8.0% mgmt
Financing live
Cash to close
- Down payment
- $43,725
- Closing costs
- $5,247
- Reserves months
- —
- Total cash needed
- —
Loan-product check · same deal, 3 products live
Conventional
25% down · 7.5% · 30yr
- Down + closing
- —
- Monthly P&I
- —
- Monthly cashflow
- —
- DSCR
- —
- Eligible?
- —
Personal DTI + credit; lowest rate.
DSCR
20% down · 8.5% · 30yr
- Down + closing
- —
- Monthly P&I
- —
- Monthly cashflow
- —
- DSCR
- —
- Eligible?
- —
No personal income docs; deal must DSCR.
Hard money
10% down · 12.0% · 12mo
- Down + closing
- —
- Monthly P&I
- —
- Monthly cashflow
- —
- DSCR
- —
- Eligible?
- —
Short-term bridge; refi at stabilization.
Rent comps 9 comps
| Address | Beds | Baths | Sqft | Rent | $/sqft | DOM | Units | Dist |
|---|---|---|---|---|---|---|---|---|
| 8699 White Horse Rd Greenville, SC | 3.0 | 2.0 | 1159 | $1,700 | $1.47 | 16d | 1 | 0.44mi |
| 6001 Jacks Lookout Rd Greenville, SC | 1.0–4.0 | 1.0–2.0 | 1229 | $1,325 | $1.08 | 4d | 1 | 0.63mi |
| 10 Torrington Dr Greenville, SC | 3.0 | 2.5 | 1440 | $2,100 | $1.46 | 13d | 1 | 0.69mi |
| 231 Berea Forest Cir Unit A Greenville, SC | 2.0 | 1.0 | 825 | $1,150 | $1.39 | 25d | 1 | 0.73mi |
| 320 Maplestead Farms Ct Greenville, SC | 3.0 | 2.5 | 1440 | $1,850 | $1.28 | 5d | 1 | 0.74mi |
| 300 Sulphur Springs Rd Greenville, SC | 1.0–2.0 | 1.0 | 785 | $1,095 | $1.39 | 25d | 1 | 0.89mi |
| 225 Telford Dr Greenville, SC | 3.0 | 2.5 | 1429 | $1,545 | $1.08 | 25d | 1 | 1.07mi |
| 10 Frazier RD Greenville, SC | 2.0 | 2.0 | 1054 | $1,199 | $1.14 | 4d | 1 | 1.21mi |
| 316 Glover Cir Greenville, SC | 2.0–5.0 | 2.5 | 1841 | $1,699 | $0.92 | 4d | 19 | 1.24mi |
HOA detail condo
- Monthly dues
- $133 · $1,596/yr
- Assessments
- None detected in remarks — confirm with the listing agent.
Listing history 19 events
-
2026-06-22days on market $174,900 Active 84 DOM
-
2026-06-18days on market $174,900 Active 81 DOM
-
2026-06-17days on market $174,900 Active 80 DOM
-
2026-06-16days on market $174,900 Active 79 DOM
-
2026-06-15days on market $174,900 Active 78 DOM
-
2026-06-13days on market $174,900 Active 76 DOM
-
2026-06-13days on market $174,900 Active 75 DOM
-
2026-06-10days on market $174,900 Active 73 DOM
-
2026-06-09days on market $174,900 Active 72 DOM
-
2026-06-08days on market $174,900 Active 71 DOM
-
2026-06-07days on market $174,900 Active 70 DOM
-
2026-06-03days on market $174,900 Active 66 DOM
-
2026-06-03days on market $174,900 Active 65 DOM
-
2026-06-01days on market $174,900 Active 64 DOM
-
2026-05-31days on market $174,900 Active 63 DOM
-
2026-04-30historical Contingency Contract
-
2026-03-29$174,900 Active
-
2018-07-06soldstatus $90,500
-
1983-06-28soldstatus $42,000
ⓘ Source: listings_history table (triggers on properties + properties_extension) + one-shot
backfill from property_details.listing_events for pre-trigger history.
Tax reassessment forecast SC · Resets to sale price
- Current annual tax
- $608 · $51/mo
- Projected year-2 tax
- $997 · $83/mo
- Expected delta
- +$389/yr (+$32/mo · 64.0%)
ⓘ Screening estimate from a state-policy table — verify with the county assessor before closing.
Climate risk First Street
- Flood 1/10 Low FEMA zone X (unshaded) · 0% chance over 30 yrs
- Wildfire 4/10 Moderate
- Heat 6/10 Major 7 d/yr ≥103°F today · 17 d/yr by 30 yrs out
- Wind 2/10 Low 0% chance of damaging wind over 30 yrs
- Air quality 4/10 Moderate 3 unhealthy d/yr today · 4 by 30 yrs out
Nearby sold comps map
Loading sold comps map…
Walkable amenities ~0.75 mi
Loading nearby amenities…
Taxation est. · year 1
- Rental income
- $18,655
- − Mortgage interest
- −$9,797
- − Property taxes
- −$608
- − Insurance
- −$874
- − Repairs & maintenance
- −$1,492
- − Management
- −$1,492
- − HOA
- −$1,596
- − Depreciation
- −$5,088
- Taxable loss
- −$2,294
- Est. tax savings @ 24.0%
- +$550
- After-tax cash flow
- $1,203/yr
For passive investors: Depreciation is non-cash, so a rental often shows a tax loss while cash-flowing — sheltering income. Rental losses are passive: they offset passive income freely, and up to $25,000/yr can offset ordinary (W-2) income if you actively participate and your MAGI is under $100k (phasing out to $0 by $150k); unused losses carry forward. On sale, claimed depreciation is recaptured at up to 25%, and gains may owe capital-gains tax (a 1031 exchange can defer both). Figures are a year-1 estimate at your 24.0% rate — not tax advice; consult a CPA.
Schools (NCES district)
- District
- Greenville 01
- NCES district ID
- 4502310
- Math proficiency
- 44% ▼ -10.00%
- Reading proficiency
- 54% ▼ -2.00%
- Median HH income
- $49,596
- Composite
- 41.88/100
- National rank
- #3370
- State rank
- #10 of 80 in SC
Livability — Berea
- Score
- 72/100
- State rank
- #44
- US rank
- #6173
Category grades
Schools grade is shown separately in the Schools card above.
Census & demographics
- Census place
- Berea, SC
- County
- Greenville County · 573,815 people
- Metro
- Greenville-Anderson, SC
- Population (ZIP)
- 26,582
- Household income
- $55,403
- Rent vs Own
- Severe rent burden
- 1209.0
Population outlook (Greenville County) Hauer SSP2
- Today (2025)
- 574,580 people
- By 2030
- 615,615 · +7.1%
- By 2040
- 695,373 · +21.0%
- By 2050
- 769,367 · +33.9%
- By 2075
- 933,296 · +62.4%
- By 2100
- 1,029,196 · +79.1%
Race, ethnicity, and origin ACS 2023
- Neighborhood character
- Diverse neighborhood (Simpson 0.60)
- Race & ethnicity
- White 56% Hispanic / Latino 28% Black 13% Two or more races 10% Native American 2% Asian 1%
- Hispanic origin (detail)
- Mexican 10% Puerto Rican 2%
- Common ancestry
- Slovak 3% Serbian 2% Lithuanian 2%
- Foreign-born
- 17% · Canada, Jamaica, Guatemala
- Languages at home
- 74% English-only · Spanish 23% Other Indo-European 1%
Political lean MEDSL · Greenville
- 2024 margin
- Strong R (+22.2) · D 38.0% · R 60.2% · Other 1.8%
- 2008→2024 swing
- +1.7pp toward D · 2008: -23.9pp · 2024: -22.2pp
- All cycles
- 2024: R+22.2 2020: R+18.2 2016: R+24.7 2012: R+27.8 2008: R+23.9
Not yet ingested
- Civics
- —
Market trends
- HPI YoY
- ▼ -194.04%
- Current HPI
- 238.8343
- Rent YoY
- ▲ 1.22%
- Metro
- Greenville-Anderson, SC
- State GDP YoY
- ▲ 4.51%
- F500 in state
- 2
Industry mix (Fortune 500 HQ in SC)
| Industry | F500 HQs | Revenue |
|---|---|---|
| Packaging | 1 | $7B |
|
||
Price history
+316.4% since first listed4 events — show timeline
- 2026-04-30 Contingent — Greater Greenville MLS
- 2026-03-29 Listed $174,900 Greater Greenville MLS
- 2018-07-06 Sold (Public Records) $90,500 Public Records
- 1983-06-28 Sold (Public Records) $42,000 Public Records
Property tax history
+3.4%/yrLatest (2025): $608 · +13.2% YoY. Source: county tax records.
Cash-flow waterfall
monthlySold comps — $/sqft
last 12 mo · ≤1 miLoading sold comps…