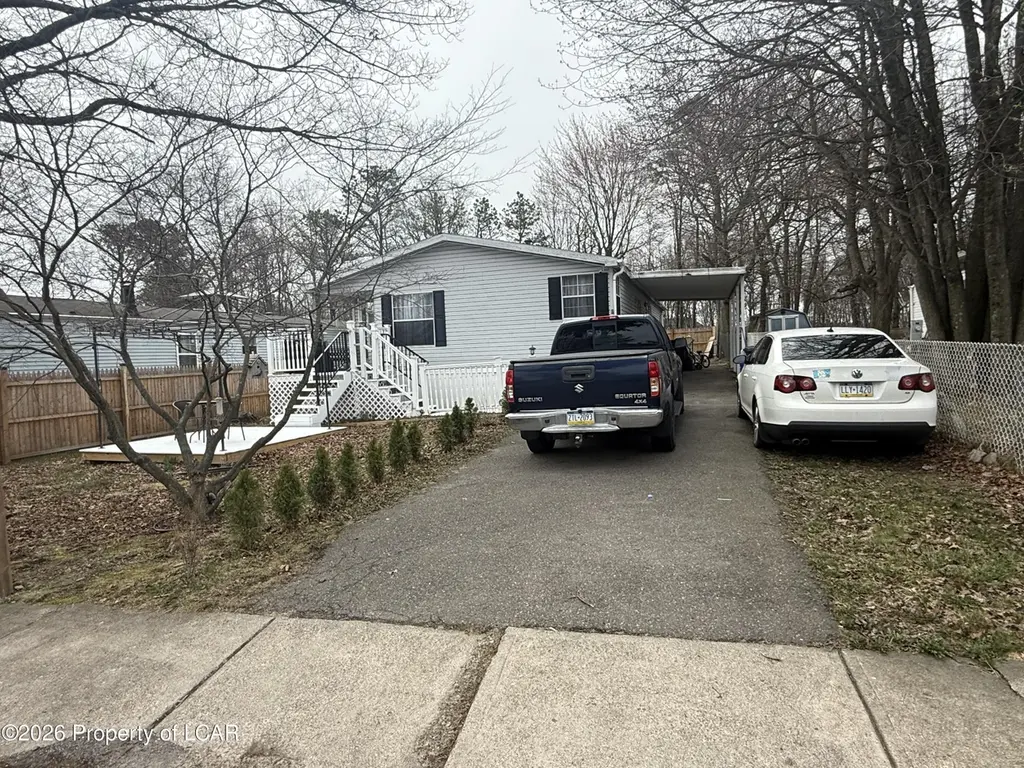
118 Pine Tree Rd · Hazleton, PA
Flood risk 1/10 · Minimal
- FEMA flood zone
- X (unshaded)
- Chance of flooding over 30 yrs
- 0.0%
- Est. flood insurance / yr
- $507 – $1,088
Fire risk 3/10 · Minor
- Est. fire insurance / yr
- $511 – $949
Heat risk 2/10 · Minimal
- Hot days now (above 91°F)
- 7 days/yr
- Hot days in 30 yrs
- 15 days/yr
Wind risk 3/10 · Minor
- Chance of severe wind over 30 yrs
- 7.0%
Air-quality risk 2/10 · Minimal
- Unhealthy air days now
- 0 days/yr
- Unhealthy air days in 30 yrs
- 1 days/yr
Risk factors via First Street. Map © Google.
Why this score? — see what drove the D grade
The composite is a weighted blend of 9 inputs, each scored 0–100. Each bar is that input's sub-score; the figure is the points it added to the 100-point composite (weight × sub-score).
- Cash flow +14.6/30.0
- ARV discount +12.2/15.0
- DSCR +4.5/10.0
- Livability +3.4/5.0
- 1% rule +3.1/10.0
- Rent growth +2.5/5.0
- Condition / age +2.5/5.0
- Schools +2.0/10.0
- Appreciation +0.0/10.0
$178,000
🖨 Deal sheet 📄 Offer letter ✓ Due diligence
Listing remarks MLS
Stunning 3 bedroom, 2 Bath double wide manufactured home. This Home features Central AC, Natural Gas Fenced yard and much more! Land included 45X110. In a convenient location 4 minutes from downtown Hazleton. Also, a great investment for passive income! Market rent ($1,300/Month or more) Schedule your private showing today!
Key facts
- Central ac
- Forced-air gas heat
- One-level living
Tags
Neighborhood map
What this means for you Summary
Snapshot
- This is a 3-bed/2.0-bath single-family listed at $178k.
Deal economics
- At list price, monthly cash flow is $43 ($511/yr) — positive.
- The deal already cash-flows at list — no discount required.
- To meet the 1% rule (rent ≥ 1% of price), the offer needs to be $145k (18.5% below list).
- Recommended offer: $145k (18.5% below list) — sets the bar for 1% rule.
- Cap rate 6.6% vs local median 4.5% in Hazleton — top-decile yield for the area; either an underpriced asset or a hidden risk that comps aren't pricing in. Stress-test before assuming the spread holds.
Location & tenants
- Location reads 67/100 on livability (#930 in PA) — a middle-class / working-renter tenant base. Strengths: cost of living A+, housing A+, crime A-; Watch: schools F, amenities F, commute F.
- Hazleton Area SD (suburban): math 18% / reading 30% proficiency, ranked #476 of 539 in PA (top 88%) — low school quality limits family demand, transient renter base, plan for 1-2y turnover.
- Market conditions: 118 active listings in the ZIP; 1 comparable units currently listed for rent nearby; 349 units permitted in Luzerne County in 2024 (16 in 5+ unit buildings).
Forward outlook
- Local home prices are declining (-3.0%/yr); year-one equity from $1k of loan paydown is wiped out by about $5k of value loss. Plan a longer hold.
- Luzerne County population projected at +4% by 2050 — modest demand growth; plan on rents tracking national, not racing it.
Negotiation context
- Only 7 days on market — expect competitive offers; lowballing is unlikely to land.
- 4 sale attempts since 4y ago with the ask held roughly flat each time — persistent listings suggest the price (not the market) is what's stuck; bring a comps-based counter.
- Current owner paid $130k; 37% above their basis — modest negotiation headroom, anchor on the comps not their cost.
Questions for the listing agent
- Is there a deadline driving the sale (1031 exchange, divorce, estate, relocation)? That informs how much negotiation room exists.
- Schools are F-rated, which usually means shorter tenancies and higher turnover. Who's the typical renter profile here, and what's been the actual vacancy rate?
- The area grade is low — what's the realistic commute time and amenity access for the typical tenant pool here? Any planned neighborhood developments (good or bad) we should know about?
- What's the average days-on-market for RENTAL listings here right now (not sales)? A rising rental-DOM trend means longer vacancies and softer asking-rent achievability than the comps imply.
- What's the recent tenant-quality profile in this submarket — average credit score on applications, eviction rate, late-payment / NSF rate, and stable-employment percentage? A property-management company in the area should have these aggregated.
- How much new for-sale + rental construction is in the pipeline within 1–3 miles? Heavy new supply typically softens prices + rents 12–24 months out; constrained supply supports both.
Investment metrics
- 1% rule
- 0.81% ✗
- Cap rate
- 6.58%
- Cash-on-cash
- 1.03%
- DSCR
- 1.05
- GRM
- 10.2
CMA / ARV
- ARV (on-the-fly)
- $198,940
- Comps found
- 12
Show comp detail 12 sales within ~0.75 mi
| Address | Dist | Beds/Ba | Sqft | Sold | Price | $/sf | Match |
|---|---|---|---|---|---|---|---|
| 204 Samuels Ave | 0.32mi | 3/1.0 | 1,456 (+6%) | 2mo | $175,000 | $120 | 69 |
| 125 Kiefer Ave | 0.40mi | 2/2.0 (-1) | 1,368 (-0%) | 9mo | $199,000 | $145 | 68 |
| 221 Muir Ave | 0.35mi | 4/2.0 (+1) | 1,360 (-1%) | 13mo | $215,000 | $158 | 66 |
| 132 Muir Ave | 0.26mi | 3/1.5 | 1,184 (-14%) | 8mo | $159,000 | $134 | 56 |
| 223 Thirwell Ave | 0.44mi | 4/1.0 (+1) | 1,200 (-12%) | 1mo | $170,000 | $142 | 49 |
| 534 Muir Ave | 0.69mi | 3/2.5 | 1,475 (+8%) | 8mo | $215,000 | $146 | 47 |
| 306 Elm St | 0.65mi | 3/1.0 | 1,442 (+5%) | 14mo | $139,000 | $96 | 45 |
| 424 Kiefer Ave | 0.67mi | 3/1.0 | 1,200 (-12%) | 2mo | $229,000 | $191 | 43 |
| 442 Kiefer Ave | 0.69mi | 3/1.0 | 1,280 (-7%) | 13mo | $200,000 | $156 | 42 |
| 528 Samuels Ave | 0.67mi | 3/1.5 | 1,569 (+14%) | 6mo | $250,000 | $159 | 38 |
| 401 Thirwell Ave | 0.59mi | 3/1.0 | 1,184 (-14%) | 18mo | $93,000 | $79 | 30 |
| 314 Chapel St | 0.69mi | 2/1.0 (-1) | 1,216 (-11%) | 14mo | $149,000 | $123 | 28 |
Match score weights: distance 35% · size 25% · config 20% · recency 20%. Top-matched comps best support the ARV.
Projected returns pro-forma
-3.0% appreciation · 3.0% rent growth · sell at horizon
- IRR
- -14.7%
- Equity multiple
- 0.47×
- Total profit
- $-26,188
- Equity at exit
- $26,540
- IRR
- -6.1%
- Equity multiple
- 0.61×
- Total profit
- $-19,540
- Equity at exit
- $15,390
Cash invested: $49,840 (down + closing). Projections, not guarantees.
Landlord ↔ Tenant lean methodology
- Overall (STATE)
- 62 Landlord-Friendly
- State Pennsylvania
- 62 Landlord-Friendly · EVEN
- County
- — inherits STATE
- City
- — inherits STATE
ZIP-level market 18201
- Home prices YoY
- -14.9%
- Active inventory
- 118
- Price-to-rent
- 10.2×
Monthly cashflow live
- Estimated rent
- $1,450 medium interval (Pro) →
- Mortgage (P&I)
- −$933
- Tax from tax record
- −$95 /mo · $1,144/yr
- Insurance
- −$74
- HOA
- −$0
- Vacancy / Maint / Mgmt
- −$304
- Net cashflow
- $43
Break-even live
UW: 25.0% down · 7.5% · 30yr · 1.5% tax · 5.0% vac · 8.0% maint · 8.0% mgmt
Financing live
Cash to close
- Down payment
- $44,500
- Closing costs
- $5,340
- Reserves months
- —
- Total cash needed
- —
Loan-product check · same deal, 3 products live
Conventional
25% down · 7.5% · 30yr
- Down + closing
- —
- Monthly P&I
- —
- Monthly cashflow
- —
- DSCR
- —
- Eligible?
- —
Personal DTI + credit; lowest rate.
DSCR
20% down · 8.5% · 30yr
- Down + closing
- —
- Monthly P&I
- —
- Monthly cashflow
- —
- DSCR
- —
- Eligible?
- —
No personal income docs; deal must DSCR.
Hard money
10% down · 12.0% · 12mo
- Down + closing
- —
- Monthly P&I
- —
- Monthly cashflow
- —
- DSCR
- —
- Eligible?
- —
Short-term bridge; refi at stabilization.
Rent comps 1 comps
| Address | Beds | Baths | Sqft | Rent | $/sqft | DOM | Units | Dist |
|---|---|---|---|---|---|---|---|---|
| 538 Carson St Hazleton, PA | 3.0 | 1.0 | 1400 | $1,450 | $1.04 | 43d | 1 | 1.41mi |
Listing history 11 events
-
2026-04-25status Pending
-
2026-04-17$178,000 Active
-
2023-05-15soldstatus $130,000
-
2023-05-11soldstatus $130,000 Closed 325-char remark
Show marketing remark (325 chars)
Stunning 3 bedroom, 2 Bath double wide manufactured home. This Home features Central AC, Natural Gas Fenced yard and much more! Land included 45X110. In a convenient location 4 minutes from downtown Hazleton. Also, a great investment for passive income! Market rent ($1,300/Month or more) Schedule your private showing today!
-
2023-03-17status Pending 325-char remark
Show marketing remark (325 chars)
Stunning 3 bedroom, 2 Bath double wide manufactured home. This Home features Central AC, Natural Gas Fenced yard and much more! Land included 45X110. In a convenient location 4 minutes from downtown Hazleton. Also, a great investment for passive income! Market rent ($1,300/Month or more) Schedule your private showing today!
-
2023-02-13price $125,500 325-char remark
Show marketing remark (325 chars)
Stunning 3 bedroom, 2 Bath double wide manufactured home. This Home features Central AC, Natural Gas Fenced yard and much more! Land included 45X110. In a convenient location 4 minutes from downtown Hazleton. Also, a great investment for passive income! Market rent ($1,300/Month or more) Schedule your private showing today!
-
2023-01-09price $129,900 325-char remark
Show marketing remark (325 chars)
Stunning 3 bedroom, 2 Bath double wide manufactured home. This Home features Central AC, Natural Gas Fenced yard and much more! Land included 45X110. In a convenient location 4 minutes from downtown Hazleton. Also, a great investment for passive income! Market rent ($1,300/Month or more) Schedule your private showing today!
-
2022-12-27status Active 325-char remark
Show marketing remark (325 chars)
Stunning 3 bedroom, 2 Bath double wide manufactured home. This Home features Central AC, Natural Gas Fenced yard and much more! Land included 45X110. In a convenient location 4 minutes from downtown Hazleton. Also, a great investment for passive income! Market rent ($1,300/Month or more) Schedule your private showing today!
-
2022-12-27status Pending 325-char remark
Show marketing remark (325 chars)
Stunning 3 bedroom, 2 Bath double wide manufactured home. This Home features Central AC, Natural Gas Fenced yard and much more! Land included 45X110. In a convenient location 4 minutes from downtown Hazleton. Also, a great investment for passive income! Market rent ($1,300/Month or more) Schedule your private showing today!
-
2022-11-30$139,900 Active 325-char remark
Show marketing remark (325 chars)
Stunning 3 bedroom, 2 Bath double wide manufactured home. This Home features Central AC, Natural Gas Fenced yard and much more! Land included 45X110. In a convenient location 4 minutes from downtown Hazleton. Also, a great investment for passive income! Market rent ($1,300/Month or more) Schedule your private showing today!
-
2022-09-21$139,900 Active
ⓘ Source: listings_history table (triggers on properties + properties_extension) + one-shot
backfill from property_details.listing_events for pre-trigger history.
Tax reassessment forecast PA · Partial reset (capped growth)
- Current annual tax
- $1,144 · $95/mo
- Projected year-2 tax
- $1,978 · $165/mo
- Expected delta
- +$834/yr (+$70/mo · 73.0%)
ⓘ Screening estimate from a state-policy table — verify with the county assessor before closing.
Climate risk First Street
- Flood 1/10 Low FEMA zone X (unshaded) · 0% chance over 30 yrs
- Wildfire 3/10 Moderate
- Heat 2/10 Low 7 d/yr ≥91°F today · 15 d/yr by 30 yrs out
- Wind 3/10 Moderate 7% chance of damaging wind over 30 yrs
- Air quality 2/10 Low 0 unhealthy d/yr today · 1 by 30 yrs out
Nearby sold comps map
Loading sold comps map…
Walkable amenities ~0.75 mi
Loading nearby amenities…
Taxation est. · year 1
- Rental income
- $17,400
- − Mortgage interest
- −$9,971
- − Property taxes
- −$1,144
- − Insurance
- −$890
- − Repairs & maintenance
- −$1,392
- − Management
- −$1,392
- − Depreciation
- −$5,178
- Taxable loss
- −$2,566
- Est. tax savings @ 24.0%
- +$616
- After-tax cash flow
- $1,127/yr
For passive investors: Depreciation is non-cash, so a rental often shows a tax loss while cash-flowing — sheltering income. Rental losses are passive: they offset passive income freely, and up to $25,000/yr can offset ordinary (W-2) income if you actively participate and your MAGI is under $100k (phasing out to $0 by $150k); unused losses carry forward. On sale, claimed depreciation is recaptured at up to 25%, and gains may owe capital-gains tax (a 1031 exchange can defer both). Figures are a year-1 estimate at your 24.0% rate — not tax advice; consult a CPA.
Schools (NCES district)
- District
- Hazleton Area SD
- NCES district ID
- 4211700
- Math proficiency
- 18% ▼ -3.00%
- Reading proficiency
- 30% ▼ -15.00%
- Median HH income
- $42,247
- Composite
- 20.44/100
- National rank
- #8582
- State rank
- #476 of 539 in PA
Livability — Hazleton
- Score
- 67/100
- State rank
- #930
- US rank
- #10115
Category grades
Schools grade is shown separately in the Schools card above.
Census & demographics
- Census place
- Hazleton, PA
- City population
- 13,755
- Population (ZIP)
- 31,428
Population outlook (Luzerne County) Hauer SSP2
- Today (2025)
- 319,505 people
- By 2030
- 319,943 · +0.1%
- By 2040
- 322,643 · +1.0%
- By 2050
- 330,817 · +3.5%
- By 2075
- 379,145 · +18.7%
- By 2100
- 431,908 · +35.2%
Race, ethnicity, and origin ACS 2023
- Neighborhood character
- Majority Hispanic (60%)
- Race & ethnicity
- Hispanic / Latino 60% White 36% Two or more races 18% Black 2%
- Hispanic origin (detail)
- Mexican 6% Puerto Rican 6% Dominican 41%
- Common ancestry
- Romanian 5% Iranian 1% Russian 1%
- Foreign-born
- 36% · Canada, Jamaica
- Languages at home
- 43% English-only · Spanish 54% Russian/Polish/Slavic 1% Other Indo-European 1%
Political lean MEDSL · Luzerne
- 2024 margin
- R (+19.2) · D 40.0% · R 59.2%
- 2008→2024 swing
- -27.6pp toward R · 2008: 8.4pp · 2024: -19.2pp
- All cycles
- 2024: R+19.2 2020: R+14.4 2016: R+19.6 2012: D+4.8 2008: D+8.4
Not yet ingested
- Civics
- —
Market trends
- HPI YoY
- ▼ -62.00%
- Current HPI
- 354.7443
- Rent YoY
- —
- Metro
- —
- State GDP YoY
- ▲ 1.68%
- F500 in state
- 34
Industry mix (Fortune 500 HQ in PA)
| Industry | F500 HQs | Revenue |
|---|---|---|
| Healthcare | 2 | $309B |
|
||
| Insurance | 2 | $27B |
|
||
| Telecommunications / Media | 1 | $124B |
|
||
| Industrial Distribution | 1 | $22B |
|
||
| Financial Services | 1 | $20B |
|
||
| Chemicals / Materials | 1 | $18B |
|
||
Price history
+27.2% since first listed11 events — show timeline
- 2026-04-25 Pending — LCAR
- 2026-04-17 Listed $178,000 LCAR
- 2023-05-15 Sold (Public Records) $130,000 Public Records
- 2023-05-11 Sold (MLS) $130,000 LCAR
- 2023-03-17 Pending — LCAR
- 2023-02-13 Price Changed $125,500 LCAR
- 2023-01-09 Price Changed $129,900 LCAR
- 2022-12-27 Relisted — LCAR
- 2022-12-27 Pending — LCAR
- 2022-11-30 Listed $139,900 LCAR
- 2022-09-21 Listed $139,900 PMAR
Property tax history
+6.9%/yrLatest (2026): $1,144 · +10.3% YoY. Source: county tax records.
Cash-flow waterfall
monthlySold comps — $/sqft
last 12 mo · ≤1 miLoading sold comps…