N Lincoln St · Memphis, MO
Flood risk No data
- FEMA flood zone
- —
- Chance of flooding over 30 yrs
- —
- Est. flood insurance / yr
- —
Fire risk No data
- Est. fire insurance / yr
- —
Heat risk No data
- Hot days now (above threshold)
- —
- Hot days in 30 yrs
- —
Wind risk No data
- Chance of severe wind over 30 yrs
- —
Air-quality risk No data
- Unhealthy air days now
- —
- Unhealthy air days in 30 yrs
- —
Risk factors via First Street. Map © Google.
Why this score? — see what drove the D grade
The composite is a weighted blend of 9 inputs, each scored 0–100. Each bar is that input's sub-score; the figure is the points it added to the 100-point composite (weight × sub-score).
- Appreciation +9.8/10.0
- Cash flow +8.1/30.0
- ARV discount +7.5/15.0
- Livability +3.8/5.0
- Schools +3.4/10.0
- 1% rule +2.5/10.0
- Rent growth +2.5/5.0
- Condition / age +2.5/5.0
- DSCR +2.1/10.0
$165,000
🖨 Deal sheet 📄 Offer letter ✓ Due diligence
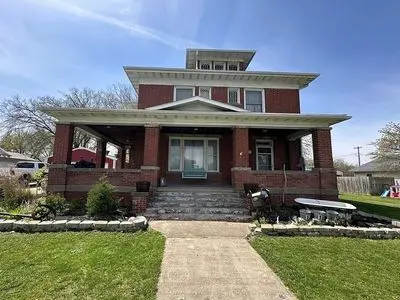
Listing remarks
Welcome to this charming 1914 brick home full of timeless character and thoughtful updates. Situated on a spacious . 33-acre lot in a desirable neighborhood, this home offers the perfect blend of historic craftsmanship and modern improvements. Featuring 3 bedrooms, 2 full bathrooms, and a versatile flex room ideal for a playroom, office, or potential fourth bedroom, there & acirc; & euro; & trade; s room to grow and adapt to your needs. The beautifully preserved original unpainted oak trim showcases the home & acirc; & euro; & trade; s classic craftsmanship and warmth & acirc; & euro; & rdquo; details you simply don & acirc; & euro; & trade;
Key facts
- Built 1914
Neighborhood map
What this means for you Summary
Snapshot
- This is a 3-bed/2.0-bath other listed at $165k.
Deal economics
- At list price, monthly cash flow is $-165 ($-2k/yr) — negative.
- To cash-flow at today's rent, offer at most $141k (14.4% below list).
- To meet the 1% rule (rent ≥ 1% of price), the offer needs to be $124k (25.1% below list).
- Recommended offer: $124k (25.1% below list) — sets the bar for 1% rule.
Location & tenants
- Location reads 75/100 on livability (#58 in MO, #4,152 nationally) — a middle-class / working-renter tenant base. Strengths: cost of living A+, housing A+, health & safety A+; Watch: schools C-, amenities F, commute F.
- Scotland County R-I (rural): math 37% / reading 45% proficiency, ranked #140 of 324 in MO (top 43%) — families likely to look elsewhere, expect single-tenant / working-renter base with shorter leases.
- Market conditions: 3 active listings in the ZIP.
Forward outlook
- In year one you build about $17k of equity ($1k loan paydown + $16k appreciation (9.6% local appreciation)).
- Scotland County population projected at -13% by 2050 — secular population decline; favor cash flow + early exit over multi-decade hold.
- By year 3, paydown + projected appreciation supports a ~$43k cash-out refi (75% LTV) — recoverable capital for the next deal without selling this one.
Negotiation context
- Only 0 days on market — expect competitive offers; lowballing is unlikely to land.
Risks & watch-outs
- Watch-outs: built in 1914 — expect roof / HVAC / electrical / plumbing capex.
Questions for the listing agent
- What do current leases actually rent for vs. the listed asking? Can we see a recent rent roll and the last 12 months of T-12 income?
- Built in 1914 — when were the roof, HVAC, electrical panel, plumbing, and water heater last replaced?
- Is there a deadline driving the sale (1031 exchange, divorce, estate, relocation)? That informs how much negotiation room exists.
- The area grade is low — what's the realistic commute time and amenity access for the typical tenant pool here? Any planned neighborhood developments (good or bad) we should know about?
- What's the average days-on-market for RENTAL listings here right now (not sales)? A rising rental-DOM trend means longer vacancies and softer asking-rent achievability than the comps imply.
- What's the recent tenant-quality profile in this submarket — average credit score on applications, eviction rate, late-payment / NSF rate, and stable-employment percentage? A property-management company in the area should have these aggregated.
- How much new for-sale + rental construction is in the pipeline within 1–3 miles? Heavy new supply typically softens prices + rents 12–24 months out; constrained supply supports both.
Investment metrics
- 1% rule
- 0.75% ✗
- Cap rate
- 5.10%
- Cash-on-cash
- -4.28%
- DSCR
- 0.81
- GRM
- 11.1
CMA / ARV
No comps found within radius.
Projected returns pro-forma
9.64% appreciation · 3.0% rent growth · sell at horizon
- IRR
- 20.5%
- Equity multiple
- 2.63×
- Total profit
- $75,331
- Equity at exit
- $144,318
- IRR
- 18.7%
- Equity multiple
- 5.96×
- Total profit
- $229,102
- Equity at exit
- $306,734
Cash invested: $46,200 (down + closing). Projections, not guarantees.
Landlord ↔ Tenant lean methodology
- Overall (STATE)
- 81 Strongly Landlord-Friendly
- State Missouri
- 81 Strongly Landlord-Friendly · R+10
- County
- — inherits STATE
- City
- — inherits STATE
ZIP-level market 63555
- Home prices YoY
- 5.2%
- Active inventory
- 3
- Price-to-rent
- 11.1×
Monthly cashflow live
- Estimated rent
- $1,235 medium interval (Pro) →
- Mortgage (P&I)
- −$865
- Tax est. 1.5%
- −$206 /mo · $2,475/yr
- Insurance
- −$69
- HOA
- −$0
- Vacancy / Maint / Mgmt
- −$259
- Net cashflow
- $-165
Break-even live
UW: 25.0% down · 7.5% · 30yr · 1.5% tax · 5.0% vac · 8.0% maint · 8.0% mgmt
Financing live
Cash to close
- Down payment
- $41,250
- Closing costs
- $4,950
- Reserves months
- —
- Total cash needed
- —
Loan-product check · same deal, 3 products live
Conventional
25% down · 7.5% · 30yr
- Down + closing
- —
- Monthly P&I
- —
- Monthly cashflow
- —
- DSCR
- —
- Eligible?
- —
Personal DTI + credit; lowest rate.
DSCR
20% down · 8.5% · 30yr
- Down + closing
- —
- Monthly P&I
- —
- Monthly cashflow
- —
- DSCR
- —
- Eligible?
- —
No personal income docs; deal must DSCR.
Hard money
10% down · 12.0% · 12mo
- Down + closing
- —
- Monthly P&I
- —
- Monthly cashflow
- —
- DSCR
- —
- Eligible?
- —
Short-term bridge; refi at stabilization.
Listing history 2 events
-
2026-06-09remarks 651-char remark
-
2026-06-09$165,000 Under Contract
ⓘ Source: listings_history table (triggers on properties + properties_extension) + one-shot
backfill from property_details.listing_events for pre-trigger history.
Nearby sold comps map
Loading sold comps map…
Walkable amenities ~0.75 mi
Loading nearby amenities…
Taxation est. · year 1
- Rental income
- $14,820
- − Mortgage interest
- −$9,243
- − Property taxes
- −$2,475
- − Insurance
- −$825
- − Repairs & maintenance
- −$1,186
- − Management
- −$1,186
- − Depreciation
- −$4,800
- Taxable loss
- −$4,893
- Est. tax savings @ 24.0%
- +$1,174
- After-tax cash flow
- $-801/yr
For passive investors: Depreciation is non-cash, so a rental often shows a tax loss while cash-flowing — sheltering income. Rental losses are passive: they offset passive income freely, and up to $25,000/yr can offset ordinary (W-2) income if you actively participate and your MAGI is under $100k (phasing out to $0 by $150k); unused losses carry forward. On sale, claimed depreciation is recaptured at up to 25%, and gains may owe capital-gains tax (a 1031 exchange can defer both). Figures are a year-1 estimate at your 24.0% rate — not tax advice; consult a CPA.
Schools (NCES district)
- District
- Scotland County R-I
- NCES district ID
- 2920700
- Math proficiency
- 37% ▼ -7.00%
- Reading proficiency
- 45% ▼ -6.00%
- Median HH income
- $40,661
- Composite
- 34.4/100
- National rank
- #5206
- State rank
- #140 of 324 in MO
Livability — Memphis
- Score
- 75/100
- State rank
- #58
- US rank
- #4152
Category grades
Schools grade is shown separately in the Schools card above.
Census & demographics
- Census place
- Memphis, MO
- Population (ZIP)
- 3,193
Population outlook (Scotland County) Hauer SSP2
- Today (2025)
- 4,692 people
- By 2030
- 4,549 · -3.0%
- By 2040
- 4,323 · -7.9%
- By 2050
- 4,089 · -12.9%
- By 2075
- 3,387 · -27.8%
- By 2100
- 2,479 · -47.2%
Race, ethnicity, and origin ACS 2023
- Neighborhood character
- Predominantly White (98%)
- Race & ethnicity
- White 98%
- Common ancestry
- Portuguese 3% Slovak 3% Italian 2%
- Languages at home
- 96% English-only · German/W. Germanic 4%
Political lean MEDSL · Scotland
- 2024 margin
- Solid R (+61.5) · D 18.7% · R 80.1% · Other 1.2%
- 2008→2024 swing
- -39.7pp toward R · 2008: -21.7pp · 2024: -61.5pp
- All cycles
- 2024: R+61.5 2020: R+59.1 2016: R+58.9 2012: R+31.1 2008: R+21.7
Not yet ingested
- Civics
- —
Market trends
- HPI YoY
- ▲ 9.64%
- Current HPI
- 193.476
- Rent YoY
- —
- Metro
- —
- State GDP YoY
- ▲ 1.84%
- F500 in state
- 20
Industry mix (Fortune 500 HQ in MO)
| Industry | F500 HQs | Revenue |
|---|---|---|
| Healthcare | 1 | $163B |
|
||
| Insurance | 1 | $21B |
|
||
| Industrial Technology | 1 | $17B |
|
||
| Retail | 1 | $16B |
|
||
| Industrial Distribution | 1 | $10B |
|
||
| Utilities | 1 | $9B |
|
||
Price history
1 event — show timeline
- 2026-06-09 Listed $165,000 FSBO.com
Cash-flow waterfall
monthlySold comps — $/sqft
last 12 mo · ≤1 miLoading sold comps…