350 Robbie Lee Rd · Pinehurst, TX
Flood risk 1/10 · Minimal
- FEMA flood zone
- X (unshaded)
- Chance of flooding over 30 yrs
- 0.0%
- Est. flood insurance / yr
- $507 – $1,088
Fire risk 5/10 · Moderate
- Est. fire insurance / yr
- $1,222 – $2,270
Heat risk 8/10 · Major
- Hot days now (above 111°F)
- 7 days/yr
- Hot days in 30 yrs
- 24 days/yr
Wind risk 8/10 · Major
- Chance of severe wind over 30 yrs
- 99.0%
Air-quality risk 2/10 · Minimal
- Unhealthy air days now
- 2 days/yr
- Unhealthy air days in 30 yrs
- 2 days/yr
Risk factors via First Street. Map © Google.
Why this score? — see what drove the C grade
The composite is a weighted blend of 9 inputs, each scored 0–100. Each bar is that input's sub-score; the figure is the points it added to the 100-point composite (weight × sub-score).
- Cash flow +15.0/30.0
- ARV discount +12.6/15.0
- Appreciation +10.0/10.0
- DSCR +4.6/10.0
- 1% rule +3.9/10.0
- Schools +3.9/10.0
- Livability +2.8/5.0
- Rent growth +2.6/5.0
- Condition / age +2.5/5.0
$239,900
🖨 Deal sheet (PDF) 📄 Offer letter ✓ Due diligence
Listing remarks MLS
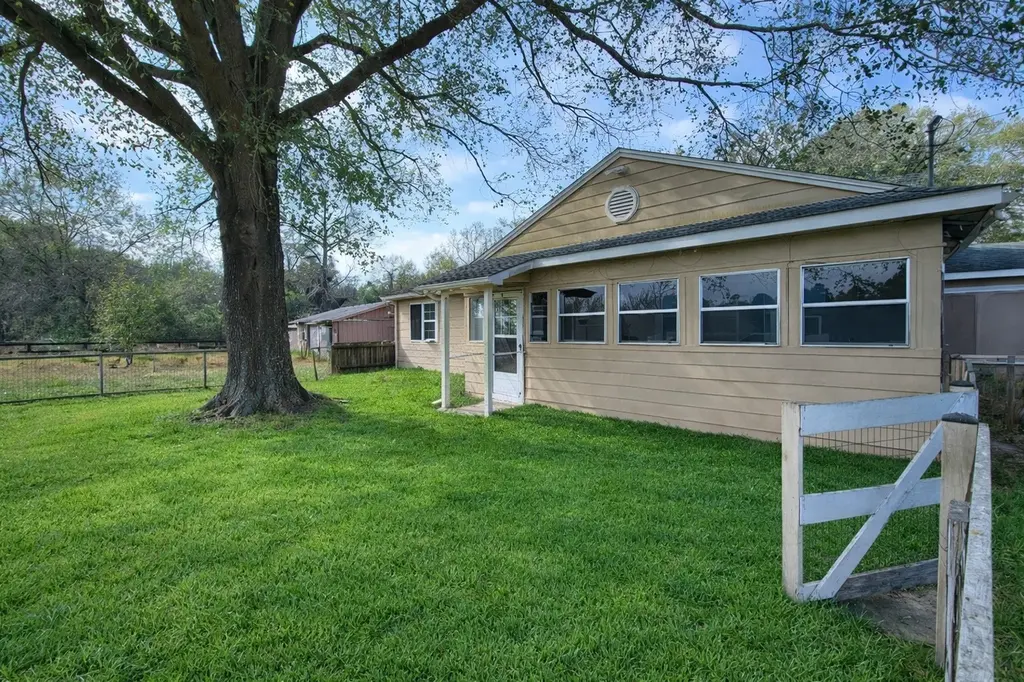
Nestled on approximately 1.029 acres in the peaceful countryside of Magnolia, this single-story, three-bedroom, two-bath home offers the perfect blend of privacy and convenience. Set in a quiet, rural setting, the property provides room to breathe while remaining just about five miles from local shopping, dining, and everyday amenities. The spacious lot offers endless possibilities—ideal for gardening, outdoor entertaining, hobbies, or simply enjoying the open space and natural surroundings. With no nearby congestion and wide-open skies, this home is well-suited for those seeking a slower pace of life without sacrificing access to town conveniences. Whether you’re looking for a weekend retreat, a homestead-style property, or a full-time residence with land, this Magnolia property delivers space, tranquility, and opportunity.
Key facts
- Open space
- Spacious lot
- Natural surroundings
Tags
Neighborhood map
What this means for you Summary
Snapshot
- This is a 3-bed/2.0-bath single-family listed at $240k.
Deal economics
- At list price, monthly cash flow is $73 ($880/yr) — positive.
- The deal already cash-flows at list — no discount required.
- To meet the 1% rule (rent ≥ 1% of price), the offer needs to be $214k (10.8% below list).
- Recommended offer: $211k (12.0% below list) — sets the bar for market timing.
- Cap rate 6.7% vs local median 2.0% in Pinehurst — top-decile yield for the area; either an underpriced asset or a hidden risk that comps aren't pricing in. Stress-test before assuming the spread holds.
Location & tenants
- Location reads 55/100 on livability (#1,350 in TX) — a working-class tenant base; expect higher turnover. Strengths: cost of living A+, housing B+; Watch: employment C-, schools F, crime D-.
- Magnolia ISD (rural): math 42% / reading 45% proficiency, ranked #247 of 826 in TX (top 30%) — families likely to look elsewhere, expect single-tenant / working-renter base with shorter leases.
- Market conditions: Rents flat; 1621 active listings in the ZIP; 1 comparable units currently listed for rent nearby; high-income renter base; 13,259 units permitted in Montgomery County in 2024 (1,402 in 5+ unit buildings).
Forward outlook
- In year one you build about $26k of equity ($2k loan paydown + $24k appreciation (10.0% local appreciation)).
- Montgomery County population projected at +65% by 2050 — long-run rental-demand tailwind backs the buy-and-hold thesis.
- At projected returns (10.0% appreciation + 0.3% rent growth), your $67k cash investment doubles in ~3 years — after that, you're playing with house money.
- By year 2, paydown + projected appreciation supports a ~$41k cash-out refi (75% LTV) — recoverable capital for the next deal without selling this one.
Negotiation context
- It's been on market 146 days — a 12% lower offer ($211k) is reasonable based on typical stale-listing flexibility.
Risks & watch-outs
- Climate carrying-cost: severe wind risk, 99% chance of damaging wind over 30y; moderate wildfire risk; extreme-heat days projected 7→24/yr by 2055 (HVAC capex compounding) — expect insurance premiums to compound above CPI over the hold.
Questions for the listing agent
- It's been on market 146 days. Have you received any prior offers? Is the seller open to a 12% concession, seller financing, or rate buy-down credit?
- Why hasn't it sold? Are there any deal-killer items the seller is aware of (foundation, flood, title, zoning, code violations)?
- Is there a deadline driving the sale (1031 exchange, divorce, estate, relocation)? That informs how much negotiation room exists.
- Schools are F-rated, which usually means shorter tenancies and higher turnover. Who's the typical renter profile here, and what's been the actual vacancy rate?
- Crime grade is D in this area — have there been break-ins, vandalism, or insurance claims at this property in the last 3 years? What carrier currently insures it and at what premium?
- What's the average days-on-market for RENTAL listings here right now (not sales)? A rising rental-DOM trend means longer vacancies and softer asking-rent achievability than the comps imply.
- What's the recent tenant-quality profile in this submarket — average credit score on applications, eviction rate, late-payment / NSF rate, and stable-employment percentage? A property-management company in the area should have these aggregated.
- How much new for-sale + rental construction is in the pipeline within 1–3 miles? Heavy new supply typically softens prices + rents 12–24 months out; constrained supply supports both.
Investment metrics
- 1% rule
- 0.89% ✗
- Cap rate
- 6.66%
- Cash-on-cash
- 1.31%
- DSCR
- 1.06
- GRM
- 9.3
CMA / ARV
- ARV (median comp)
- $270,490
- List price
- $239,900
- Delta
- -11.31%
- Verdict
- UNDERPRICED
- Comps
- 20 within 1.0 mi
Show comp detail 2 sales within ~0.75 mi
| Address | Dist | Beds/Ba | Sqft | Sold | Price | $/sf | Match |
|---|---|---|---|---|---|---|---|
| 31003 Friar Way | 0.27mi | 3/2.0 | 1,344 (-7%) | 16mo | $295,000 | $219 | 62 |
| 31015 Friar Way | 0.33mi | 3/2.0 | 1,652 (+14%) | 22mo | $235,000 | $142 | 43 |
Match score weights: distance 35% · size 25% · config 20% · recency 20%. Top-matched comps best support the ARV.
Projected returns pro-forma
10.0% appreciation · 0.32% rent growth · sell at horizon
- IRR
- 24.3%
- Equity multiple
- 2.93×
- Total profit
- $129,717
- Equity at exit
- $216,121
- IRR
- 20.9%
- Equity multiple
- 6.48×
- Total profit
- $368,137
- Equity at exit
- $466,073
Cash invested: $67,172 (down + closing). Projections, not guarantees.
Landlord ↔ Tenant lean methodology
- Overall (STATE)
- 87 Strongly Landlord-Friendly
- State Texas
- 87 Strongly Landlord-Friendly · R+5
- County
- — inherits STATE
- City
- — inherits STATE
ZIP-level market 77354
- Home prices YoY
- 2.4%
- Rents YoY
- 0.3%
- Active inventory
- 1621
- Price-to-rent
- 9.3×
Monthly cashflow live
- Estimated rent
- $2,139 medium interval (Pro) →
- Mortgage (P&I)
- −$1,258
- Tax from tax record
- −$259 /mo · $3,103/yr
- Insurance
- −$100
- HOA
- −$0
- Vacancy / Maint / Mgmt
- −$449
- Net cashflow
- $73
Break-even live
Sensitivity live
| Price | -10% $209 | -5% $141 | +0% $73 | +5% $5 | +10% $-62 |
|---|---|---|---|---|---|
| Rent | -10% $-96 | -5% $-11 | +0% $73 | +5% $158 | +10% $242 |
| Rate | -1.0pp $194 | -0.5pp $134 | base $73 | +0.5pp $11 | +1.0pp $-52 |
UW: 25.0% down · 7.5% · 30yr · 1.5% tax · 5.0% vac · 8.0% maint · 8.0% mgmt
Financing live
Cash to close
- Down payment
- $59,975
- Closing costs
- $7,197
- Reserves months
- —
- Total cash needed
- —
Loan-product check · same deal, 3 products live
Conventional
25% down · 7.5% · 30yr
- Down + closing
- —
- Monthly P&I
- —
- Monthly cashflow
- —
- DSCR
- —
- Eligible?
- —
Personal DTI + credit; lowest rate.
DSCR
20% down · 8.5% · 30yr
- Down + closing
- —
- Monthly P&I
- —
- Monthly cashflow
- —
- DSCR
- —
- Eligible?
- —
No personal income docs; deal must DSCR.
Hard money
10% down · 12.0% · 12mo
- Down + closing
- —
- Monthly P&I
- —
- Monthly cashflow
- —
- DSCR
- —
- Eligible?
- —
Short-term bridge; refi at stabilization.
Rent comps 1 comps
| Address | Beds | Baths | Sqft | Rent | $/sqft | DOM | Units | Dist |
|---|---|---|---|---|---|---|---|---|
| 30314 Ruby Forest Ct Magnolia, TX | 3.0 | 2.0 | 1650 | $2,595 | $1.57 | 44d | 1 | 1.31mi |
Listing history 16 events
-
2026-06-21days on market $239,900 Active 146 DOM
-
2026-06-18days on market $239,900 Active 143 DOM
-
2026-06-17days on market $239,900 Active 142 DOM
-
2026-06-16days on market $239,900 Active 141 DOM
-
2026-06-15days on market $239,900 Active 140 DOM
-
2026-06-13days on market $239,900 Active 138 DOM
-
2026-06-09days on market $239,900 Active 134 DOM
-
2026-06-08days on market $239,900 Active 133 DOM
-
2026-06-07days on market $239,900 Active 132 DOM
-
2026-06-04days on market $239,900 Active 129 DOM
-
2026-06-03days on market $239,900 Active 128 DOM
-
2026-06-02days on market $239,900 Active 127 DOM
-
2026-06-01days on market $239,900 Active 126 DOM
-
2026-05-31days on market $239,900 Active 125 DOM
-
2026-01-26$239,900 Active 854-char remark
Show marketing remark (854 chars)
Nestled on approximately 1.029 acres in the peaceful countryside of Magnolia, this single-story, three-bedroom, two-bath home offers the perfect blend of privacy and convenience. Set in a quiet, rural setting, the property provides room to breathe while remaining just about five miles from local shopping, dining, and everyday amenities. The spacious lot offers endless possibilities—ideal for gardening, outdoor entertaining, hobbies, or simply enjoying the open space and natural surroundings. With no nearby congestion and wide-open skies, this home is well-suited for those seeking a slower pace of life without sacrificing access to town conveniences. Whether you’re looking for a weekend retreat, a homestead-style property, or a full-time residence with land, this Magnolia property delivers space, tranquility, and opportunity.
-
2004-06-10soldstatus
ⓘ Source: listings_history table (triggers on properties + properties_extension) + one-shot
backfill from property_details.listing_events for pre-trigger history.
Tax reassessment forecast TX · Resets to sale price
- Current annual tax
- $3,103 · $259/mo
- Projected year-2 tax
- $4,390 · $366/mo
- Expected delta
- +$1,287/yr (+$107/mo · 41.5%)
ⓘ Screening estimate from a state-policy table — verify with the county assessor before closing.
Climate risk First Street
- Flood 1/10 Low FEMA zone X (unshaded) · 0% chance over 30 yrs
- Wildfire 5/10 Major
- Heat 8/10 Severe 7 d/yr ≥111°F today · 24 d/yr by 30 yrs out
- Wind 8/10 Severe 99% chance of damaging wind over 30 yrs
- Air quality 2/10 Low 2 unhealthy d/yr today · 2 by 30 yrs out
Nearby sold comps map
Loading sold comps map…
Walkable amenities ~0.75 mi
Loading nearby amenities…
Taxation est. · year 1
- Rental income
- $25,670
- − Mortgage interest
- −$13,438
- − Property taxes
- −$3,103
- − Insurance
- −$1,200
- − Repairs & maintenance
- −$2,054
- − Management
- −$2,054
- − Depreciation
- −$6,979
- Taxable loss
- −$3,156
- Est. tax savings @ 24.0%
- +$758
- After-tax cash flow
- $1,638/yr
For passive investors: Depreciation is non-cash, so a rental often shows a tax loss while cash-flowing — sheltering income. Rental losses are passive: they offset passive income freely, and up to $25,000/yr can offset ordinary (W-2) income if you actively participate and your MAGI is under $100k (phasing out to $0 by $150k); unused losses carry forward. On sale, claimed depreciation is recaptured at up to 25%, and gains may owe capital-gains tax (a 1031 exchange can defer both). Figures are a year-1 estimate at your 24.0% rate — not tax advice; consult a CPA.
Schools (NCES district)
- District
- Magnolia ISD
- NCES district ID
- 4828740
- Math proficiency
- 42% ▼ -7.00%
- Reading proficiency
- 45% ▼ -4.00%
- Median HH income
- $71,692
- Composite
- 39.46/100
- National rank
- #3958
- State rank
- #247 of 826 in TX
Livability — Pinehurst
- Score
- 55/100
- State rank
- #1350
- US rank
- #23272
Category grades
Schools grade is shown separately in the Schools card above.
Census & demographics
- County
- Montgomery County · 663,713 people
- Metro
- Houston-The Woodlands-Sugar Land, TX
- Population (ZIP)
- 44,900
- Household income
- $112,504
- Rent vs Own
- Severe rent burden
- 586.0
Population outlook (Montgomery County) Hauer SSP2
- Today (2025)
- 713,896 people
- By 2030
- 805,263 · +12.8%
- By 2040
- 992,708 · +39.1%
- By 2050
- 1,179,590 · +65.2%
- By 2075
- 1,628,084 · +128.1%
- By 2100
- 1,937,880 · +171.5%
Race, ethnicity, and origin ACS 2023
- Neighborhood character
- Predominantly White (66%)
- Race & ethnicity
- White 66% Hispanic / Latino 25% Two or more races 18% Black 3% Asian 1%
- Hispanic origin (detail)
- Mexican 14% Puerto Rican 1%
- Common ancestry
- Lithuanian 4% Slovak 2% Italian 2%
- Foreign-born
- 11% · Canada, Vietnam
- Languages at home
- 83% English-only · Spanish 15% Other Indo-European 1% German/W. Germanic 1%
Political lean MEDSL · Montgomery
- 2024 margin
- Solid R (+45.5) · D 26.8% · R 72.3%
- 2008→2024 swing
- +7.2pp toward D · 2008: -52.7pp · 2024: -45.5pp
- All cycles
- 2024: R+45.5 2020: R+43.8 2016: R+51.4 2012: R+60.7 2008: R+52.7
Not yet ingested
- Civics
- —
Market trends
- HPI YoY
- ▲ 12.09%
- Current HPI
- 512.87
- Rent YoY
- ▲ 0.32%
- Metro
- Houston-The Woodlands-Sugar Land, TX
- State GDP YoY
- ▲ 3.95%
- F500 in state
- 110
Industry mix (Fortune 500 HQ in TX)
| Industry | F500 HQs | Revenue |
|---|---|---|
| Energy | 16 | $1,198B |
|
||
| Technology | 5 | $198B |
|
||
| Engineering / Construction | 4 | $72B |
|
||
| Energy Services | 3 | $60B |
|
||
| Utilities | 3 | $41B |
|
||
| Healthcare | 2 | $330B |
|
||
Price history
2 events — show timeline
- 2026-01-26 Listed $239,900 HARMLS
- 2004-06-10 Sold (Public Records) — Public Records
Property tax history
+6.5%/yrLatest (2025): $3,103 · +9.8% YoY. Source: county tax records.
Cash-flow waterfall
monthlySold comps — $/sqft
last 12 mo · ≤1 miLoading sold comps…