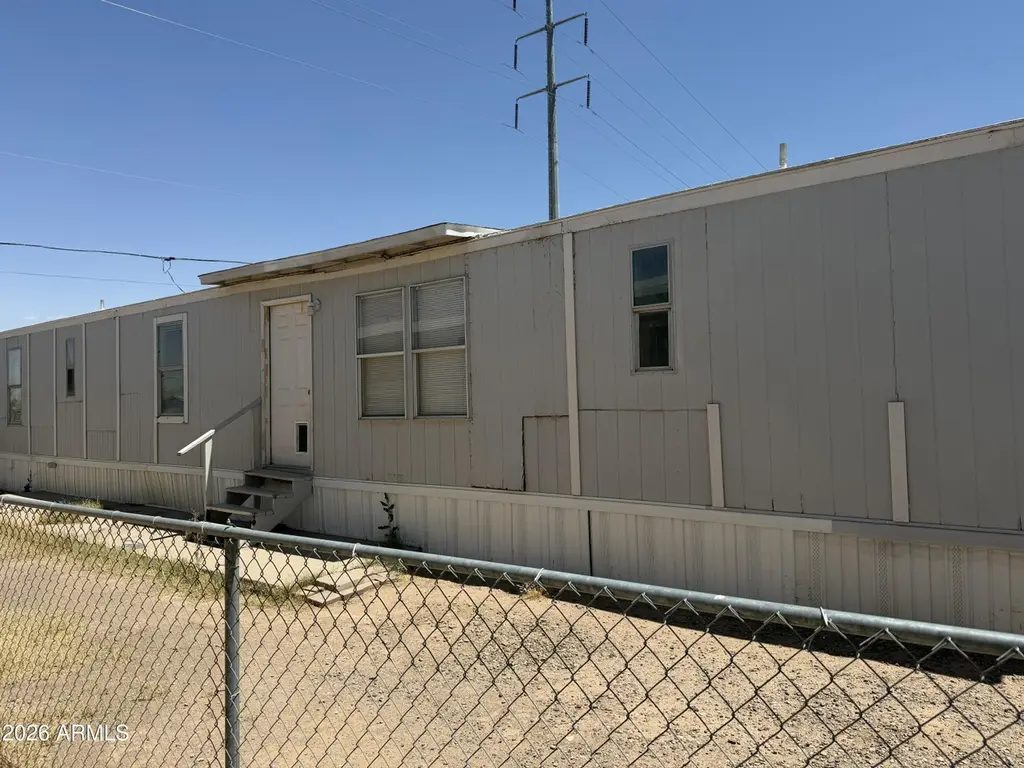
799 W Battaglia Rd #35 · Eloy, AZ
Flood risk 1/10 · Minimal
- FEMA flood zone
- X (unshaded)
- Chance of flooding over 30 yrs
- 0.0%
- Est. flood insurance / yr
- $507 – $1,088
Fire risk 5/10 · Moderate
- Est. fire insurance / yr
- $610 – $1,132
Heat risk 9/10 · Severe
- Hot days now (above 112°F)
- 7 days/yr
- Hot days in 30 yrs
- 20 days/yr
Wind risk 1/10 · Minimal
- Chance of severe wind over 30 yrs
- —
Air-quality risk 1/10 · Minimal
- Unhealthy air days now
- 0 days/yr
- Unhealthy air days in 30 yrs
- 0 days/yr
Risk factors via First Street. Map © Google.
Why this score? — see what drove the B- grade
The composite is a weighted blend of 9 inputs, each scored 0–100. Each bar is that input's sub-score; the figure is the points it added to the 100-point composite (weight × sub-score).
- Cash flow +30.0/30.0
- 1% rule +10.0/10.0
- DSCR +10.0/10.0
- ARV discount +8.7/15.0
- Livability +3.2/5.0
- Rent growth +2.5/5.0
- Condition / age +2.2/5.0
- Schools +1.9/10.0
- Appreciation +0.0/10.0
$28,000
🖨 Deal sheet (PDF) 📄 Offer letter ✓ Due diligence
Listing remarks MLS
No Age Restrictions!!! 2 bedroom 2bath. Lot rent for the home is only $420.00 and includes sewer and trash services. .Owner must apply with park
Key facts
- 4,356 sq ft lot
- Built 1984
- Listed 16 days
Property features AI
Finance
- HOA & community: Land lease of $480 per month; No association fees
Exterior
- Utilities: City water; Public sewer
- Home design: Manufactured/mobile home; Leasehold ownership
- Construction: Steel frame construction; Painted exterior; Metal roof; Building area reported by owner
- Exterior features: No fencing; Lot has no notable features
Interior
- Bedrooms: 2 possible bedrooms
- Bathrooms: 2 full bathrooms
- Heating & cooling: Electric heating; Window/Wall air conditioning
- Interior features: Full bathroom in the master bedroom; Washer/Dryer hookups only
- Laundry & utility: Washer/Dryer hookups
Neighborhood map
What this means for you Summary
Snapshot
- This is a 2-bed/2.0-bath manufactured listed at $28k. Condition is rated fair.
Deal economics
- At list price, monthly cash flow is $693 ($8k/yr) — positive.
- The deal already cash-flows at list — no discount required.
- Meets the 1% rule at list price ($1k rent vs $28k).
- Recommended offer: $28k (1.5% below list) — sets the bar for market timing.
- Cap rate 36.0% vs local median 1.3% in Eloy — top-decile yield for the area; either an underpriced asset or a hidden risk that comps aren't pricing in. Stress-test before assuming the spread holds.
Location & tenants
- Location reads 65/100 on livability (#78 in AZ) — a middle-class / working-renter tenant base. Strengths: cost of living A+, housing A+; Watch: crime D+, amenities D-, commute F.
- Santa Cruz Valley Union High School District (4454) (town): math 11% / reading 30% proficiency, ranked #382 of 501 in AZ (top 76%) — low school quality limits family demand, transient renter base, plan for 1-2y turnover.
- Zoned schools: Santa Cruz Valley Union High School (math 15% / reading 24%, grade F, #230 of 381 statewide, top 61%, 340 students, 78% FRL).
- Market conditions: 440 active listings in the ZIP; 5 comparable units currently listed for rent nearby; rentals leasing fast (median 3d on market — plan ~1-2 weeks tenant-placement turnaround); 9,504 units permitted in Pinal County in 2024 (776 in 5+ unit buildings).
Forward outlook
- Local home prices are declining (-3.0%/yr); year-one equity from $194 of loan paydown is wiped out by about $840 of value loss. Plan a longer hold.
- At projected returns (-3.0% appreciation + 3.0% rent growth), your $8k cash investment doubles in ~2 years — after that, you're playing with house money.
Negotiation context
- It's been on market 17 days — a 2% lower offer ($28k) is reasonable based on typical stale-listing flexibility.
- 3 sale attempts since 2y ago with the ask held roughly flat each time — persistent listings suggest the price (not the market) is what's stuck; bring a comps-based counter.
- Current owner paid $24k; 17% above their basis — modest negotiation headroom, anchor on the comps not their cost.
Risks & watch-outs
- Climate carrying-cost: moderate wildfire risk; extreme-heat days projected 7→20/yr by 2055 (HVAC capex compounding) — expect insurance premiums to compound above CPI over the hold.
Questions for the listing agent
- Have any recent inspections been done? Can we get a copy of the seller's disclosures and any deferred-maintenance estimates?
- Is there a deadline driving the sale (1031 exchange, divorce, estate, relocation)? That informs how much negotiation room exists.
- Schools are F-rated, which usually means shorter tenancies and higher turnover. Who's the typical renter profile here, and what's been the actual vacancy rate?
- Crime grade is D in this area — have there been break-ins, vandalism, or insurance claims at this property in the last 3 years? What carrier currently insures it and at what premium?
- What's the average days-on-market for RENTAL listings here right now (not sales)? A rising rental-DOM trend means longer vacancies and softer asking-rent achievability than the comps imply.
- What's the recent tenant-quality profile in this submarket — average credit score on applications, eviction rate, late-payment / NSF rate, and stable-employment percentage? A property-management company in the area should have these aggregated.
- How much new for-sale + rental construction is in the pipeline within 1–3 miles? Heavy new supply typically softens prices + rents 12–24 months out; constrained supply supports both.
Investment metrics
- 1% rule
- 4.01% ✓
- Cap rate
- 35.99%
- Cash-on-cash
- 106.06%
- DSCR
- 5.72
- GRM
- 2.1
CMA / ARV
- ARV (on-the-fly)
- $28,800
- Comps found
- 2
Show comp detail 2 sales within ~0.75 mi
| Address | Dist | Beds/Ba | Sqft | Sold | Price | $/sf | Match |
|---|---|---|---|---|---|---|---|
| 799 W Battaglia Rd #01 | 0.00mi | 3/2.0 (+1) | 960 (0%) | 21mo | $28,500 | $30 | 77 |
| 799 W Battaglia Rd #23 | 0.00mi | 2/1.5 | 900 (-6%) | 14mo | $13,000 | $14 | 76 |
Match score weights: distance 35% · size 25% · config 20% · recency 20%. Top-matched comps best support the ARV.
Projected returns pro-forma
-3.0% appreciation · 3.0% rent growth · sell at horizon
- IRR
- —
- Equity multiple
- 6.05×
- Total profit
- $39,611
- Equity at exit
- $4,175
- IRR
- —
- Equity multiple
- 12.66×
- Total profit
- $91,386
- Equity at exit
- $2,421
Cash invested: $7,840 (down + closing). Projections, not guarantees.
Landlord ↔ Tenant lean methodology
- Overall (STATE)
- 87 Strongly Landlord-Friendly
- State Arizona
- 87 Strongly Landlord-Friendly · R+3
- County
- — inherits STATE
- City
- — inherits STATE
ZIP-level market 85131
- Home prices YoY
- -25.9%
- Active inventory
- 440
- Price-to-rent
- 2.1×
Monthly cashflow live
- Estimated rent
- $1,122 high interval (Pro) →
- Mortgage (P&I)
- −$147
- Tax est. 1.5%
- −$35 /mo · $420/yr
- Insurance
- −$12
- HOA
- −$0
- Vacancy / Maint / Mgmt
- −$236
- Net cashflow
- $693
Break-even live
Sensitivity live
| Price | -10% $712 | -5% $703 | +0% $693 | +5% $683 | +10% $674 |
|---|---|---|---|---|---|
| Rent | -10% $604 | -5% $649 | +0% $693 | +5% $737 | +10% $782 |
| Rate | -1.0pp $707 | -0.5pp $700 | base $693 | +0.5pp $686 | +1.0pp $678 |
UW: 25.0% down · 7.5% · 30yr · 1.5% tax · 5.0% vac · 8.0% maint · 8.0% mgmt
Financing live
Cash to close
- Down payment
- $7,000
- Closing costs
- $840
- Reserves months
- —
- Total cash needed
- —
Loan-product check · same deal, 3 products live
Conventional
25% down · 7.5% · 30yr
- Down + closing
- —
- Monthly P&I
- —
- Monthly cashflow
- —
- DSCR
- —
- Eligible?
- —
Personal DTI + credit; lowest rate.
DSCR
20% down · 8.5% · 30yr
- Down + closing
- —
- Monthly P&I
- —
- Monthly cashflow
- —
- DSCR
- —
- Eligible?
- —
No personal income docs; deal must DSCR.
Hard money
10% down · 12.0% · 12mo
- Down + closing
- —
- Monthly P&I
- —
- Monthly cashflow
- —
- DSCR
- —
- Eligible?
- —
Short-term bridge; refi at stabilization.
Rent comps 5 comps
| Address | Beds | Baths | Sqft | Rent | $/sqft | DOM | Units | Dist |
|---|---|---|---|---|---|---|---|---|
| 810 N Curiel St Unit A Eloy, AZ | 2.0 | 1.0 | 600 | $1,050 | $1.75 | 2d | 1 | 0.56mi |
| 507 W Alsdorf Rd Eloy, AZ | 1.0 | 1.0 | 675 | $995 | $1.47 | 0d | 1 | 1.05mi |
| 401 N D St Eloy, AZ | 2.0–3.0 | 1.0 | 875 | $850 | $0.97 | 0d | 4 | 1.10mi |
| 403 N Sunshine Blvd Unit A Eloy, AZ | 2.0 | 1.0 | 805 | $1,095 | $1.36 | 3d | 1 | 1.19mi |
| 403 N Sunshine Blvd Unit C Eloy, AZ | 2.0 | 1.0 | 805 | $1,145 | $1.42 | 2d | 1 | 1.19mi |
Listing history 11 events
-
2026-06-21days on market $28,000 Active 17 DOM
-
2026-06-18days on market $28,000 Active 14 DOM
-
2026-06-17days on market $28,000 Active 13 DOM
-
2026-06-16days on market $28,000 Active 12 DOM
-
2026-06-15days on market $28,000 Active 11 DOM
-
2026-06-13days on market $28,000 Active 9 DOM
-
2026-06-13days on market $28,000 Active 8 DOM
-
2026-06-09days on market $28,000 Active 5 DOM
-
2026-06-08days on market $28,000 Active 4 DOM
-
2026-06-07remarks 142-char remark
-
2026-06-07$28,000 Active 3 DOM
ⓘ Source: listings_history table (triggers on properties + properties_extension) + one-shot
backfill from property_details.listing_events for pre-trigger history.
Climate risk First Street
- Flood 1/10 Low FEMA zone X (unshaded) · 0% chance over 30 yrs
- Wildfire 5/10 Major
- Heat 9/10 Extreme 7 d/yr ≥112°F today · 20 d/yr by 30 yrs out
- Wind 1/10 Low
- Air quality 1/10 Low 0 unhealthy d/yr today · 0 by 30 yrs out
Nearby sold comps map
Loading sold comps map…
Walkable amenities ~0.75 mi
Loading nearby amenities…
Taxation est. · year 1
- Rental income
- $13,464
- − Mortgage interest
- −$1,568
- − Property taxes
- −$420
- − Insurance
- −$140
- − Repairs & maintenance
- −$1,077
- − Management
- −$1,077
- − Depreciation
- −$815
- Taxable income
- $8,367
- Est. tax owed @ 24.0%
- −$2,008
- After-tax cash flow
- $6,307/yr
For passive investors: Depreciation is non-cash, so a rental often shows a tax loss while cash-flowing — sheltering income. Rental losses are passive: they offset passive income freely, and up to $25,000/yr can offset ordinary (W-2) income if you actively participate and your MAGI is under $100k (phasing out to $0 by $150k); unused losses carry forward. On sale, claimed depreciation is recaptured at up to 25%, and gains may owe capital-gains tax (a 1031 exchange can defer both). Figures are a year-1 estimate at your 24.0% rate — not tax advice; consult a CPA.
Condition & rehab AI · 12 photos
This manufactured home requires significant exterior and interior repairs, but has potential for substantial value increase with updates.
Repairs flagged
- Major exterior siding — Significant damage
- Major interior walls — Peeling paint
- Major kitchen appliances — Older and worn
Value-add opportunities
- Both new exterior siding — Enhances curb appeal and value
- Both new interior paint — Improves aesthetics and value
- Both new kitchen appliances — Modernizes and increases value
Renovation cost estimate screening
| Repair item | Severity | Est. cost |
|---|---|---|
| exterior siding · Significant damage | Major | $15,000–50,000 |
| interior walls · Peeling paint | Major | $15,000–50,000 |
| kitchen appliances · Older and worn | Major | $15,000–50,000 |
| Total estimated repair cost · 3 items | $45,000–150,000 |
Value-add ROI direction
- Both new exterior siding — Enhances curb appeal and value ↑
- Both new interior paint — Improves aesthetics and value ↑
- Both new kitchen appliances — Modernizes and increases value ↑
ⓘ Cost ranges are severity-bucket heuristics (US national rule-of-thumb). Get contractor quotes + a written scope before underwriting a rehab budget.
Schools (NCES district)
- District
- Santa Cruz Valley Union High School District (4454)
- NCES district ID
- 0407530
- Math proficiency
- 11% ▲ 1.00%
- Reading proficiency
- 30% ▲ 15.00%
- Median HH income
- $24,927
- Composite
- 19.12/100
- National rank
- #13971
- State rank
- #382 of 501 in AZ
Livability — Eloy
- Score
- 65/100
- State rank
- #78
- US rank
- #12496
Category grades
Schools grade is shown separately in the Schools card above.
Census & demographics
- Census place
- Eloy, AZ
- County
- Pinal County · 399,947 people
- City population
- 18,794
- Metro
- Phoenix-Mesa-Chandler, AZ
- Population (ZIP)
- 18,794
- Household income
- $56,576
- Rent vs Own
- Severe rent burden
- 301.0
Population outlook (Pinal County) Hauer SSP2
- Today (2025)
- 437,574 people
- By 2030
- 446,903 · +2.1%
- By 2040
- 452,589 · +3.4%
- By 2050
- 444,126 · +1.5%
- By 2075
- 430,300 · -1.7%
- By 2100
- 393,536 · -10.1%
Race, ethnicity, and origin ACS 2023
- Neighborhood character
- Diverse neighborhood (Simpson 0.65)
- Race & ethnicity
- Hispanic / Latino 47% White 36% Two or more races 16% Black 8% Native American 5% Pacific Islander 1%
- Hispanic origin (detail)
- Mexican 43%
- Common ancestry
- Italian 4% Slovak 1% Lithuanian 1%
- Foreign-born
- 16% · Canada
- Languages at home
- 65% English-only · Spanish 32% Other Asian/Pacific 1% Russian/Polish/Slavic 1%
Political lean MEDSL · Pinal
- 2024 margin
- Strong R (+22.1) · D 38.5% · R 60.6%
- 2008→2024 swing
- -7.6pp toward R · 2008: -14.5pp · 2024: -22.1pp
- All cycles
- 2024: R+22.1 2020: R+17.3 2016: R+19.3 2012: R+17.1 2008: R+14.5
Not yet ingested
- Civics
- —
Market trends
- HPI YoY
- ▼ -60.00%
- Current HPI
- 171.3217
- Rent YoY
- —
- Metro
- Phoenix-Mesa-Chandler, AZ
- State GDP YoY
- ▲ 4.54%
- F500 in state
- 20
Industry mix (Fortune 500 HQ in AZ)
| Industry | F500 HQs | Revenue |
|---|---|---|
| Technology | 2 | $13B |
|
||
| Mining / Metals | 1 | $23B |
|
||
| Environmental Services | 1 | $16B |
|
||
| Metals / Steel | 1 | $14B |
|
||
| Technology Distribution | 1 | $9B |
|
||
| Homebuilding | 1 | $8B |
|
||
Price history
-1.8% since first listed7 events — show timeline
- 2026-06-02 Listed $28,000 ARMLS
- 2024-06-10 Contingent — ARMLS
- 2024-06-10 Sold (MLS) $24,000 ARMLS
- 2024-05-09 Price Changed $24,000 ARMLS
- 2024-05-08 Listed $28,500 ARMLS
- 2024-05-01 Listing Removed — ARMLS
- 2024-01-19 Listed $28,500 ARMLS
Cash-flow waterfall
monthlySold comps — $/sqft
last 12 mo · ≤1 miLoading sold comps…