 Duplex
519521 Straub Rd · Mansfield, OH
Flood risk 1/10 · Minimal
- FEMA flood zone
- X (unshaded)
- Chance of flooding over 30 yrs
- 0.0%
- Est. flood insurance / yr
- $507 – $1,088
Fire risk 1/10 · Minimal
- Est. fire insurance / yr
- $713 – $1,323
Heat risk 2/10 · Minimal
- Hot days now (above 96°F)
- 7 days/yr
- Hot days in 30 yrs
- 17 days/yr
Wind risk 2/10 · Minimal
- Chance of severe wind over 30 yrs
- —
Air-quality risk 2/10 · Minimal
- Unhealthy air days now
- 1 days/yr
- Unhealthy air days in 30 yrs
- 1 days/yr
Risk factors via First Street. Map © Google.
Why this score? — see what drove the D grade
The composite is a weighted blend of 9 inputs, each scored 0–100. Each bar is that input's sub-score; the figure is the points it added to the 100-point composite (weight × sub-score).
- Cash flow +11.6/30.0
- ARV discount +7.5/15.0
- Rent growth +4.3/5.0
- Schools +4.3/10.0
- Livability +3.8/5.0
- 1% rule +3.4/10.0
- DSCR +3.4/10.0
- Condition / age +2.8/5.0
- Appreciation +0.0/10.0
$259,900
🖨 Deal sheet (PDF) 📄 Offer letter ✓ Due diligence
Multi-family units
County records classify this as Multi-Family (2-4 Unit). Listing-text estimate: 2 units. confirmed
Listing remarks
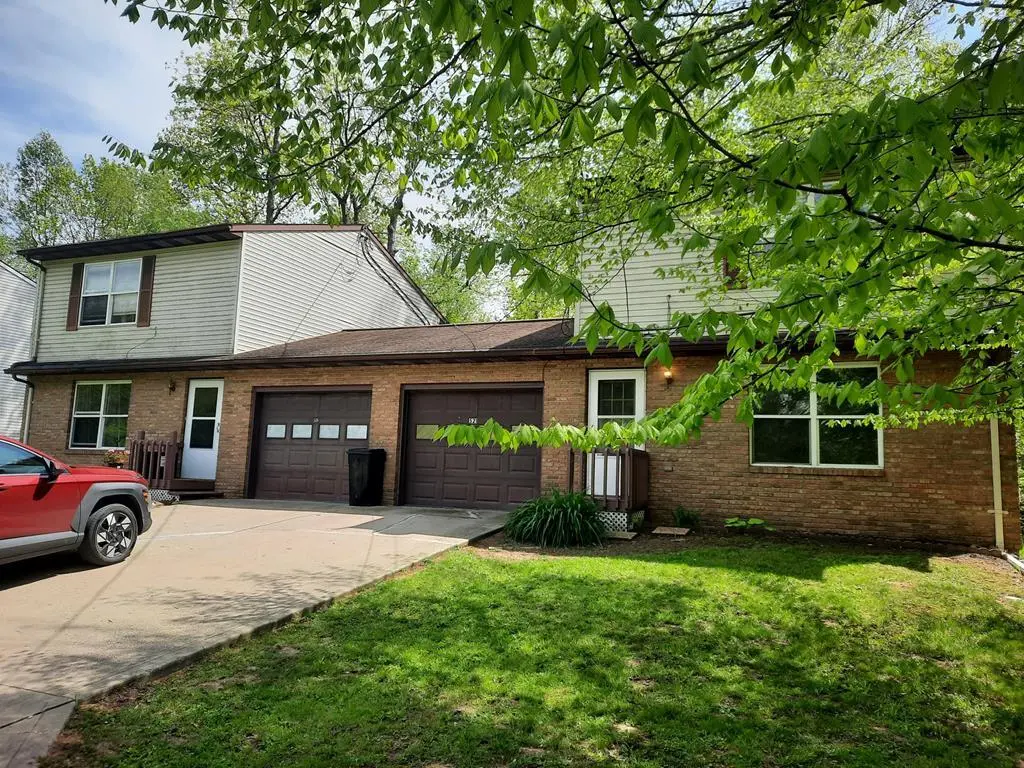
Very well maintained duplex. Newer carpet in both units. Tenants maintain the apartments well. Lovely wooded setting with two side by side units in a two story building. Each unit has a fenced back yard. Separate utilities and each unit has its own garage.
Key facts
- Separate utilities
- Fenced back yard
- Wooded setting
Tags
Property features AI
Exterior
- Parking: Has garage; Concrete parking/driveway
- Utilities: Public water; Public sewer
- Home design: Multi-family residential income property; 2 total stories
- Construction: Brick and vinyl siding exterior
Interior
- Kitchen: Refrigerator; Oven; Range
- Bedrooms: Two 2-bedroom units
- Bathrooms: Two 1-bath units
- Heating & cooling: Baseboard heating
- Interior features: Refrigerator; Oven; Range
Neighborhood map
What this means for you Summary
Snapshot
- This is a 2 × 2-bed/1.0-bath units multifamily listed at $260k. Condition is rated average.
Deal economics
- At list price, monthly cash flow is $-79 ($-953/yr) — negative. Per door: $-40/mo.
- To cash-flow at today's rent, offer at most $248k (4.4% below list).
- To meet the 1% rule (rent ≥ 1% of price), the offer needs to be $217k (16.4% below list).
- Recommended offer: $217k (16.4% below list) — sets the bar for 1% rule.
- Cap rate 5.9% vs local median 4.3% in Mansfield — top-decile yield for the area; either an underpriced asset or a hidden risk that comps aren't pricing in. Stress-test before assuming the spread holds.
Location & tenants
- Location reads 76/100 on livability (#224 in OH, #3,525 nationally) — a middle-class / working-renter tenant base. Strengths: commute A+, cost of living A+, housing A+; Watch: schools C-, crime D-, amenities D-.
- Madison Local (suburban): math 48% / reading 56% proficiency, ranked #430 of 656 in OH (top 66%) — acceptable for families but not a draw, mixed tenant base, ~2y average lease.
- Market conditions: Rents rising fast (+7.1%/yr); 125 active listings in the ZIP; 1 comparable units currently listed for rent nearby; 145 units permitted in Richland County in 2024 (0 in 5+ unit buildings).
- This rent runs 38% of the median local income ($68k/yr) — at the standard rent-burdened threshold; future hikes will face affordability resistance.
Forward outlook
- Local home prices are declining (-3.0%/yr); year-one equity from $2k of loan paydown is wiped out by about $8k of value loss. Plan a longer hold.
- Richland County population projected at -18% by 2050 — secular population decline; favor cash flow + early exit over multi-decade hold.
Negotiation context
- It's been on market 30 days — a 2% lower offer ($256k) is reasonable based on typical stale-listing flexibility.
Questions for the listing agent
- What do current leases actually rent for vs. the listed asking? Can we see a recent rent roll and the last 12 months of T-12 income?
- Can we see the unit-by-unit rent roll, current vacancy, and any below-market leases? What's the average tenancy length?
- What capital expenditures (roof, boiler, parking lot, exteriors) have been made in the last 5 years, and what's planned in the next 2?
- Is there a deadline driving the sale (1031 exchange, divorce, estate, relocation)? That informs how much negotiation room exists.
- Crime grade is D in this area — have there been break-ins, vandalism, or insurance claims at this property in the last 3 years? What carrier currently insures it and at what premium?
- The area grade is low — what's the realistic commute time and amenity access for the typical tenant pool here? Any planned neighborhood developments (good or bad) we should know about?
- What's the average days-on-market for RENTAL listings here right now (not sales)? A rising rental-DOM trend means longer vacancies and softer asking-rent achievability than the comps imply.
- What's the recent tenant-quality profile in this submarket — average credit score on applications, eviction rate, late-payment / NSF rate, and stable-employment percentage? A property-management company in the area should have these aggregated.
- How much new apartment / multifamily construction is in the pipeline within 1–3 miles? Heavy new supply (>2% of stock underway) typically softens rents 12–24 months out; light construction supports rent growth.
Investment metrics
- 1% rule
- 0.84% ✗
- Cap rate
- 5.93%
- Cash-on-cash
- -1.31%
- DSCR
- 0.94
- GRM
- 10.0
CMA / ARV
No comps found within radius.
Show comp detail 7 sales within ~0.75 mi
| Address | Dist | Beds/Ba | Sqft | Sold | Price | $/sf | Match |
|---|---|---|---|---|---|---|---|
| 552 Bailey Dr | 0.15mi | 4/2.0 | — | 10mo | $239,000 | — | 72 |
| 1809 S Sawmill Pl | 0.41mi | 4/2.0 | — | 8mo | $299,900 | — | 62 |
| 1813 Sawmill Pl | 0.41mi | 4/4.0 | — | 6mo | $235,000 | — | 55 |
| 1947 Richwood Dr | 0.55mi | 4/3.0 | — | 5mo | $234,000 | — | 53 |
| 640 Kirkwood Dr | 0.65mi | 4/2.0 | — | 6mo | $212,000 | — | 52 |
| 1818-1820 Sawmill Pl #1820 | 0.45mi | 4/— | 2,768 | 18mo | $251,888 | $91 | 52 |
| 716 Greenfield Dr | 0.67mi | 4/4.0 | — | 9mo | $249,900 | — | 41 |
Match score weights: distance 35% · size 25% · config 20% · recency 20%. Top-matched comps best support the ARV.
Projected returns pro-forma
-3.0% appreciation · 7.07% rent growth · sell at horizon
- IRR
- -14.0%
- Equity multiple
- 0.48×
- Total profit
- $-37,879
- Equity at exit
- $38,752
- IRR
- 0.3%
- Equity multiple
- 1.03×
- Total profit
- $1,974
- Equity at exit
- $22,471
Cash invested: $72,772 (down + closing). Projections, not guarantees.
Landlord ↔ Tenant lean methodology
- Overall (STATE)
- 73 Landlord-Friendly
- State Ohio
- 73 Landlord-Friendly · R+6
- County
- — inherits STATE
- City
- — inherits STATE
ZIP-level market 44805
- Rents YoY
- 7.1%
- Active inventory
- 125
- Price-to-rent
- 19.9×
Monthly cashflow live
- Estimated rent
- $2,173 high interval (Pro) →
- Mortgage (P&I)
- −$1,363
- Tax est. 1.5%
- −$325 /mo · $3,898/yr
- Insurance
- −$108
- HOA
- −$0
- Vacancy / Maint / Mgmt
- −$456
- Net cashflow
- $-79
Break-even live
Sensitivity live
| Price | -10% $100 | -5% $10 | +0% $-79 | +5% $-169 | +10% $-259 |
|---|---|---|---|---|---|
| Rent | -10% $-251 | -5% $-165 | +0% $-79 | +5% $6 | +10% $92 |
| Rate | -1.0pp $51 | -0.5pp $-13 | base $-79 | +0.5pp $-147 | +1.0pp $-215 |
2-unit breakdown (identical units grouped — click to expand)
| Units | Beds | Baths | Est. rent |
|---|---|---|---|
| 2× units | 2 | 1 | $2,172 |
| #1 | 2 | 1 | $1,086 |
| #2 | 2 | 1 | $1,086 |
| Total (2 units) | $2,173 | ||
UW: 25.0% down · 7.5% · 30yr · 1.5% tax · 5.0% vac · 8.0% maint · 8.0% mgmt
Financing live
Cash to close
- Down payment
- $64,975
- Closing costs
- $7,797
- Reserves months
- —
- Total cash needed
- —
Loan-product check · same deal, 3 products live
Conventional
25% down · 7.5% · 30yr
- Down + closing
- —
- Monthly P&I
- —
- Monthly cashflow
- —
- DSCR
- —
- Eligible?
- —
Personal DTI + credit; lowest rate.
DSCR
20% down · 8.5% · 30yr
- Down + closing
- —
- Monthly P&I
- —
- Monthly cashflow
- —
- DSCR
- —
- Eligible?
- —
No personal income docs; deal must DSCR.
Hard money
10% down · 12.0% · 12mo
- Down + closing
- —
- Monthly P&I
- —
- Monthly cashflow
- —
- DSCR
- —
- Eligible?
- —
Short-term bridge; refi at stabilization.
Rent comps 1 comps
| Address | Beds | Baths | Sqft | Rent | $/sqft | DOM | Units | Dist |
|---|---|---|---|---|---|---|---|---|
| 1194 Woodland Rd Mansfield, OH | 4.0 | 2.0 | 2289 | $1,850 | $0.81 | 45d | 1 | 1.26mi |
Listing history 12 events
-
2026-06-21days on market $259,900 Active 30 DOM
-
2026-06-21days on market $259,900 Active 29 DOM
-
2026-06-18days on market $259,900 Active 28 DOM
-
2026-06-17days on market $259,900 Active 27 DOM
-
2026-06-16days on market $259,900 Active 26 DOM
-
2026-06-15days on market $259,900 Active 25 DOM
-
2026-06-13days on market $259,900 Active 23 DOM
-
2026-06-12days on market $259,900 Active 22 DOM
-
2026-06-09days on market $259,900 Active 19 DOM
-
2026-06-08days on market $259,900 Active 18 DOM
-
2026-06-08remarks 256-char remark
-
2026-06-08$259,900 Active 17 DOM
ⓘ Source: listings_history table (triggers on properties + properties_extension) + one-shot
backfill from property_details.listing_events for pre-trigger history.
Climate risk First Street
- Flood 1/10 Low FEMA zone X (unshaded) · 0% chance over 30 yrs
- Wildfire 1/10 Low
- Heat 2/10 Low 7 d/yr ≥96°F today · 17 d/yr by 30 yrs out
- Wind 2/10 Low
- Air quality 2/10 Low 1 unhealthy d/yr today · 1 by 30 yrs out
Nearby sold comps map
Loading sold comps map…
Walkable amenities ~0.75 mi
Loading nearby amenities…
Taxation est. · year 1
- Rental income
- $26,076
- − Mortgage interest
- −$14,558
- − Property taxes
- −$3,898
- − Insurance
- −$1,300
- − Repairs & maintenance
- −$2,086
- − Management
- −$2,086
- − Depreciation
- −$7,561
- Taxable loss
- −$5,413
- Est. tax savings @ 24.0%
- +$1,299
- After-tax cash flow
- $346/yr
For passive investors: Depreciation is non-cash, so a rental often shows a tax loss while cash-flowing — sheltering income. Rental losses are passive: they offset passive income freely, and up to $25,000/yr can offset ordinary (W-2) income if you actively participate and your MAGI is under $100k (phasing out to $0 by $150k); unused losses carry forward. On sale, claimed depreciation is recaptured at up to 25%, and gains may owe capital-gains tax (a 1031 exchange can defer both). Figures are a year-1 estimate at your 24.0% rate — not tax advice; consult a CPA.
Condition & rehab AI · 14 photos
The home is in average condition with some minor repairs and maintenance needed. It has a good location and a good layout, but it could benefit from some updates to increase its value.
Repairs flagged
- Minor Kitchen cabinets — Cabinets appear to be slightly worn and could benefit from a fresh coat of paint.
- Minor Living room carpet — Carpet appears to be slightly worn and could benefit from a fresh coat of paint.
- Minor Bathroom fixtures — Fixtures appear to be slightly worn and could benefit from a fresh coat of paint.
Value-add opportunities
- Resale Paint interior walls and trim — Fresh paint can make a significant difference in the home's appearance and value.
- Rental Clean and organize living room — A clean and organized living room can attract more tenants and increase rental value.
- Resale Clean and organize bathrooms — Clean and organized bathrooms can make a significant difference in the home's appearance and value.
- Resale Clean and organize kitchen — A clean and organized kitchen can make a significant difference in the home's appearance and value.
- Resale Clean and organize bedrooms — A clean and organized bedroom can make a significant difference in the home's appearance and value.
Renovation cost estimate screening
| Repair item | Severity | Est. cost |
|---|---|---|
| Kitchen cabinets · Cabinets appear to be slightly worn and could benefit from a fresh coat of paint. | Minor | $500–3,000 |
| Living room carpet · Carpet appears to be slightly worn and could benefit from a fresh coat of paint. | Minor | $500–3,000 |
| Bathroom fixtures · Fixtures appear to be slightly worn and could benefit from a fresh coat of paint. | Minor | $500–3,000 |
| Total estimated repair cost · 3 items | $1,500–9,000 |
Value-add ROI direction
- Resale Paint interior walls and trim — Fresh paint can make a significant difference in the home's appearance and value. ↑
- Rental Clean and organize living room — A clean and organized living room can attract more tenants and increase rental value. ↑
- Resale Clean and organize bathrooms — Clean and organized bathrooms can make a significant difference in the home's appearance and value. ↑
- Resale Clean and organize kitchen — A clean and organized kitchen can make a significant difference in the home's appearance and value. ↑
- Resale Clean and organize bedrooms — A clean and organized bedroom can make a significant difference in the home's appearance and value. ↑
ⓘ Cost ranges are severity-bucket heuristics (US national rule-of-thumb). Get contractor quotes + a written scope before underwriting a rehab budget.
Schools (NCES district)
- District
- Madison Local
- NCES district ID
- 3904945
- Math proficiency
- 48% ▼ -13.00%
- Reading proficiency
- 56% ▼ -6.00%
- Median HH income
- $39,880
- Composite
- 43.45/100
- National rank
- #3007
- State rank
- #430 of 656 in OH
Livability — Mansfield
- Score
- 76/100
- State rank
- #224
- US rank
- #3525
Category grades
Schools grade is shown separately in the Schools card above.
Census & demographics
- Census place
- Mansfield, OH
- County
- Ashland County · 30,805 people
- City population
- 16,349
- Metro
- Ashland, OH
- Population (ZIP)
- 30,805
- Household income
- $68,299
- Rent vs Own
- Severe rent burden
- 706.0
Population outlook (Richland County) Hauer SSP2
- Today (2025)
- 115,577 people
- By 2030
- 111,669 · -3.4%
- By 2040
- 103,323 · -10.6%
- By 2050
- 95,135 · -17.7%
- By 2075
- 76,719 · -33.6%
- By 2100
- 57,188 · -50.5%
Race, ethnicity, and origin ACS 2023
- Neighborhood character
- Predominantly White (93%)
- Race & ethnicity
- White 93% Two or more races 3% Black 2% Hispanic / Latino 2%
- Common ancestry
- Italian 2% Romanian 2% Slovak 2%
- Foreign-born
- 1% · Canada
- Languages at home
- 95% English-only · German/W. Germanic 4% Spanish 1%
Political lean MEDSL · Richland
- 2024 margin
- Solid R (+42.3) · D 28.4% · R 70.8%
- 2008→2024 swing
- -28.8pp toward R · 2008: -13.6pp · 2024: -42.3pp
- All cycles
- 2024: R+42.3 2020: R+39.7 2016: R+37.5 2012: R+20.1 2008: R+13.6
Not yet ingested
- Civics
- —
Market trends
- HPI YoY
- ▼ -196.79%
- Current HPI
- 201.96
- Rent YoY
- ▲ 7.07%
- Metro
- Ashland, OH
- State GDP YoY
- ▲ 1.98%
- F500 in state
- 48
Industry mix (Fortune 500 HQ in OH)
| Industry | F500 HQs | Revenue |
|---|---|---|
| Insurance | 3 | $145B |
|
||
| Industrial Machinery | 3 | $49B |
|
||
| Financial Services | 3 | $24B |
|
||
| Consumer Goods | 2 | $93B |
|
||
| Aerospace / Defense | 2 | $47B |
|
||
| Utilities | 2 | $33B |
|
||
Price history
1 event — show timeline
- 2026-05-21 Listed $259,900 MARMLS
Cash-flow waterfall
monthlySold comps — $/sqft
last 12 mo · ≤1 miLoading sold comps…