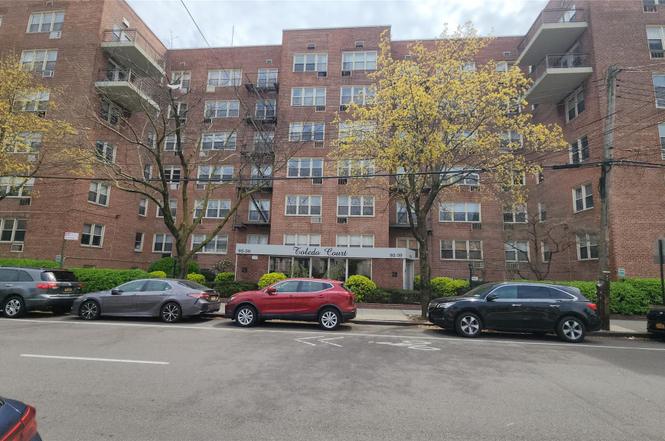
92-30 56th Ave Unit 5F · New York, NY
Flood risk 8/10 · Major
- FEMA flood zone
- X (unshaded)
- Chance of flooding over 30 yrs
- 0.98%
- Est. flood insurance / yr
- $507 – $1,088
Fire risk 1/10 · Minimal
- Est. fire insurance / yr
- $691 – $1,283
Heat risk 6/10 · Moderate
- Hot days now (above 99°F)
- 7 days/yr
- Hot days in 30 yrs
- 15 days/yr
Wind risk 6/10 · Moderate
- Chance of severe wind over 30 yrs
- 27.0%
Air-quality risk 5/10 · Moderate
- Unhealthy air days now
- 6 days/yr
- Unhealthy air days in 30 yrs
- 8 days/yr
Risk factors via First Street. Map © Google.
Why this score? — see what drove the C grade
The composite is a weighted blend of 9 inputs, each scored 0–100. Each bar is that input's sub-score; the figure is the points it added to the 100-point composite (weight × sub-score).
- Cash flow +20.2/30.0
- ARV discount +7.5/15.0
- DSCR +6.4/10.0
- 1% rule +5.3/10.0
- Schools +5.0/10.0
- Appreciation +4.5/10.0
- Rent growth +4.3/5.0
- Livability +3.8/5.0
- Condition / age +2.5/5.0
$245,000
🖨 Deal sheet (PDF) 📄 Offer letter ✓ Due diligence
Listing remarks
Sale May Be Subject To Term & Conditions Of An Offering Plan. Information Is Not Guaranteed. Location! Location! Location! Block to Queens Center Shopping Mall. Near all transportation, shops and schools. Bright and spacious rooms with beautiful hardwood floor. Plenty storage spaces including a walk-in closet and storage rooms in the building, which needs a fee. Extra adjustable Super Utility fee and Tax Abatement fee monthly besides Maintenance fee. The Tax Abatement fee will be removed once the new owner started to use the apartment as his/her prime residence. No pets allowed. No sublet allowed. 20% down payment and 28% DTI to be proved by the management and board.
Key facts
- Walk-in closet
- shops and schools
- Built 1962
Tags
Neighborhood map
What this means for you Summary
Snapshot
- This is a 1-bed/1.0-bath condo listed at $245k.
Deal economics
- At list price, monthly cash flow is $241 ($3k/yr) — positive.
- The deal already cash-flows at list — no discount required.
- Meets the 1% rule at list price ($3k rent vs $245k).
- Recommended offer: $216k (12.0% below list) — sets the bar for market timing.
- Cap rate 7.8% vs local median 2.6% in New York — top-decile yield for the area; either an underpriced asset or a hidden risk that comps aren't pricing in. Stress-test before assuming the spread holds.
Location & tenants
- Location reads 75/100 on livability (#268 in NY, #4,188 nationally) — a middle-class / working-renter tenant base. Strengths: amenities A+, commute A+, health & safety A; Watch: crime F, cost of living F.
- Zoned schools: Ps 13 Clement C Moore (math 47% / reading 47%, grade D-, #1,195 of 2,108 statewide, top 60%, 1,026 students, 83% FRL); Is 227 Louis Armstrong (math 52% / reading 69%, grade B+, #153 of 729 statewide, top 21%, 1,528 students, 68% FRL); Midwood High School (math 94% / reading 96%, grade A+, #83 of 1,100 statewide, top 8%, 4,062 students, 73% FRL).
- Market conditions: Rents rising fast (+7.2%/yr); 270 active listings in the ZIP; 40 comparable units currently listed for rent nearby; rentals at typical pace (median 18d on market — plan ~3-4 weeks tenant-placement turnaround); 5,302 units permitted in Queens County in 2024 (4,918 in 5+ unit buildings).
- This rent runs 43% of the median local income ($71k/yr) — at the standard rent-burdened threshold; future hikes will face affordability resistance.
Forward outlook
- Local home prices are declining (-1.0%/yr); year-one equity from $2k of loan paydown is wiped out by about $2k of value loss. Plan a longer hold.
- Queens County population projected at +16% by 2050 — long-run rental-demand tailwind backs the buy-and-hold thesis.
- At projected returns (-1.0% appreciation + 7.2% rent growth), your $69k cash investment doubles in ~8 years — after that, you're playing with house money.
Negotiation context
- It's been on market 302 days — a 12% lower offer ($216k) is reasonable based on typical stale-listing flexibility.
- 3 sale attempts since 2y ago; this cycle's ask has dropped $14k (5%) from the opening price — seller is motivated, your offer sets the floor, not the list.
Risks & watch-outs
- Watch-outs: flood insurance adds $66/mo.
- Climate carrying-cost: severe flood risk; major wind risk, 27% chance of damaging wind over 30y; extreme-heat days projected 7→15/yr by 2055 (HVAC capex compounding) — expect insurance premiums to compound above CPI over the hold.
Questions for the listing agent
- It's been on market 302 days. Have you received any prior offers? Is the seller open to a 12% concession, seller financing, or rate buy-down credit?
- Built in 1962 — when were the roof, HVAC, electrical panel, plumbing, and water heater last replaced?
- What's the actual annual flood-insurance premium (NFIP or private), and is the property in a SFHA with mandatory coverage?
- Any open or pending special assessments — roof, HVAC, plumbing, elevator, façade? What's the per-unit balance and payoff schedule, and is the seller paying it off at close or rolling it to the buyer?
- Why hasn't it sold? Are there any deal-killer items the seller is aware of (foundation, flood, title, zoning, code violations)?
- Is there a deadline driving the sale (1031 exchange, divorce, estate, relocation)? That informs how much negotiation room exists.
- Schools are B-rated — typically a magnet for longer-tenancy family renters. What's the average tenant stay here, and is there a school-zone premium baked into asking?
- Crime grade is F in this area — have there been break-ins, vandalism, or insurance claims at this property in the last 3 years? What carrier currently insures it and at what premium?
- What's the average days-on-market for RENTAL listings here right now (not sales)? A rising rental-DOM trend means longer vacancies and softer asking-rent achievability than the comps imply.
- What's the recent tenant-quality profile in this submarket — average credit score on applications, eviction rate, late-payment / NSF rate, and stable-employment percentage? A property-management company in the area should have these aggregated.
- How much new apartment / multifamily construction is in the pipeline within 1–3 miles? Heavy new supply (>2% of stock underway) typically softens rents 12–24 months out; light construction supports rent growth.
Investment metrics
- 1% rule
- 1.03% ✓
- Cap rate
- 7.80%
- Cash-on-cash
- 5.38%
- DSCR
- 1.24
- GRM
- 8.1
CMA / ARV
No comps found within radius.
Projected returns pro-forma
-0.98% appreciation · 7.15% rent growth · sell at horizon
- IRR
- 2.6%
- Equity multiple
- 1.12×
- Total profit
- $8,192
- Equity at exit
- $59,352
- IRR
- 12.4%
- Equity multiple
- 2.41×
- Total profit
- $96,621
- Equity at exit
- $62,504
Cash invested: $68,600 (down + closing). Projections, not guarantees.
Landlord ↔ Tenant lean methodology
- Overall (CITY)
- 0 Strongly Tenant-Friendly
- State New York
- 15 Strongly Tenant-Friendly · D+10
- County
- — inherits STATE
- City New York
- 0 Strongly Tenant-Friendly · D+34
ZIP-level market 11373
- Home prices YoY
- -0.4%
- Rents YoY
- 7.2%
- Active inventory
- 270
- Price-to-rent
- 8.1×
Monthly cashflow live
- Estimated rent
- $2,532 high interval (Pro) →
- Mortgage (P&I)
- −$1,285
- Tax est. 1.5%
- −$306 /mo · $3,675/yr
- Insurance
- −$102
- Flood insurance flood zone
- −$66 /mo · $798/yr
- HOA
- −$0
- Vacancy / Maint / Mgmt
- −$532
- Net cashflow
- $241
Break-even live
Sensitivity live
| Price | -10% $410 | -5% $326 | +0% $241 | +5% $156 | +10% $72 |
|---|---|---|---|---|---|
| Rent | -10% $41 | -5% $141 | +0% $241 | +5% $341 | +10% $441 |
| Rate | -1.0pp $364 | -0.5pp $303 | base $241 | +0.5pp $177 | +1.0pp $113 |
UW: 25.0% down · 7.5% · 30yr · 1.5% tax · 5.0% vac · 8.0% maint · 8.0% mgmt
Financing live
Cash to close
- Down payment
- $61,250
- Closing costs
- $7,350
- Reserves months
- —
- Total cash needed
- —
Loan-product check · same deal, 3 products live
Conventional
25% down · 7.5% · 30yr
- Down + closing
- —
- Monthly P&I
- —
- Monthly cashflow
- —
- DSCR
- —
- Eligible?
- —
Personal DTI + credit; lowest rate.
DSCR
20% down · 8.5% · 30yr
- Down + closing
- —
- Monthly P&I
- —
- Monthly cashflow
- —
- DSCR
- —
- Eligible?
- —
No personal income docs; deal must DSCR.
Hard money
10% down · 12.0% · 12mo
- Down + closing
- —
- Monthly P&I
- —
- Monthly cashflow
- —
- DSCR
- —
- Eligible?
- —
Short-term bridge; refi at stabilization.
Rent comps 40 comps
| Address | Beds | Baths | Sqft | Rent | $/sqft | DOM | Units | Dist |
|---|---|---|---|---|---|---|---|---|
| 9430 58th Ave Unit 3A Elmhurst, NY | — | 1.0 | 530 | $1,800 | $3.40 | 13d | 1 | 0.19mi |
| 6125 97th St Unit 4D Rego Park, NY | — | 1.0 | 650 | $2,300 | $3.54 | 6d | 1 | 0.42mi |
| 6155 98th St Unit 8B Rego Park, NY | 1.0 | 1.0 | 700 | $2,500 | $3.57 | 6d | 1 | 0.49mi |
| 86-16 60th Ave Unit 1K Queens, NY | 1.0 | 1.0 | 750 | $2,300 | $3.07 | 26d | 1 | 0.49mi |
| 62-98 Saunders St Unit 4P Flushing, NY | 1.0 | 1.0 | 700 | $2,400 | $3.43 | 0d | 1 | 0.51mi |
| 9710 62nd Dr Unit 9F Rego Park, NY | 1.0 | 1.0 | 750 | $2,700 | $3.60 | 6d | 1 | 0.52mi |
| 9707 63rd Rd Unit 15B Rego Park, NY | 1.0 | 1.0 | 700 | $2,300 | $3.29 | 4d | 1 | 0.58mi |
| 6145 98th St Rego Park, NY | 1.0–3.0 | 1.0 | 825 | $2,500 | $3.03 | 26d | 3 | 0.58mi |
| 6145 98th St Rego Park, NY | 1.0–3.0 | 1.0 | 825 | $2,350 | $2.85 | 5d | 3 | 0.58mi |
| 6347 Booth St Unit 3C Rego Park, NY | 1.0 | 1.0 | 700 | $3,400 | $4.86 | 26d | 1 | 0.62mi |
| 9725 64th Ave Rego Park, NY | 1.0 | 1.0 | 760 | $1,800 | $2.37 | 21d | 1 | 0.68mi |
| 9810 64th Ave Rego Park, NY | 1.0 | 1.0 | 825 | $2,125 | $2.58 | 19d | 2 | 0.74mi |
| 9810 64th Ave Rego Park, NY | 1.0–2.0 | 1.0–2.0 | 850 | $2,450 | $2.88 | 1d | 2 | 0.74mi |
| 8360 Vietor Ave Unit 6P Elmhurst, NY | 2.0 | 1.0 | 850 | $2,650 | $3.12 | 17d | 1 | 0.76mi |
| 102-45 62nd Rd Unit 7J Forest Hills, NY | 1.0 | 1.0 | 770 | $2,950 | $3.83 | 26d | 1 | 0.77mi |
| 9825 64th Rd Unit 8F Rego Park, NY | 2.0 | 1.0 | 850 | $2,400 | $2.82 | 3d | 1 | 0.78mi |
| 102-06 63rd Ave #2 Queens, NY | 2.0 | 1.0 | 1000 | $3,000 | $3.00 | 26d | 1 | 0.78mi |
| 40-24 Aske St Unit 1FL Flushing, NY | 1.0 | 1.0 | 800 | $2,800 | $3.50 | 1d | 1 | 0.80mi |
| 10302 42nd Ave Unit 4D Corona, NY | 2.0 | 1.5 | 761 | $3,400 | $4.47 | 21d | 1 | 0.82mi |
| 9941 64th Ave Unit C16 Rego Park, NY | 2.0 | 1.0 | 1100 | $3,200 | $2.91 | 1d | 1 | 0.83mi |
| 97-12 65th Rd Unit 4-C Rego Park, NY | 1.0 | 1.0 | 650 | $3,350 | $5.15 | 7d | 1 | 0.83mi |
| 97-12 65th Rd Unit 18-E Rego Park, NY | 1.0 | 1.0 | 600 | $3,650 | $6.08 | 1d | 1 | 0.83mi |
| 9941 64th Ave Rego Park, NY | 1.0–2.0 | 1.0 | 975 | $2,400 | $2.46 | 21d | 2 | 0.84mi |
| 54-01 108th St Unit 2R Flushing, NY | 2.0 | 1.0 | 1000 | $3,050 | $3.05 | 26d | 1 | 0.86mi |
| 97-12 65th Rd Apt 5D Rego Park, NY | 1.0 | 1.0 | 800 | $3,395 | $4.24 | 7d | 1 | 0.87mi |
| 54-40 80th St Unit 1 Elmhurst, NY | 2.0 | 2.0 | 956 | $3,000 | $3.14 | 26d | 1 | 0.91mi |
| 5440 80th St Elmhurst, NY | 2.0 | 2.0 | 996 | $3,000 | $3.01 | 4d | 1 | 0.91mi |
| 98-81 Queens Blvd Unit 14K Rego Park, NY | 2.0 | 2.0 | 950 | $4,490 | $4.73 | 15d | 1 | 0.96mi |
| 98-81 Queens Blvd Unit 15E Rego Park, NY | 1.0 | 1.0 | 700 | $3,335 | $4.76 | 7d | 1 | 0.96mi |
| 9876 Queens Blvd Unit 3A Rego Park, NY | 1.0 | 1.0 | 820 | $2,900 | $3.54 | 26d | 1 | 0.96mi |
| 6405 Yellowstone Blvd Unit 403S Forest Hills, NY | 1.0 | 1.0 | 720 | $3,100 | $4.31 | 26d | 1 | 0.99mi |
| 6405 Yellowstone Blvd Flushing, NY | 1.0 | 1.0–1.5 | 920 | $3,075 | $3.34 | 26d | 2 | 0.99mi |
| 37-27 86th St Unit 6N Flushing, NY | — | 1.0 | 650 | $1,900 | $2.92 | 26d | 1 | 1.02mi |
| 631-27 Fitchett St Unit 1 Flushing, NY | 2.0 | 1.0 | 1100 | $3,800 | $3.45 | 1d | 1 | 1.02mi |
| 63127 Fitchett St Rego Park, NY | 1.0 | 1.0 | 900 | $2,800 | $3.11 | 4d | 1 | 1.02mi |
| 6620 Wetherole St Rego Park, NY | 1.0–2.0 | 1.0–2.0 | 700 | $2,400 | $3.43 | 26d | 2 | 1.04mi |
| 6435 Yellowstone Blvd Unit 6G Forest Hills, NY | — | 1.0 | 575 | $1,900 | $3.30 | 21d | 1 | 1.05mi |
| 10849 63rd Ave Unit 2C Forest Hills, NY | — | 1.0 | 600 | $1,900 | $3.17 | 26d | 1 | 1.05mi |
| 66-01 Burns St Apt 3v Rego Park, NY | 1.0 | 1.0 | 820 | $2,300 | $2.80 | 22d | 1 | 1.06mi |
| 10525 65th Ave Unit 4F Forest Hills, NY | 2.0 | 1.0 | 980 | $3,998 | $4.08 | 17d | 1 | 1.06mi |
HOA detail condo
- Monthly dues
- $0 · $0/yr
- Assessments
- None detected in remarks — confirm with the listing agent.
Listing history 9 events
-
2026-03-10status Pending
-
2025-11-13status Active
-
2025-10-21historical
-
2025-09-10price $245,000
-
2025-07-18price $249,000
-
2025-04-19$259,000 Active
-
2025-01-26historical
-
2024-12-02price $260,000
-
2024-10-08$270,000 Active
ⓘ Source: listings_history table (triggers on properties + properties_extension) + one-shot
backfill from property_details.listing_events for pre-trigger history.
Climate risk First Street
- Flood 8/10 Severe FEMA zone X (unshaded) · 98% chance over 30 yrs
- Wildfire 1/10 Low
- Heat 6/10 Major 7 d/yr ≥99°F today · 15 d/yr by 30 yrs out
- Wind 6/10 Major 27% chance of damaging wind over 30 yrs
- Air quality 5/10 Major 6 unhealthy d/yr today · 8 by 30 yrs out
Nearby sold comps map
Loading sold comps map…
Walkable amenities ~0.75 mi
Loading nearby amenities…
Taxation est. · year 1
- Rental income
- $30,388
- − Mortgage interest
- −$13,724
- − Property taxes
- −$3,675
- − Insurance
- −$2,022
- − Repairs & maintenance
- −$2,431
- − Management
- −$2,431
- − Depreciation
- −$7,127
- Taxable loss
- −$1,023
- Est. tax savings @ 24.0%
- +$245
- After-tax cash flow
- $3,137/yr
For passive investors: Depreciation is non-cash, so a rental often shows a tax loss while cash-flowing — sheltering income. Rental losses are passive: they offset passive income freely, and up to $25,000/yr can offset ordinary (W-2) income if you actively participate and your MAGI is under $100k (phasing out to $0 by $150k); unused losses carry forward. On sale, claimed depreciation is recaptured at up to 25%, and gains may owe capital-gains tax (a 1031 exchange can defer both). Figures are a year-1 estimate at your 24.0% rate — not tax advice; consult a CPA.
Schools (NCES district)
No district data.
Livability — New York
- Score
- 75/100
- State rank
- #268
- US rank
- #4188
Category grades
Schools grade is shown separately in the Schools card above.
Census & demographics
- Census place
- New York, NY
- County
- Queens County · 1,914,869 people
- City population
- 7,731,280
- Metro
- New York-Newark-Jersey City, NY-NJ-PA
- Population (ZIP)
- 98,403
- Household income
- $71,480
- Rent vs Own
- Severe rent burden
- 7283.0
Population outlook (Queens County) Hauer SSP2
- Today (2025)
- 2,546,320 people
- By 2030
- 2,643,059 · +3.8%
- By 2040
- 2,815,563 · +10.6%
- By 2050
- 2,944,423 · +15.6%
- By 2075
- 3,123,338 · +22.7%
- By 2100
- 3,098,688 · +21.7%
Race, ethnicity, and origin ACS 2023
- Neighborhood character
- Diverse neighborhood (Simpson 0.58)
- Race & ethnicity
- Asian 48% Hispanic / Latino 43% Two or more races 8% White 5% Black 2%
- Hispanic origin (detail)
- Mexican 13% Puerto Rican 1% Dominican 4%
- Common ancestry
- Romanian 1%
- Foreign-born
- 66% · Canada, China, Jamaica
- Languages at home
- 14% English-only · Spanish 40% Chinese 16% Other Indo-European 13%
Political lean MEDSL · Queens
- 2024 margin
- Strong D (+24.6) · D 62.3% · R 37.7%
- 2008→2024 swing
- -26.2pp toward R · 2008: 50.8pp · 2024: 24.6pp
- All cycles
- 2024: D+24.6 2020: D+45.2 2016: D+53.4 2012: D+58.5 2008: D+50.8
Not yet ingested
- Civics
- —
Market trends
- HPI YoY
- ▼ -0.98%
- Current HPI
- 244.1055
- Rent YoY
- ▲ 7.15%
- Metro
- New York-Newark-Jersey City, NY-NJ-PA
- State GDP YoY
- ▲ 2.60%
- F500 in state
- 92
Industry mix (Fortune 500 HQ in NY)
| Industry | F500 HQs | Revenue |
|---|---|---|
| Financial Services | 10 | $950B |
|
||
| Consumer Goods | 9 | $162B |
|
||
| Insurance | 4 | $225B |
|
||
| Telecommunications | 2 | $144B |
|
||
| Pharmaceuticals | 2 | $112B |
|
||
| Media / Entertainment | 2 | $69B |
|
||
Price history
-9.3% since first listed9 events — show timeline
- 2026-03-10 Pending — OneKey® MLS as Distributed by MLS Grid
- 2025-11-13 Relisted — OneKey® MLS as Distributed by MLS Grid
- 2025-10-21 Listing Removed — OneKey® MLS as Distributed by MLS Grid
- 2025-09-10 Price Changed $245,000 OneKey® MLS as Distributed by MLS Grid
- 2025-07-18 Price Changed $249,000 OneKey® MLS as Distributed by MLS Grid
- 2025-04-19 Listed $259,000 OneKey® MLS as Distributed by MLS Grid
- 2025-01-26 Listing Removed — OneKey® MLS as Distributed by MLS Grid
- 2024-12-02 Price Changed $260,000 OneKey® MLS as Distributed by MLS Grid
- 2024-10-08 Listed $270,000 OneKey® MLS as Distributed by MLS Grid
Cash-flow waterfall
monthlySold comps — $/sqft
last 12 mo · ≤1 miLoading sold comps…