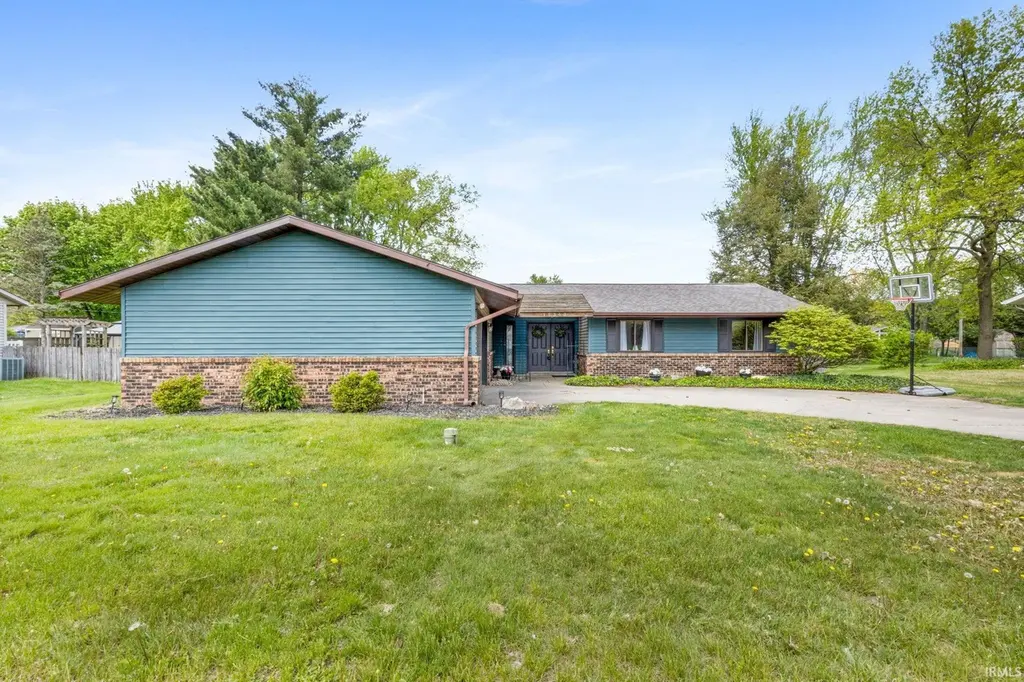
15363 Montecito Dr · Granger, IN
Flood risk 4/10 · Minor
- FEMA flood zone
- X (unshaded)
- Chance of flooding over 30 yrs
- 0.22%
- Est. flood insurance / yr
- $507 – $1,088
Fire risk 1/10 · Minimal
- Est. fire insurance / yr
- $717 – $1,331
Heat risk 2/10 · Minimal
- Hot days now (above 100°F)
- 7 days/yr
- Hot days in 30 yrs
- 16 days/yr
Wind risk 2/10 · Minimal
- Chance of severe wind over 30 yrs
- —
Air-quality risk 3/10 · Minor
- Unhealthy air days now
- 2 days/yr
- Unhealthy air days in 30 yrs
- 3 days/yr
Risk factors via First Street. Map © Google.
Why this score? — see what drove the D+ grade
The composite is a weighted blend of 9 inputs, each scored 0–100. Each bar is that input's sub-score; the figure is the points it added to the 100-point composite (weight × sub-score).
- Cash flow +19.3/30.0
- DSCR +6.1/10.0
- ARV discount +6.0/15.0
- Schools +5.1/10.0
- 1% rule +4.2/10.0
- Livability +3.9/5.0
- Rent growth +2.5/5.0
- Condition / age +2.5/5.0
- Appreciation +0.0/10.0
$249,900
🖨 Deal sheet 📄 Offer letter ✓ Due diligence
Listing remarks MLS
135. This lovely, updated ranch home sits on a 0.44-acre lot in Granger and offers 3 bedrooms and 2.5 bathrooms. It is located in the Penn School District and is a short drive from Mishawaka and South Bend, as well as popular shopping and dining options. The foyer leads into the Living Room, which features a vaulted ceiling with an exposed wood beam, brick fireplace, and a sliding door to the back deck. The eat-in kitchen features a dining area and is spacious and open. The Master Bedroom has access to the deck and an updated bathroom with ceramic tile flooring and a stand-up shower. The laundry room includes cabinet space and a half bath. Two additional bedrooms and a full bathroom finish out the living space of this great floor plan. The large backyard includes a deck with bench seats, a shed, and beautiful landscaping. Attached 2-car garage. Recent improvements include; new roof, furnace, and AC in the last two years - this home has been very well-maintained. Schedule a showing today!
Key facts
- Large deck
- 0.44-acre lot
- Penn school district
Tags
Property features AI
Finance
- Other: Lot dimensions approximately 100 x 192 (0.44 acre)
Exterior
- Parking: Attached garage with 2 parking spaces; Garage door opener
- Utilities: Private well water; Septic tank sewer
- Home design: Single-family residence (site-built); One single-story; Entry level: Main
- Construction: Brick and vinyl siding exterior; Slab foundation; Built as a site-built home
- Exterior features: Deck; Shed(s) on the property
Interior
- Kitchen: Refrigerator; Gas range; Eat-in kitchen
- Bedrooms: Master bedroom on the main level
- Bathrooms: 2 full bathrooms; 1 half bathroom
- Heating & cooling: Natural gas forced-air heating; Central air conditioning; Ceiling fans
- Interior features: Entrance foyer; Ceiling fans; Eat-in kitchen; Master suite on the main level; One fireplace located in the family room
- Laundry & utility: Washer hookup on the main level; Washer included; Owned water softener
Neighborhood map
What this means for you Summary
Snapshot
- This is a 3-bed/1.5-bath single-family listed at $250k.
Deal economics
- At list price, monthly cash flow is $274 ($3k/yr) — positive.
- The deal already cash-flows at list — no discount required.
- To meet the 1% rule (rent ≥ 1% of price), the offer needs to be $231k (7.5% below list).
- Recommended offer: $231k (7.5% below list) — sets the bar for 1% rule.
- Cap rate 7.6% vs local median 3.3% in Granger — top-decile yield for the area; either an underpriced asset or a hidden risk that comps aren't pricing in. Stress-test before assuming the spread holds.
Location & tenants
- Location reads 78/100 on livability (#33 in IN, #2,584 nationally) — a middle-class / working-renter tenant base. Strengths: crime A+, employment A+, cost of living A+; Watch: amenities F, commute F.
- Penn-Harris-Madison School Corporation (suburban): math 54% / reading 64% proficiency, ranked #19 of 301 in IN (top 6%) — acceptable for families but not a draw, mixed tenant base, ~2y average lease.
- Zoned schools: Prairie Vista Elementary School (math 84% / reading 81%, grade A+, #4 of 994 statewide, top 0%, 509 students, 16% FRL); Schmucker Middle School (math 40% / reading 56%, grade C-, #60 of 330 statewide, top 18%, 1,004 students, 36% FRL); Penn High School (math 53% / reading 83%, grade B, #22 of 369 statewide, top 6%, 3,624 students, 27% FRL).
- Market conditions: 204 active listings in the ZIP; 4 comparable units currently listed for rent nearby; rentals leasing fast (median 13d on market — plan ~1-2 weeks tenant-placement turnaround); high-income renter base; 754 units permitted in St. Joseph County in 2024 (460 in 5+ unit buildings).
Forward outlook
- Local home prices are declining (-3.0%/yr); year-one equity from $2k of loan paydown is wiped out by about $7k of value loss. Plan a longer hold.
Negotiation context
- Only 2 days on market — expect competitive offers; lowballing is unlikely to land.
- 2 sale attempts since 9y ago with the ask held roughly flat each time — persistent listings suggest the price (not the market) is what's stuck; bring a comps-based counter.
- Current owner paid $150k; list at $250k implies a 67% gain — meaningful room to come down on a strong offer.
Questions for the listing agent
- Built in 1972 — when were the roof, HVAC, electrical panel, plumbing, and water heater last replaced?
- Is there a deadline driving the sale (1031 exchange, divorce, estate, relocation)? That informs how much negotiation room exists.
- Schools are A-rated — typically a magnet for longer-tenancy family renters. What's the average tenant stay here, and is there a school-zone premium baked into asking?
- The area grade is low — what's the realistic commute time and amenity access for the typical tenant pool here? Any planned neighborhood developments (good or bad) we should know about?
- What's the average days-on-market for RENTAL listings here right now (not sales)? A rising rental-DOM trend means longer vacancies and softer asking-rent achievability than the comps imply.
- What's the recent tenant-quality profile in this submarket — average credit score on applications, eviction rate, late-payment / NSF rate, and stable-employment percentage? A property-management company in the area should have these aggregated.
- How much new for-sale + rental construction is in the pipeline within 1–3 miles? Heavy new supply typically softens prices + rents 12–24 months out; constrained supply supports both.
Investment metrics
- 1% rule
- 0.92% ✗
- Cap rate
- 7.61%
- Cash-on-cash
- 4.70%
- DSCR
- 1.21
- GRM
- 9.0
CMA / ARV
- ARV (on-the-fly)
- $241,920
- Comps found
- 9
Show comp detail 9 sales within ~0.75 mi
| Address | Dist | Beds/Ba | Sqft | Sold | Price | $/sf | Match |
|---|---|---|---|---|---|---|---|
| 52363 Filbert Rd | 0.25mi | 3/1.5 | 1,457 (+1%) | 5mo | $245,000 | $168 | 82 |
| 52311 Monte Vista Dr | 0.09mi | 3/2.0 | 1,510 (+5%) | 5mo | $370,000 | $245 | 81 |
| 15278 Montecito Dr | 0.08mi | 3/1.5 | 1,630 (+13%) | 9mo | $269,900 | $166 | 66 |
| 15258 Kerlin Dr | 0.11mi | 3/2.0 | 1,280 (-11%) | 10mo | $267,005 | $209 | 66 |
| 15638 Hamilton St | 0.32mi | 3/1.0 | 1,284 (-11%) | 3mo | $200,000 | $156 | 62 |
| 52650 Santa Monica Dr | 0.44mi | 3/2.0 | 1,531 (+6%) | 7mo | $270,000 | $176 | 61 |
| 15625 Darden Rd | 0.26mi | 3/1.0 | 1,248 (-13%) | 10mo | $210,000 | $168 | 55 |
| 15436 Monterosa Dr | 0.15mi | 4/2.0 (+1) | 1,628 (+13%) | 19mo | $290,000 | $178 | 49 |
| 52451 Zellers St | 0.45mi | 3/1.0 | 1,232 (-14%) | 9mo | $190,000 | $154 | 45 |
Match score weights: distance 35% · size 25% · config 20% · recency 20%. Top-matched comps best support the ARV.
Projected returns pro-forma
-3.0% appreciation · 3.0% rent growth · sell at horizon
- IRR
- -9.0%
- Equity multiple
- 0.67×
- Total profit
- $-23,106
- Equity at exit
- $37,261
- IRR
- 0.4%
- Equity multiple
- 1.03×
- Total profit
- $2,068
- Equity at exit
- $21,607
Cash invested: $69,972 (down + closing). Projections, not guarantees.
Landlord ↔ Tenant lean methodology
- Overall (STATE)
- 90 Strongly Landlord-Friendly
- State Indiana
- 90 Strongly Landlord-Friendly · R+11
- County
- — inherits STATE
- City
- — inherits STATE
ZIP-level market 46530
- Home prices YoY
- -32.8%
- Active inventory
- 204
- Price-to-rent
- 9.0×
Monthly cashflow live
- Estimated rent
- $2,311 medium interval (Pro) →
- Mortgage (P&I)
- −$1,311
- Tax from tax record
- −$137 /mo · $1,642/yr
- Insurance
- −$104
- HOA
- −$0
- Vacancy / Maint / Mgmt
- −$485
- Net cashflow
- $274
Break-even live
UW: 25.0% down · 7.5% · 30yr · 1.5% tax · 5.0% vac · 8.0% maint · 8.0% mgmt
Financing live
Cash to close
- Down payment
- $62,475
- Closing costs
- $7,497
- Reserves months
- —
- Total cash needed
- —
Loan-product check · same deal, 3 products live
Conventional
25% down · 7.5% · 30yr
- Down + closing
- —
- Monthly P&I
- —
- Monthly cashflow
- —
- DSCR
- —
- Eligible?
- —
Personal DTI + credit; lowest rate.
DSCR
20% down · 8.5% · 30yr
- Down + closing
- —
- Monthly P&I
- —
- Monthly cashflow
- —
- DSCR
- —
- Eligible?
- —
No personal income docs; deal must DSCR.
Hard money
10% down · 12.0% · 12mo
- Down + closing
- —
- Monthly P&I
- —
- Monthly cashflow
- —
- DSCR
- —
- Eligible?
- —
Short-term bridge; refi at stabilization.
Rent comps 4 comps
| Address | Beds | Baths | Sqft | Rent | $/sqft | DOM | Units | Dist |
|---|---|---|---|---|---|---|---|---|
| 51998 Fir Rd Granger, IN | 3.0 | 1.0 | 1260 | $2,400 | $1.90 | 13d | 1 | 0.52mi |
| 424 Spring Lake Blvd Granger, IN | 1.0–2.0 | 1.0–2.0 | 868 | $1,722 | $1.98 | 13d | 14 | 0.84mi |
| 2110 Beacon Pkwy Granger, IN | 3.0 | 1.0–2.0 | 1023 | $2,403 | $2.35 | 13d | 30 | 0.93mi |
| 6205 N Fir Rd Granger, IN | 1.0–3.0 | 1.0–2.0 | 1285 | $2,671 | $2.08 | 13d | 22 | 1.24mi |
Listing history 4 events
-
2026-05-07status Pending
-
2026-05-04$249,900 Active
-
2017-04-01soldstatus $149,900 1002-char remark
Show marketing remark (1002 chars)
135. This lovely, updated ranch home sits on a 0.44-acre lot in Granger and offers 3 bedrooms and 2.5 bathrooms. It is located in the Penn School District and is a short drive from Mishawaka and South Bend, as well as popular shopping and dining options. The foyer leads into the Living Room, which features a vaulted ceiling with an exposed wood beam, brick fireplace, and a sliding door to the back deck. The eat-in kitchen features a dining area and is spacious and open. The Master Bedroom has access to the deck and an updated bathroom with ceramic tile flooring and a stand-up shower. The laundry room includes cabinet space and a half bath. Two additional bedrooms and a full bathroom finish out the living space of this great floor plan. The large backyard includes a deck with bench seats, a shed, and beautiful landscaping. Attached 2-car garage. Recent improvements include; new roof, furnace, and AC in the last two years - this home has been very well-maintained. Schedule a showing today!
-
2017-03-20$149,900 1002-char remark
Show marketing remark (1002 chars)
135. This lovely, updated ranch home sits on a 0.44-acre lot in Granger and offers 3 bedrooms and 2.5 bathrooms. It is located in the Penn School District and is a short drive from Mishawaka and South Bend, as well as popular shopping and dining options. The foyer leads into the Living Room, which features a vaulted ceiling with an exposed wood beam, brick fireplace, and a sliding door to the back deck. The eat-in kitchen features a dining area and is spacious and open. The Master Bedroom has access to the deck and an updated bathroom with ceramic tile flooring and a stand-up shower. The laundry room includes cabinet space and a half bath. Two additional bedrooms and a full bathroom finish out the living space of this great floor plan. The large backyard includes a deck with bench seats, a shed, and beautiful landscaping. Attached 2-car garage. Recent improvements include; new roof, furnace, and AC in the last two years - this home has been very well-maintained. Schedule a showing today!
ⓘ Source: listings_history table (triggers on properties + properties_extension) + one-shot
backfill from property_details.listing_events for pre-trigger history.
Tax reassessment forecast IN · Partial reset (capped growth)
- Current annual tax
- $1,642 · $137/mo
- Projected year-2 tax
- $1,883 · $157/mo
- Expected delta
- +$241/yr (+$20/mo · 14.7%)
ⓘ Screening estimate from a state-policy table — verify with the county assessor before closing.
Climate risk First Street
- Flood 4/10 Moderate FEMA zone X (unshaded) · 22% chance over 30 yrs
- Wildfire 1/10 Low
- Heat 2/10 Low 7 d/yr ≥100°F today · 16 d/yr by 30 yrs out
- Wind 2/10 Low
- Air quality 3/10 Moderate 2 unhealthy d/yr today · 3 by 30 yrs out
Nearby sold comps map
Loading sold comps map…
Walkable amenities ~0.75 mi
Loading nearby amenities…
Taxation est. · year 1
- Rental income
- $27,731
- − Mortgage interest
- −$13,998
- − Property taxes
- −$1,642
- − Insurance
- −$1,250
- − Repairs & maintenance
- −$2,218
- − Management
- −$2,218
- − Depreciation
- −$7,270
- Taxable loss
- −$866
- Est. tax savings @ 24.0%
- +$208
- After-tax cash flow
- $3,498/yr
For passive investors: Depreciation is non-cash, so a rental often shows a tax loss while cash-flowing — sheltering income. Rental losses are passive: they offset passive income freely, and up to $25,000/yr can offset ordinary (W-2) income if you actively participate and your MAGI is under $100k (phasing out to $0 by $150k); unused losses carry forward. On sale, claimed depreciation is recaptured at up to 25%, and gains may owe capital-gains tax (a 1031 exchange can defer both). Figures are a year-1 estimate at your 24.0% rate — not tax advice; consult a CPA.
Schools (NCES district)
- District
- Penn-Harris-Madison School Corporation
- NCES district ID
- 1808760
- Math proficiency
- 54% ▼ -11.00%
- Reading proficiency
- 64% ▼ -6.00%
- Median HH income
- $59,421
- Composite
- 51.11/100
- National rank
- #1764
- State rank
- #19 of 301 in IN
Livability — Granger
- Score
- 78/100
- State rank
- #33
- US rank
- #2584
Category grades
Schools grade is shown separately in the Schools card above.
Census & demographics
- Census place
- Granger, IN
- County
- Saint Joseph County · 189,048 people
- City population
- 31,598
- Metro
- South Bend-Mishawaka, IN-MI
- Population (ZIP)
- 31,598
- Household income
- $122,129
- Rent vs Own
- Severe rent burden
- 671.0
Population outlook (St. Joseph County) Hauer SSP2
- Today (2025)
- 273,186 people
- By 2030
- 273,594 · +0.1%
- By 2040
- 271,641 · -0.6%
- By 2050
- 269,187 · -1.5%
- By 2075
- 263,136 · -3.7%
- By 2100
- 245,659 · -10.1%
Race, ethnicity, and origin ACS 2023
- Neighborhood character
- Predominantly White (80%)
- Race & ethnicity
- White 80% Asian 7% Two or more races 7% Hispanic / Latino 6% Black 2%
- Hispanic origin (detail)
- Mexican 4%
- Common ancestry
- Romanian 8% Slovak 3% Italian 3%
- Foreign-born
- 8% · Canada, South Korea, China
- Languages at home
- 89% English-only · Other Indo-European 3% Spanish 2% German/W. Germanic 1%
Political lean MEDSL · St. Joseph
- 2024 margin
- Toss-up / Even · D 50.0% · R 48.5% · Other 1.5%
- 2008→2024 swing
- -15.6pp toward R · 2008: 17.1pp · 2024: 1.5pp
- All cycles
- 2024: D+1.5 2020: D+5.8 2016: D+0.2 2012: D+3.5 2008: D+17.1
Not yet ingested
- Civics
- —
Market trends
- HPI YoY
- ▼ -94.73%
- Current HPI
- 194.0944
- Rent YoY
- —
- Metro
- South Bend-Mishawaka, IN-MI
- State GDP YoY
- ▲ 2.90%
- F500 in state
- 18
Industry mix (Fortune 500 HQ in IN)
| Industry | F500 HQs | Revenue |
|---|---|---|
| Industrial Machinery | 2 | $37B |
|
||
| Healthcare | 1 | $177B |
|
||
| Pharmaceuticals | 1 | $45B |
|
||
| Metals / Steel | 1 | $18B |
|
||
| Agriculture | 1 | $17B |
|
||
| Packaging | 1 | $12B |
|
||
Price history
+66.7% since first listed4 events — show timeline
- 2026-05-07 Pending — IRMLS
- 2026-05-04 Listed $249,900 IRMLS
- 2017-04-01 Sold (MLS) $149,900 IRMLS
- 2017-03-20 Listed $149,900 IRMLS
Property tax history
+6.9%/yrLatest (2023): $1,642 · +5.1% YoY. Source: county tax records.
Cash-flow waterfall
monthlySold comps — $/sqft
last 12 mo · ≤1 miLoading sold comps…