None · Louisville, KY
Flood risk 4/10 · Minor
- FEMA flood zone
- X (shaded)
- Chance of flooding over 30 yrs
- 0.22%
- Est. flood insurance / yr
- $507 – $1,088
Fire risk 1/10 · Minimal
- Est. fire insurance / yr
- $839 – $1,559
Heat risk 5/10 · Moderate
- Hot days now (above 105°F)
- 7 days/yr
- Hot days in 30 yrs
- 20 days/yr
Wind risk 2/10 · Minimal
- Chance of severe wind over 30 yrs
- 1.0%
Air-quality risk 2/10 · Minimal
- Unhealthy air days now
- 1 days/yr
- Unhealthy air days in 30 yrs
- 2 days/yr
Risk factors via First Street. Map © Google.
Why this score? — see what drove the C+ grade
The composite is a weighted blend of 9 inputs, each scored 0–100. Each bar is that input's sub-score; the figure is the points it added to the 100-point composite (weight × sub-score).
- Cash flow +30.0/30.0
- DSCR +10.0/10.0
- 1% rule +8.1/10.0
- Rent growth +3.7/5.0
- Livability +3.2/5.0
- Condition / age +2.5/5.0
- Schools +2.3/10.0
- ARV discount +0.2/15.0
- Appreciation +0.0/10.0
$99,999
🖨 Deal sheet (PDF) 📄 Offer letter ✓ Due diligence
Listing remarks MLS
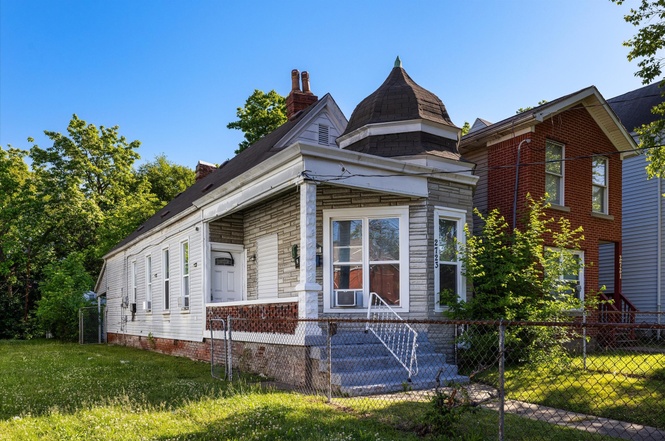
Beautifully Updated Home that can be used as Single Family or Duplex! Home has 2 Entrances, 2 Kitchens & 2 Bathrooms. Recently added new Windows, new Flooring, New Plumbing, Fresh Paint, & Kitchen & Bathroom Additions. High Ceilings & Large Windows. Gorgeous Front Bay Window. Lovely Fireplace. Furnace installed 2020. Completely fenced yard. Extra Storage in 1 Car Garage. Sellers have rented it as Duplex for $1,500 per month ($750 per apartment & Sellers paid for utilities). One Seller is a Sales Associate Licensed in the State of Kentucky. Home is ready to Move In!
Key facts
- Brand-new flooring
- Income potential
- Fresh paint
Tags
Property features AI
Finance
- HOA & community: No association fee
Exterior
- Parking: 1 covered parking space (garage not covered); 1 total parking space
- Utilities: Electricity connected; Public utilities (no separate meters)
- Home design: Duplex; Built in 1900; Shingle roof; Aluminum siding
- Construction: Aluminum siding construction; Shingle roof; Built in 1900; Other building area source
- Exterior features: Sidewalks
Interior
- Kitchen: Each unit includes a kitchen; Refrigerator included in each unit
- Bedrooms: 2 bedrooms
- Bathrooms: 2 full bathrooms
- Heating & cooling: Electric heating; 1 furnace; 2 HVAC units
- Interior features: Basement present
- Laundry & utility: Laundry in-unit for one level
Neighborhood map
What this means for you Summary
Snapshot
- This is a 4-bed/4.0-bath single-family listed at $100k.
Deal economics
- At list price, monthly cash flow is $386 ($5k/yr) — positive.
- The deal already cash-flows at list — no discount required.
- Meets the 1% rule at list price ($1k rent vs $100k).
- Recommended offer: $88k (12.0% below list) — sets the bar for market timing.
- Cap rate 10.9% vs local median 5.0% in Louisville — top-decile yield for the area; either an underpriced asset or a hidden risk that comps aren't pricing in. Stress-test before assuming the spread holds.
Location & tenants
- Location reads 63/100 on livability (#333 in KY) — a middle-class / working-renter tenant base. Strengths: cost of living A+, housing A+; Watch: employment C-, health & safety D+, schools D-.
- Jefferson County (urban): math 19% / reading 35% proficiency, ranked #121 of 165 in KY (top 73%) — low school quality limits family demand, transient renter base, plan for 1-2y turnover.
- Market conditions: Rents rising fast (+4.9%/yr); 140 active listings in the ZIP; 40 comparable units currently listed for rent nearby; rentals at typical pace (median 25d on market — plan ~3-4 weeks tenant-placement turnaround); lower-income renter base — watch delinquency; 2,836 units permitted in Jefferson County in 2024 (1,558 in 5+ unit buildings).
- At $1,312/mo this rent would consume 50% of the median local household income ($32k/yr) (locally 1483% of renters already pay >50% of income on rent) — very limited rent-growth headroom before tenants either downsize or default.
Forward outlook
- Local home prices are declining (-3.0%/yr); year-one equity from $691 of loan paydown is wiped out by about $3k of value loss. Plan a longer hold.
- Jefferson County population projected at +13% by 2050 — modest demand growth; plan on rents tracking national, not racing it.
- At projected returns (-3.0% appreciation + 4.9% rent growth), your $28k cash investment doubles in ~7 years — after that, you're playing with house money.
Negotiation context
- It's been on market 139 days — a 12% lower offer ($88k) is reasonable based on typical stale-listing flexibility.
- 7 sale attempts since 27y ago; this cycle's ask has dropped $25k (20%) from the opening price — seller is motivated, your offer sets the floor, not the list.
- Current owner paid $80k; 25% above their basis — modest negotiation headroom, anchor on the comps not their cost.
Risks & watch-outs
- Watch-outs: built in 1900 — expect roof / HVAC / electrical / plumbing capex.
- Climate carrying-cost: extreme-heat days projected 7→20/yr by 2055 (HVAC capex compounding) — expect insurance premiums to compound above CPI over the hold.
Questions for the listing agent
- It's been on market 139 days. Have you received any prior offers? Is the seller open to a 12% concession, seller financing, or rate buy-down credit?
- Built in 1900 — when were the roof, HVAC, electrical panel, plumbing, and water heater last replaced?
- Why hasn't it sold? Are there any deal-killer items the seller is aware of (foundation, flood, title, zoning, code violations)?
- Is there a deadline driving the sale (1031 exchange, divorce, estate, relocation)? That informs how much negotiation room exists.
- Schools are D-rated, which usually means shorter tenancies and higher turnover. Who's the typical renter profile here, and what's been the actual vacancy rate?
- Crime grade is F in this area — have there been break-ins, vandalism, or insurance claims at this property in the last 3 years? What carrier currently insures it and at what premium?
- What's the average days-on-market for RENTAL listings here right now (not sales)? A rising rental-DOM trend means longer vacancies and softer asking-rent achievability than the comps imply.
- What's the recent tenant-quality profile in this submarket — average credit score on applications, eviction rate, late-payment / NSF rate, and stable-employment percentage? A property-management company in the area should have these aggregated.
- How much new for-sale + rental construction is in the pipeline within 1–3 miles? Heavy new supply typically softens prices + rents 12–24 months out; constrained supply supports both.
Investment metrics
- 1% rule
- 1.31% ✓
- Cap rate
- 10.93%
- Cash-on-cash
- 16.56%
- DSCR
- 1.74
- GRM
- 6.4
CMA / ARV
- ARV (on-the-fly)
- $86,100
- Comps found
- 12
Show comp detail 12 sales within ~0.75 mi
| Address | Dist | Beds/Ba | Sqft | Sold | Price | $/sf | Match |
|---|---|---|---|---|---|---|---|
| 2620 W Madison St | 0.10mi | 3/1.5 (-1) | 1,080 (+3%) | 1mo | $74,000 | $69 | 75 |
| 637 S 27th St | 0.15mi | 3/1.0 (-1) | 1,110 (+6%) | 7mo | $40,000 | $36 | 61 |
| 2338 W Madison St | 0.32mi | 4/1.0 | 1,136 (+8%) | 1mo | $125,000 | $110 | 58 |
| 2305 W Madison St | 0.41mi | 3/1.0 (-1) | 1,008 (-4%) | 12mo | $89,610 | $89 | 47 |
| 848 S 23rd St | 0.68mi | 3/2.0 (-1) | 1,029 (-2%) | 6mo | $64,750 | $63 | 47 |
| 403 S 27th St | 0.23mi | 3/2.0 (-1) | 1,175 (+12%) | 13mo | $35,000 | $30 | 45 |
| 2321 W Market St | 0.59mi | 3/1.0 (-1) | 1,138 (+8%) | 1mo | $110,000 | $97 | 41 |
| 807 S 31st St | 0.57mi | 3/1.0 (-1) | 952 (-9%) | 12mo | $25,500 | $27 | 32 |
| 2809 Rowan St | 0.63mi | 3/1.0 (-1) | 1,154 (+10%) | 11mo | $37,000 | $32 | 28 |
| 3131 Garland Ave | 0.70mi | 3/1.0 (-1) | 965 (-8%) | 13mo | $93,000 | $96 | 26 |
| 610 S 35th St | 0.68mi | 3/1.0 (-1) | 1,152 (+10%) | 13mo | $155,000 | $135 | 24 |
| 2802 Duncan St | 0.70mi | 3/2.0 (-1) | 1,202 (+14%) | 12mo | $98,000 | $82 | 20 |
Match score weights: distance 35% · size 25% · config 20% · recency 20%. Top-matched comps best support the ARV.
Projected returns pro-forma
-3.0% appreciation · 4.87% rent growth · sell at horizon
- IRR
- 9.7%
- Equity multiple
- 1.39×
- Total profit
- $10,908
- Equity at exit
- $14,910
- IRR
- 20.3%
- Equity multiple
- 2.85×
- Total profit
- $51,876
- Equity at exit
- $8,646
Cash invested: $28,000 (down + closing). Projections, not guarantees.
Landlord ↔ Tenant lean methodology
- Overall (STATE)
- 83 Strongly Landlord-Friendly
- State Kentucky
- 83 Strongly Landlord-Friendly · R+16
- County
- — inherits STATE
- City
- — inherits STATE
ZIP-level market 40211
- Home prices YoY
- -33.4%
- Rents YoY
- 4.9%
- Active inventory
- 140
- Price-to-rent
- 6.4×
Monthly cashflow live
- Estimated rent
- $1,312 high interval (Pro) →
- Mortgage (P&I)
- −$524
- Tax from tax record
- −$84 /mo · $1,008/yr
- Insurance
- −$42
- HOA
- −$0
- Vacancy / Maint / Mgmt
- −$275
- Net cashflow
- $386
Break-even live
Sensitivity live
| Price | -10% $443 | -5% $415 | +0% $386 | +5% $358 | +10% $330 |
|---|---|---|---|---|---|
| Rent | -10% $283 | -5% $334 | +0% $386 | +5% $438 | +10% $490 |
| Rate | -1.0pp $437 | -0.5pp $412 | base $386 | +0.5pp $360 | +1.0pp $334 |
UW: 25.0% down · 7.5% · 30yr · 1.5% tax · 5.0% vac · 8.0% maint · 8.0% mgmt
Financing live
Cash to close
- Down payment
- $25,000
- Closing costs
- $3,000
- Reserves months
- —
- Total cash needed
- —
Loan-product check · same deal, 3 products live
Conventional
25% down · 7.5% · 30yr
- Down + closing
- —
- Monthly P&I
- —
- Monthly cashflow
- —
- DSCR
- —
- Eligible?
- —
Personal DTI + credit; lowest rate.
DSCR
20% down · 8.5% · 30yr
- Down + closing
- —
- Monthly P&I
- —
- Monthly cashflow
- —
- DSCR
- —
- Eligible?
- —
No personal income docs; deal must DSCR.
Hard money
10% down · 12.0% · 12mo
- Down + closing
- —
- Monthly P&I
- —
- Monthly cashflow
- —
- DSCR
- —
- Eligible?
- —
Short-term bridge; refi at stabilization.
Rent comps 40 comps
| Address | Beds | Baths | Sqft | Rent | $/sqft | DOM | Units | Dist |
|---|---|---|---|---|---|---|---|---|
| 2631 W Madison St Unit 1 Louisville, KY | 3.0 | 1.0 | 928 | $950 | $1.02 | 24d | 1 | 0.07mi |
| 2623 Cedar St Louisville, KY | 3.0 | 1.0 | 1000 | $1,000 | $1.00 | 24d | 1 | 0.23mi |
| 430 S 24th St Louisville, KY | 3.0 | 1.5 | 1288 | $1,400 | $1.09 | 24d | 1 | 0.32mi |
| 2221 W Madison St Louisville, KY | 3.0 | 1.0 | 1000 | $1,350 | $1.35 | 24d | 1 | 0.47mi |
| 2508 W Main St Louisville, KY | 3.0 | 1.0 | 1327 | $1,500 | $1.13 | 24d | 1 | 0.52mi |
| 2529 W Main St #2 Louisville, KY | 3.0 | 1.0 | 1404 | $1,200 | $0.85 | 24d | 1 | 0.53mi |
| 3421 River Park Dr Louisville, KY | 3.0 | 1.0 | 994 | $1,250 | $1.26 | 24d | 1 | 0.63mi |
| 2927 Rowan St Louisville, KY | 3.0 | 1.0 | 1008 | $1,205 | $1.20 | 12d | 1 | 0.65mi |
| 2634 Garland Ave Unit B Louisville, KY | 3.0 | 1.0 | 1152 | $895 | $0.78 | 21d | 1 | 0.65mi |
| 2634 Garland Ave Unit A Louisville, KY | 3.0 | 1.0 | 1152 | $940 | $0.82 | 24d | 1 | 0.65mi |
| 212 N 25th St Louisville, KY | 3.0 | 1.0 | 1104 | $895 | $0.81 | 24d | 1 | 0.66mi |
| 737 S 33rd St Louisville, KY | 4.0 | 1.0 | 1356 | $1,595 | $1.18 | 24d | 1 | 0.67mi |
| 848 S 23rd St Louisville, KY | 3.0 | 1.5 | 1050 | $1,450 | $1.38 | 24d | 1 | 0.70mi |
| 214 N 24th St Louisville, KY | 3.0 | 1.5 | 1012 | $915 | $0.90 | 24d | 1 | 0.70mi |
| 2416 Garland Ave Louisville, KY | 3.0 | 2.0 | 1172 | $1,600 | $1.37 | 24d | 1 | 0.70mi |
| 2711 W Kentucky St Louisville, KY | 3.0 | 1.0 | 1155 | $1,100 | $0.95 | 24d | 1 | 0.71mi |
| 814 S 33rd St Louisville, KY | 3.0 | 1.0 | 1104 | $1,350 | $1.22 | 4d | 1 | 0.74mi |
| 2710 W Kentucky St Apt 2 Louisville, KY | 3.0 | 1.0 | 1015 | $1,300 | $1.28 | 24d | 1 | 0.75mi |
| 2821 Greenwood Ave #1 Louisville, KY | 3.0 | 1.0 | 1113 | $1,300 | $1.17 | 24d | 1 | 0.81mi |
| 803 S 35th St Louisville, KY | 3.0 | 1.0 | 1486 | $1,350 | $0.91 | 24d | 1 | 0.81mi |
| 2825 Greenwood Ave #4 Louisville, KY | 3.0 | 1.0 | 1440 | $1,250 | $0.87 | 24d | 1 | 0.81mi |
| 3122 W Kentucky St Louisville, KY | 3.0 | 1.0 | 1030 | $1,150 | $1.12 | 24d | 1 | 0.83mi |
| 2708 Greenwood Ave Apt 1 Louisville, KY | 3.0 | 1.0 | 1100 | $1,300 | $1.18 | 24d | 1 | 0.84mi |
| 2433 Slevin St Unit 2433-2 Louisville, KY | 3.0 | 1.0 | 800 | $875 | $1.09 | 4d | 1 | 0.85mi |
| 2912 Greenwood Ave Louisville, KY | 3.0 | 2.0 | 1362 | $1,150 | $0.84 | 16d | 1 | 0.85mi |
| 1810 Magazine St Louisville, KY | 3.0 | 1.5 | 1248 | $1,450 | $1.16 | 11d | 1 | 0.86mi |
| 120 N 20th St Louisville, KY | 3.0 | 1.5 | 1300 | $1,400 | $1.08 | 24d | 1 | 0.88mi |
| 652 S 37th St #9 Louisville, KY | 3.0 | 1.0 | 1070 | $1,095 | $1.02 | 24d | 1 | 0.91mi |
| 627 S 38th St Louisville, KY | 4.0 | 1.0 | 1300 | $1,349 | $1.04 | 16d | 1 | 0.95mi |
| 3819 River Park Dr Louisville, KY | 3.0 | 1.0 | 1108 | $1,090 | $0.98 | 21d | 1 | 0.99mi |
| 2706 Hale Ave Unit 1 Louisville, KY | 3.0 | 1.0 | 1100 | $1,400 | $1.27 | 24d | 1 | 1.03mi |
| 1115 S 32nd St Louisville, KY | 3.0 | 1.0 | 1393 | $1,275 | $0.92 | 22d | 1 | 1.05mi |
| 1115 S 32nd St Louisville, KY | 3.0 | 1.0 | 1393 | $1,275 | $0.92 | 24d | 1 | 1.05mi |
| 628 S 39th St Louisville, KY | 3.0 | 1.0 | 1448 | $1,220 | $0.84 | 16d | 1 | 1.05mi |
| 409 N 20th St Louisville, KY | 3.0 | 1.0 | 1200 | $1,050 | $0.88 | 4d | 1 | 1.07mi |
| 1155 S 28th St Unit 4 Louisville, KY | 4.0 | 2.0 | 1010 | $1,350 | $1.34 | 24d | 1 | 1.07mi |
| 320 N 36th St Louisville, KY | 3.0 | 1.0 | 830 | $1,225 | $1.48 | 16d | 1 | 1.08mi |
| 823 S 38th St Louisville, KY | 3.0 | 1.0 | 1100 | $1,195 | $1.09 | 4d | 1 | 1.09mi |
| 1704 Rowan St Unit 1704-2 Louisville, KY | 3.0 | 1.0 | 740 | $850 | $1.15 | 24d | 1 | 1.11mi |
| 1723 W Kentucky St Unit 3 Louisville, KY | 3.0 | 1.0 | 1200 | $1,300 | $1.08 | 24d | 1 | 1.11mi |
Listing history 32 events
-
2026-06-18days on market $99,999 Active 139 DOM
-
2026-06-17days on market $99,999 Active 138 DOM
-
2026-06-16days on market $99,999 Active 137 DOM
-
2026-06-15days on market $99,999 Active 136 DOM
-
2026-06-13days on market $99,999 Active 134 DOM
-
2026-06-10days on market $99,999 Active 131 DOM
-
2026-06-09days on market $99,999 Active 130 DOM
-
2026-06-08days on market $99,999 Active 129 DOM
-
2026-06-07days on market $99,999 Active 128 DOM
-
2026-06-03days on market $99,999 Active 124 DOM
-
2026-06-02days on market $99,999 Active 123 DOM
-
2026-06-01days on market $99,999 Active 122 DOM
-
2026-05-31days on market $99,999 Active 121 DOM
-
2026-04-22price $99,999
-
2026-03-29price $105,000
-
2026-02-28price $115,000
-
2026-01-30$125,000 Active
-
2023-04-24soldstatus $80,000
-
2023-04-20soldstatus $80,000 Closed 600-char remark
Show marketing remark (600 chars)
Beautifully Updated Home that can be used as Single Family or Duplex! Home has 2 Entrances, 2 Kitchens & 2 Bathrooms. Recently added new Windows, new Flooring, New Plumbing, Fresh Paint, & Kitchen & Bathroom Additions. High Ceilings & Large Windows. Gorgeous Front Bay Window. Lovely Fireplace. Furnace installed 2020. Completely fenced yard. Extra Storage in 1 Car Garage. Sellers have rented it as Duplex for $1,500 per month ($750 per apartment & Sellers paid for utilities). One Seller is a Sales Associate Licensed in the State of Kentucky. Home is ready to Move In!
-
2023-03-16status Pending 600-char remark
Show marketing remark (600 chars)
Beautifully Updated Home that can be used as Single Family or Duplex! Home has 2 Entrances, 2 Kitchens & 2 Bathrooms. Recently added new Windows, new Flooring, New Plumbing, Fresh Paint, & Kitchen & Bathroom Additions. High Ceilings & Large Windows. Gorgeous Front Bay Window. Lovely Fireplace. Furnace installed 2020. Completely fenced yard. Extra Storage in 1 Car Garage. Sellers have rented it as Duplex for $1,500 per month ($750 per apartment & Sellers paid for utilities). One Seller is a Sales Associate Licensed in the State of Kentucky. Home is ready to Move In!
-
2023-03-01price $89,795 600-char remark
Show marketing remark (600 chars)
Beautifully Updated Home that can be used as Single Family or Duplex! Home has 2 Entrances, 2 Kitchens & 2 Bathrooms. Recently added new Windows, new Flooring, New Plumbing, Fresh Paint, & Kitchen & Bathroom Additions. High Ceilings & Large Windows. Gorgeous Front Bay Window. Lovely Fireplace. Furnace installed 2020. Completely fenced yard. Extra Storage in 1 Car Garage. Sellers have rented it as Duplex for $1,500 per month ($750 per apartment & Sellers paid for utilities). One Seller is a Sales Associate Licensed in the State of Kentucky. Home is ready to Move In!
-
2023-03-01status Active 600-char remark
Show marketing remark (600 chars)
Beautifully Updated Home that can be used as Single Family or Duplex! Home has 2 Entrances, 2 Kitchens & 2 Bathrooms. Recently added new Windows, new Flooring, New Plumbing, Fresh Paint, & Kitchen & Bathroom Additions. High Ceilings & Large Windows. Gorgeous Front Bay Window. Lovely Fireplace. Furnace installed 2020. Completely fenced yard. Extra Storage in 1 Car Garage. Sellers have rented it as Duplex for $1,500 per month ($750 per apartment & Sellers paid for utilities). One Seller is a Sales Associate Licensed in the State of Kentucky. Home is ready to Move In!
-
2023-02-21status Pending 600-char remark
Show marketing remark (600 chars)
Beautifully Updated Home that can be used as Single Family or Duplex! Home has 2 Entrances, 2 Kitchens & 2 Bathrooms. Recently added new Windows, new Flooring, New Plumbing, Fresh Paint, & Kitchen & Bathroom Additions. High Ceilings & Large Windows. Gorgeous Front Bay Window. Lovely Fireplace. Furnace installed 2020. Completely fenced yard. Extra Storage in 1 Car Garage. Sellers have rented it as Duplex for $1,500 per month ($750 per apartment & Sellers paid for utilities). One Seller is a Sales Associate Licensed in the State of Kentucky. Home is ready to Move In!
-
2022-10-21$93,683 Active 600-char remark
Show marketing remark (600 chars)
Beautifully Updated Home that can be used as Single Family or Duplex! Home has 2 Entrances, 2 Kitchens & 2 Bathrooms. Recently added new Windows, new Flooring, New Plumbing, Fresh Paint, & Kitchen & Bathroom Additions. High Ceilings & Large Windows. Gorgeous Front Bay Window. Lovely Fireplace. Furnace installed 2020. Completely fenced yard. Extra Storage in 1 Car Garage. Sellers have rented it as Duplex for $1,500 per month ($750 per apartment & Sellers paid for utilities). One Seller is a Sales Associate Licensed in the State of Kentucky. Home is ready to Move In!
-
2011-04-27soldstatus $7,726 37-char remark
Show marketing remark (37 chars)
SOLD ''AS-IS'' HOME NEED SOME REPAIRS
-
2011-02-17$8,500 37-char remark
Show marketing remark (37 chars)
SOLD ''AS-IS'' HOME NEED SOME REPAIRS
-
2010-03-04historical
-
2008-12-08$304,000
-
2007-03-20historical
-
2007-01-11$36,155
-
1999-08-30soldstatus $27,900
-
1999-07-26$27,900
ⓘ Source: listings_history table (triggers on properties + properties_extension) + one-shot
backfill from property_details.listing_events for pre-trigger history.
Tax reassessment forecast KY · Resets to sale price
- Current annual tax
- $1,008 · $84/mo
- Projected year-2 tax
- $1,008 · $84/mo
- Expected delta
- $0/yr ($0/mo · 0.0%)
ⓘ Screening estimate from a state-policy table — verify with the county assessor before closing.
Climate risk First Street
- Flood 4/10 Moderate FEMA zone X (shaded) · 22% chance over 30 yrs
- Wildfire 1/10 Low
- Heat 5/10 Major 7 d/yr ≥105°F today · 20 d/yr by 30 yrs out
- Wind 2/10 Low 100% chance of damaging wind over 30 yrs
- Air quality 2/10 Low 1 unhealthy d/yr today · 2 by 30 yrs out
Nearby sold comps map
Loading sold comps map…
Walkable amenities ~0.75 mi
Loading nearby amenities…
Taxation est. · year 1
- Rental income
- $15,742
- − Mortgage interest
- −$5,601
- − Property taxes
- −$1,008
- − Insurance
- −$500
- − Repairs & maintenance
- −$1,259
- − Management
- −$1,259
- − Depreciation
- −$2,909
- Taxable income
- $3,205
- Est. tax owed @ 24.0%
- −$769
- After-tax cash flow
- $3,866/yr
For passive investors: Depreciation is non-cash, so a rental often shows a tax loss while cash-flowing — sheltering income. Rental losses are passive: they offset passive income freely, and up to $25,000/yr can offset ordinary (W-2) income if you actively participate and your MAGI is under $100k (phasing out to $0 by $150k); unused losses carry forward. On sale, claimed depreciation is recaptured at up to 25%, and gains may owe capital-gains tax (a 1031 exchange can defer both). Figures are a year-1 estimate at your 24.0% rate — not tax advice; consult a CPA.
Schools (NCES district)
- District
- Jefferson County
- NCES district ID
- 2102990
- Math proficiency
- 19% ▼ -17.00%
- Reading proficiency
- 35% ▼ -11.00%
- Median HH income
- $47,885
- Composite
- 23.45/100
- National rank
- #7884
- State rank
- #121 of 165 in KY
Livability — Louisville
- Score
- 63/100
- State rank
- #333
- US rank
- #15887
Category grades
Schools grade is shown separately in the Schools card above.
Census & demographics
- Census place
- Louisville, KY
- County
- Jefferson County · 790,184 people
- City population
- 769,292
- Metro
- Louisville/Jefferson County, KY-IN
- Population (ZIP)
- 20,407
- Household income
- $31,749
- Rent vs Own
- Severe rent burden
- 1483.0
Population outlook (Jefferson County) Hauer SSP2
- Today (2025)
- 823,112 people
- By 2030
- 849,343 · +3.2%
- By 2040
- 895,696 · +8.8%
- By 2050
- 933,630 · +13.4%
- By 2075
- 1,028,262 · +24.9%
- By 2100
- 1,072,675 · +30.3%
Race, ethnicity, and origin ACS 2023
- Neighborhood character
- Predominantly Black (90%)
- Race & ethnicity
- Black 90% White 5% Two or more races 4% Hispanic / Latino 1%
- Common ancestry
- Italian 1%
- Foreign-born
- 1% · Canada
- Languages at home
- 98% English-only · Spanish 1%
Political lean MEDSL · Jefferson
- 2024 margin
- D (+16.6) · D 57.4% · R 40.9% · Other 1.7%
- 2008→2024 swing
- +4.5pp toward D · 2008: 12.0pp · 2024: 16.6pp
- All cycles
- 2024: D+16.6 2020: D+20.1 2016: D+13.3 2012: D+11.1 2008: D+12.0
Not yet ingested
- Civics
- —
Market trends
- HPI YoY
- ▼ -88.22%
- Current HPI
- 176.337
- Rent YoY
- ▲ 4.87%
- Metro
- Louisville/Jefferson County, KY-IN
- State GDP YoY
- ▲ 1.81%
- F500 in state
- 4
Industry mix (Fortune 500 HQ in KY)
| Industry | F500 HQs | Revenue |
|---|---|---|
| Healthcare | 1 | $118B |
|
||
| Food / Beverage | 1 | $7B |
|
||
Price history
+258.4% since first listed19 events — show timeline
- 2026-04-22 Price Changed $99,999 Metro Search MLS
- 2026-03-29 Price Changed $105,000 Metro Search MLS
- 2026-02-28 Price Changed $115,000 Metro Search MLS
- 2026-01-30 Listed $125,000 Metro Search MLS
- 2023-04-24 Sold (Public Records) $80,000 Public Records
- 2023-04-20 Sold (MLS) $80,000 Metro Search MLS
- 2023-03-16 Pending — Metro Search MLS
- 2023-03-01 Price Changed $89,795 Metro Search MLS
- 2023-03-01 Relisted — Metro Search MLS
- 2023-02-21 Pending — Metro Search MLS
- 2022-10-21 Listed $93,683 Metro Search MLS
- 2011-04-27 Sold (MLS) $7,726 Metro Search MLS
- 2011-02-17 Listed $8,500 Metro Search MLS
- 2010-03-04 Listing Removed — Metro Search MLS
- 2008-12-08 Listed $304,000 Metro Search MLS
- 2007-03-20 Listing Removed — Metro Search MLS
- 2007-01-11 Listed $36,155 Metro Search MLS
- 1999-08-30 Sold (MLS) $27,900 Metro Search MLS
- 1999-07-26 Listed $27,900 Metro Search MLS
Property tax history
+13.6%/yrLatest (2025): $1,008 · -1.9% YoY. Source: county tax records.
Cash-flow waterfall
monthlySold comps — $/sqft
last 12 mo · ≤1 miLoading sold comps…