291 SE 81st St · Ocala, FL
Flood risk 5/10 · Moderate
- FEMA flood zone
- X (unshaded)
- Chance of flooding over 30 yrs
- 0.24%
- Est. flood insurance / yr
- $507 – $1,088
Fire risk 4/10 · Minor
- Est. fire insurance / yr
- $947 – $1,759
Heat risk 8/10 · Major
- Hot days now (above 108°F)
- 7 days/yr
- Hot days in 30 yrs
- 21 days/yr
Wind risk 9/10 · Severe
- Chance of severe wind over 30 yrs
- 99.0%
Air-quality risk 3/10 · Minor
- Unhealthy air days now
- 3 days/yr
- Unhealthy air days in 30 yrs
- 4 days/yr
Risk factors via First Street. Map © Google.
Why this score? — see what drove the B grade
The composite is a weighted blend of 9 inputs, each scored 0–100. Each bar is that input's sub-score; the figure is the points it added to the 100-point composite (weight × sub-score).
- Cash flow +30.0/30.0
- 1% rule +10.0/10.0
- DSCR +10.0/10.0
- ARV discount +7.5/15.0
- Schools +3.6/10.0
- Livability +3.5/5.0
- Rent growth +3.2/5.0
- Condition / age +2.5/5.0
- Appreciation +0.0/10.0
$80,000
🖨 Deal sheet (PDF) 📄 Offer letter ✓ Due diligence
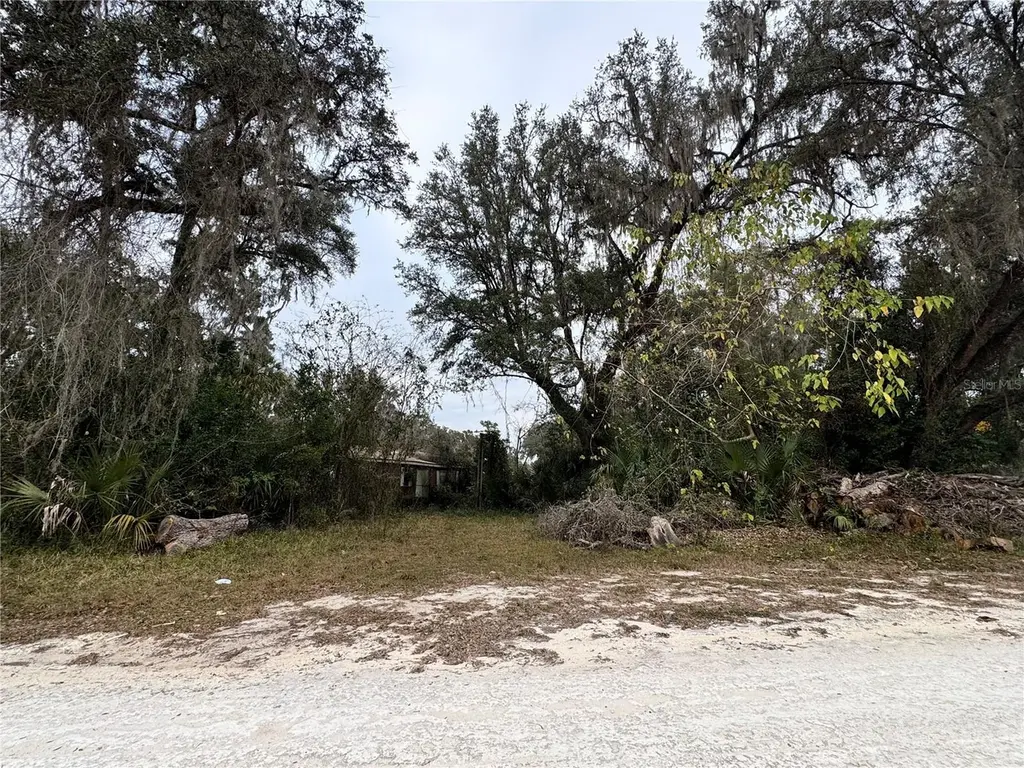
Listing remarks MLS
Check out this . 50 acre lot in South Ocala. With lots of new construction in the area, this one is ripe for the pickens. The existing mobile is not habitable, please do not enter the home for safety reasons. Well, septic and power are installed on the property and were in functional order when the home was last lived in.
Key facts
- Septic installed
- 50 acre lot
- New construction
Tags
Neighborhood map
What this means for you Summary
Snapshot
- This is a 3-bed/2.0-bath manufactured listed at $80k.
Deal economics
- At list price, monthly cash flow is $723 ($9k/yr) — positive.
- The deal already cash-flows at list — no discount required.
- Meets the 1% rule at list price ($2k rent vs $80k).
- Recommended offer: $70k (12.0% below list) — sets the bar for market timing.
- Cap rate 17.1% vs local median 4.2% in Ocala — top-decile yield for the area; either an underpriced asset or a hidden risk that comps aren't pricing in. Stress-test before assuming the spread holds.
Location & tenants
- Location reads 69/100 on livability (#476 in FL) — a middle-class / working-renter tenant base. Strengths: cost of living A+, housing A+, health & safety A+; Watch: crime F, amenities F, commute F.
- Marion (rural): math 42% / reading 43% proficiency, ranked #61 of 73 in FL (top 84%) — families likely to look elsewhere, expect single-tenant / working-renter base with shorter leases; 61% free/reduced lunch — lower-income household profile, screen leases tightly.
- Zoned schools: Shady Hill Elementary School (math 69% / reading 53%, grade B, #653 of 2,144 statewide, top 31%, 643 students, 56% FRL); Belleview Middle School (math 49% / reading 50%, grade C, #259 of 571 statewide, top 46%, 1,573 students, 60% FRL); Belleview High School (math 31% / reading 46%, grade F, #321 of 667 statewide, top 49%, 1,783 students, 56% FRL) — zoned schools at 57% FRL track the district average.
- Market conditions: Rents rising (+2.8%/yr); 350 active listings in the ZIP; solid renter incomes; 7,071 units permitted in Marion County in 2024 (534 in 5+ unit buildings).
Forward outlook
- Local home prices are declining (-3.0%/yr); year-one equity from $553 of loan paydown is wiped out by about $2k of value loss. Plan a longer hold.
- Marion County population projected at +13% by 2050 — modest demand growth; plan on rents tracking national, not racing it.
- At projected returns (-3.0% appreciation + 2.8% rent growth), your $22k cash investment doubles in ~4 years — after that, you're playing with house money.
Negotiation context
- It's been on market 146 days — a 12% lower offer ($70k) is reasonable based on typical stale-listing flexibility.
- 3 sale attempts; this cycle's ask has dropped $10k (11%) from the opening price — seller is motivated, your offer sets the floor, not the list.
Risks & watch-outs
- Climate carrying-cost: moderate flood risk; severe wind risk, 99% chance of damaging wind over 30y; extreme-heat days projected 7→21/yr by 2055 (HVAC capex compounding) — expect insurance premiums to compound above CPI over the hold.
Questions for the listing agent
- It's been on market 146 days. Have you received any prior offers? Is the seller open to a 12% concession, seller financing, or rate buy-down credit?
- Why hasn't it sold? Are there any deal-killer items the seller is aware of (foundation, flood, title, zoning, code violations)?
- Is there a deadline driving the sale (1031 exchange, divorce, estate, relocation)? That informs how much negotiation room exists.
- Crime grade is F in this area — have there been break-ins, vandalism, or insurance claims at this property in the last 3 years? What carrier currently insures it and at what premium?
- What's the average days-on-market for RENTAL listings here right now (not sales)? A rising rental-DOM trend means longer vacancies and softer asking-rent achievability than the comps imply.
- What's the recent tenant-quality profile in this submarket — average credit score on applications, eviction rate, late-payment / NSF rate, and stable-employment percentage? A property-management company in the area should have these aggregated.
- How much new for-sale + rental construction is in the pipeline within 1–3 miles? Heavy new supply typically softens prices + rents 12–24 months out; constrained supply supports both.
Investment metrics
- 1% rule
- 2.08% ✓
- Cap rate
- 17.13%
- Cash-on-cash
- 38.71%
- DSCR
- 2.72
- GRM
- 4.0
CMA / ARV
No comps found within radius.
Projected returns pro-forma
-3.0% appreciation · 2.84% rent growth · sell at horizon
- IRR
- 34.7%
- Equity multiple
- 2.47×
- Total profit
- $32,840
- Equity at exit
- $11,928
- IRR
- 41.5%
- Equity multiple
- 4.88×
- Total profit
- $86,961
- Equity at exit
- $6,917
Cash invested: $22,400 (down + closing). Projections, not guarantees.
Landlord ↔ Tenant lean methodology
- Overall (STATE)
- 87 Strongly Landlord-Friendly
- State Florida
- 87 Strongly Landlord-Friendly · R+3
- County
- — inherits STATE
- City
- — inherits STATE
ZIP-level market 34480
- Home prices YoY
- -28.7%
- Rents YoY
- 2.8%
- Active inventory
- 350
- Price-to-rent
- 4.0×
Monthly cashflow live
- Estimated rent
- $1,662 medium interval (Pro) →
- Mortgage (P&I)
- −$420
- Tax from tax record
- −$138 /mo · $1,652/yr
- Insurance
- −$33
- HOA
- −$0
- Vacancy / Maint / Mgmt
- −$349
- Net cashflow
- $723
Break-even live
Sensitivity live
| Price | -10% $768 | -5% $745 | +0% $723 | +5% $700 | +10% $677 |
|---|---|---|---|---|---|
| Rent | -10% $591 | -5% $657 | +0% $723 | +5% $788 | +10% $854 |
| Rate | -1.0pp $763 | -0.5pp $743 | base $723 | +0.5pp $702 | +1.0pp $681 |
UW: 25.0% down · 7.5% · 30yr · 1.5% tax · 5.0% vac · 8.0% maint · 8.0% mgmt
Financing live
Cash to close
- Down payment
- $20,000
- Closing costs
- $2,400
- Reserves months
- —
- Total cash needed
- —
Loan-product check · same deal, 3 products live
Conventional
25% down · 7.5% · 30yr
- Down + closing
- —
- Monthly P&I
- —
- Monthly cashflow
- —
- DSCR
- —
- Eligible?
- —
Personal DTI + credit; lowest rate.
DSCR
20% down · 8.5% · 30yr
- Down + closing
- —
- Monthly P&I
- —
- Monthly cashflow
- —
- DSCR
- —
- Eligible?
- —
No personal income docs; deal must DSCR.
Hard money
10% down · 12.0% · 12mo
- Down + closing
- —
- Monthly P&I
- —
- Monthly cashflow
- —
- DSCR
- —
- Eligible?
- —
Short-term bridge; refi at stabilization.
Listing history 21 events
-
2026-06-22days on market $80,000 Active 146 DOM
-
2026-06-18days on market $80,000 Active 143 DOM
-
2026-06-17days on market $80,000 Active 142 DOM
-
2026-06-16days on market $80,000 Active 141 DOM
-
2026-06-15days on market $80,000 Active 140 DOM
-
2026-06-14days on market $80,000 Active 138 DOM
-
2026-06-13days on market $80,000 Active 137 DOM
-
2026-06-10days on market $80,000 Active 135 DOM
-
2026-06-09days on market $80,000 Active 134 DOM
-
2026-06-08days on market $80,000 Active 133 DOM
-
2026-06-07days on market $80,000 Active 132 DOM
-
2026-06-03days on market $80,000 Active 128 DOM
-
2026-06-02days on market $80,000 Active 127 DOM
-
2026-05-31days on market $80,000 Active 125 DOM
-
2026-05-30pricedays on market $80,000 Active 124 DOM
-
2026-02-25price $87,400 323-char remark
Show marketing remark (323 chars)
Check out this . 50 acre lot in South Ocala. With lots of new construction in the area, this one is ripe for the pickens. The existing mobile is not habitable, please do not enter the home for safety reasons. Well, septic and power are installed on the property and were in functional order when the home was last lived in.
-
2026-01-31status Active 323-char remark
Show marketing remark (323 chars)
Check out this . 50 acre lot in South Ocala. With lots of new construction in the area, this one is ripe for the pickens. The existing mobile is not habitable, please do not enter the home for safety reasons. Well, septic and power are installed on the property and were in functional order when the home was last lived in.
-
2026-01-17status Pending 323-char remark
Show marketing remark (323 chars)
Check out this . 50 acre lot in South Ocala. With lots of new construction in the area, this one is ripe for the pickens. The existing mobile is not habitable, please do not enter the home for safety reasons. Well, septic and power are installed on the property and were in functional order when the home was last lived in.
-
2026-01-12$89,900 Active 323-char remark
Show marketing remark (323 chars)
Check out this . 50 acre lot in South Ocala. With lots of new construction in the area, this one is ripe for the pickens. The existing mobile is not habitable, please do not enter the home for safety reasons. Well, septic and power are installed on the property and were in functional order when the home was last lived in.
-
2025-12-31historical
-
2025-03-25$109,000 Active
ⓘ Source: listings_history table (triggers on properties + properties_extension) + one-shot
backfill from property_details.listing_events for pre-trigger history.
Tax reassessment forecast FL · Resets to sale price
- Current annual tax
- $1,652 · $138/mo
- Projected year-2 tax
- $1,652 · $138/mo
- Expected delta
- $0/yr ($0/mo · 0.0%)
ⓘ Screening estimate from a state-policy table — verify with the county assessor before closing.
Climate risk First Street
- Flood 5/10 Major FEMA zone X (unshaded) · 24% chance over 30 yrs
- Wildfire 4/10 Moderate
- Heat 8/10 Severe 7 d/yr ≥108°F today · 21 d/yr by 30 yrs out
- Wind 9/10 Extreme 99% chance of damaging wind over 30 yrs
- Air quality 3/10 Moderate 3 unhealthy d/yr today · 4 by 30 yrs out
Nearby sold comps map
Loading sold comps map…
Walkable amenities ~0.75 mi
Loading nearby amenities…
Taxation est. · year 1
- Rental income
- $19,947
- − Mortgage interest
- −$4,481
- − Property taxes
- −$1,652
- − Insurance
- −$400
- − Repairs & maintenance
- −$1,596
- − Management
- −$1,596
- − Depreciation
- −$2,327
- Taxable income
- $7,894
- Est. tax owed @ 24.0%
- −$1,895
- After-tax cash flow
- $6,776/yr
For passive investors: Depreciation is non-cash, so a rental often shows a tax loss while cash-flowing — sheltering income. Rental losses are passive: they offset passive income freely, and up to $25,000/yr can offset ordinary (W-2) income if you actively participate and your MAGI is under $100k (phasing out to $0 by $150k); unused losses carry forward. On sale, claimed depreciation is recaptured at up to 25%, and gains may owe capital-gains tax (a 1031 exchange can defer both). Figures are a year-1 estimate at your 24.0% rate — not tax advice; consult a CPA.
Schools (NCES district)
- District
- Marion
- NCES district ID
- 1201260
- Math proficiency
- 42% ▼ -7.00%
- Reading proficiency
- 43% ▼ -4.00%
- Median HH income
- $40,015
- Composite
- 35.61/100
- National rank
- #4890
- State rank
- #61 of 73 in FL
Livability — Ocala
- Score
- 69/100
- State rank
- #476
- US rank
- #8461
Category grades
Schools grade is shown separately in the Schools card above.
Census & demographics
- County
- Marion County · 315,796 people
- City population
- 263,375
- Metro
- Ocala, FL
- Population (ZIP)
- 23,517
- Household income
- $77,557
- Rent vs Own
- Severe rent burden
- 169.0
Population outlook (Marion County) Hauer SSP2
- Today (2025)
- 365,905 people
- By 2030
- 376,768 · +3.0%
- By 2040
- 396,555 · +8.4%
- By 2050
- 412,723 · +12.8%
- By 2075
- 446,090 · +21.9%
- By 2100
- 436,193 · +19.2%
Race, ethnicity, and origin ACS 2023
- Neighborhood character
- Predominantly White (73%)
- Race & ethnicity
- White 73% Hispanic / Latino 15% Two or more races 11% Black 6% Asian 2%
- Hispanic origin (detail)
- Mexican 3% Puerto Rican 5% Cuban 2% Dominican 2%
- Common ancestry
- Italian 3% Slovak 3% Lithuanian 2%
- Foreign-born
- 6% · Canada
- Languages at home
- 89% English-only · Spanish 9% Other Asian/Pacific 1%
Political lean MEDSL · Marion
- 2024 margin
- Solid R (+31.6) · D 33.8% · R 65.5%
- 2008→2024 swing
- -20.0pp toward R · 2008: -11.6pp · 2024: -31.6pp
- All cycles
- 2024: R+31.6 2020: R+25.9 2016: R+26.2 2012: R+16.2 2008: R+11.6
Not yet ingested
- Civics
- —
Market trends
- HPI YoY
- ▼ -85.60%
- Current HPI
- 212.4262
- Rent YoY
- ▲ 2.84%
- Metro
- Ocala, FL
- State GDP YoY
- ▲ 3.28%
- F500 in state
- 36
Industry mix (Fortune 500 HQ in FL)
| Industry | F500 HQs | Revenue |
|---|---|---|
| Industrial Technology | 2 | $29B |
|
||
| Insurance | 2 | $17B |
|
||
| Retail | 1 | $60B |
|
||
| Technology Distribution | 1 | $58B |
|
||
| Homebuilding | 1 | $35B |
|
||
| Technology Manufacturing | 1 | $35B |
|
||
Price history
-19.8% since first listed6 events — show timeline
- 2026-02-25 Price Changed $87,400 Stellar MLS as Distributed by MLS Grid
- 2026-01-31 Relisted — Stellar MLS as Distributed by MLS Grid
- 2026-01-17 Pending — Stellar MLS as Distributed by MLS Grid
- 2026-01-12 Listed $89,900 Stellar MLS as Distributed by MLS Grid
- 2025-12-31 Listing Removed — Stellar MLS as Distributed by MLS Grid
- 2025-03-25 Listed $109,000 Stellar MLS as Distributed by MLS Grid
Property tax history
+8.6%/yrLatest (2025): $1,652 · +23.6% YoY. Source: county tax records.
Cash-flow waterfall
monthlySold comps — $/sqft
last 12 mo · ≤1 miLoading sold comps…