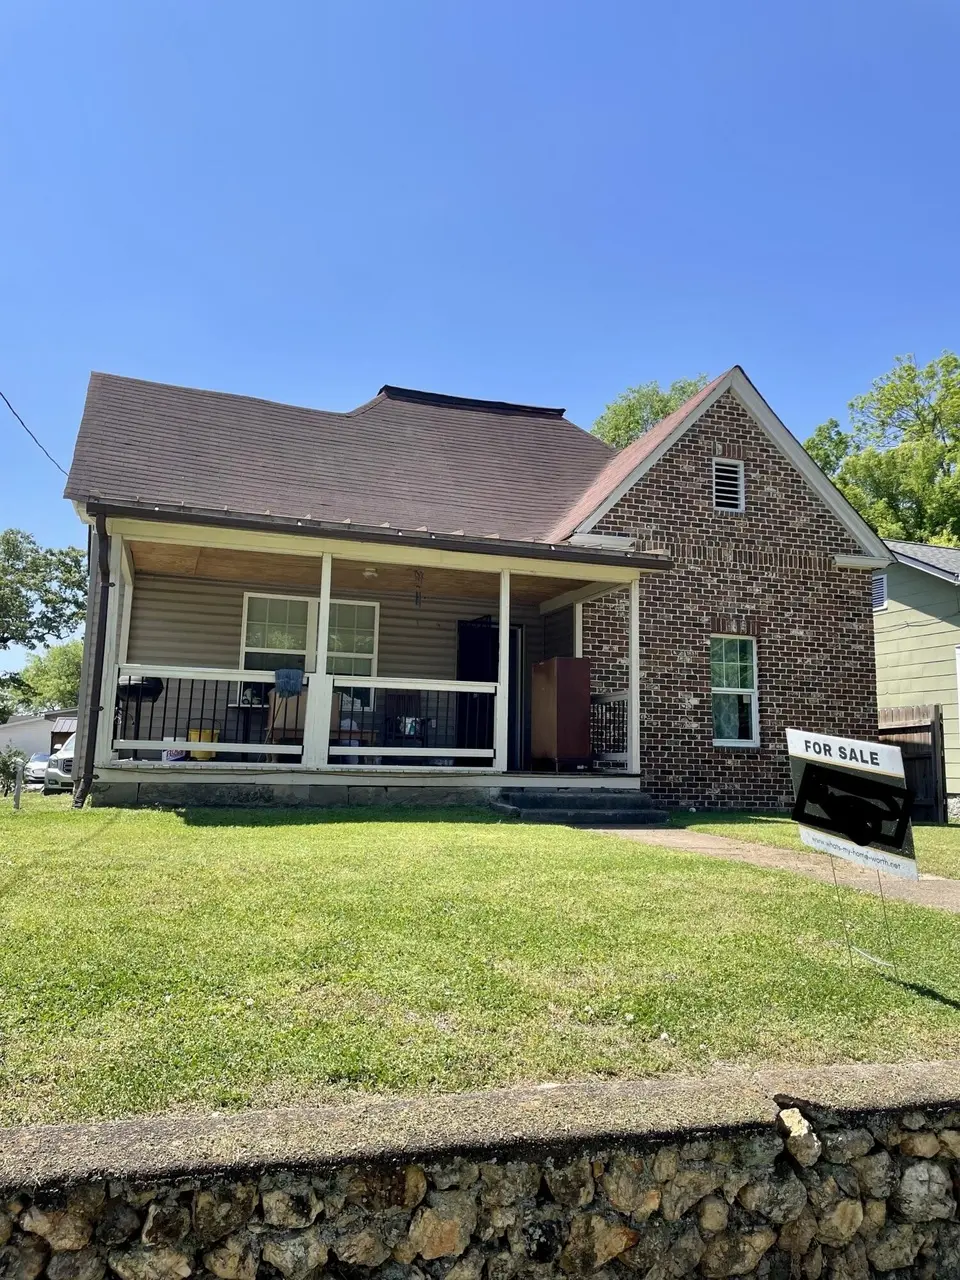
1510 E 16th St · Chattanooga, TN
Flood risk 8/10 · Major
- FEMA flood zone
- X (unshaded)
- Chance of flooding over 30 yrs
- 0.93%
- Est. flood insurance / yr
- $507 – $1,088
Fire risk 1/10 · Minimal
- Est. fire insurance / yr
- $949 – $1,763
Heat risk 6/10 · Moderate
- Hot days now (above 104°F)
- 7 days/yr
- Hot days in 30 yrs
- 19 days/yr
Wind risk 4/10 · Minor
- Chance of severe wind over 30 yrs
- 11.0%
Air-quality risk 3/10 · Minor
- Unhealthy air days now
- 2 days/yr
- Unhealthy air days in 30 yrs
- 2 days/yr
Risk factors via First Street. Map © Google.
Why this score? — see what drove the B- grade
The composite is a weighted blend of 9 inputs, each scored 0–100. Each bar is that input's sub-score; the figure is the points it added to the 100-point composite (weight × sub-score).
- Cash flow +24.3/30.0
- ARV discount +15.0/15.0
- DSCR +7.9/10.0
- 1% rule +6.3/10.0
- Livability +3.9/5.0
- Schools +2.7/10.0
- Rent growth +2.5/5.0
- Condition / age +2.5/5.0
- Appreciation +0.0/10.0
$180,000
🖨 Deal sheet 📄 Offer letter ✓ Due diligence
Listing remarks MLS
Investor or renovation opportunity at 1510 E 16th Street! This property is being sold AS-IS and is priced to reflect the work needed. The main home offers 3 bedrooms and 1 bathroom * * , plus a separate detached building currently rented as an efficiency apartment, which does not have a bathroom once reapaired can be good cash flow. Appliances and shed do not convey. Conveniently located just minutes from Chattanooga's vibrant downtown, dining, entertainment, and attractions. With vision and updates, this property could be a great addition to an investment portfolio or a value-add primary residence. Needs a 2-hour notice, best to show after 1 pm.
Key facts
- Efficiency apartment
- 6,969 sq ft lot
- Built 1910
Tags
Property features AI
Exterior
- Parking: Detached parking (gravel)
- Utilities: Public water; Public sewer; Water available
- Home design: Single-family residence; Three or more levels; Residential property
- Construction: Vinyl siding; Block foundation; Existing (previously built)
- Exterior features: Lot approximately 0.16 acres (49 x 145); Gravel and on-street parking areas
Interior
- Bedrooms: 3 bedrooms
- Bathrooms: 1 full bathroom
- Heating & cooling: Central air conditioning
- Interior features: Central air conditioning
Neighborhood map
What this means for you Summary
Snapshot
- This is a 3-bed/1.0-bath single-family listed at $180k.
Deal economics
- At list price, monthly cash flow is $297 ($4k/yr) — positive.
- The deal already cash-flows at list — no discount required.
- Meets the 1% rule at list price ($2k rent vs $180k).
- Recommended offer: $175k (3.0% below list) — sets the bar for market timing.
- Cap rate 8.7% vs local median 3.4% in Chattanooga — top-decile yield for the area; either an underpriced asset or a hidden risk that comps aren't pricing in. Stress-test before assuming the spread holds.
Location & tenants
- Location reads 78/100 on livability (#3 in TN, #2,582 nationally) — a middle-class / working-renter tenant base. Strengths: amenities A+, commute A+, cost of living A+; Watch: employment D+, crime F.
- Hamilton County (urban): math 31% / reading 31% proficiency, ranked #42 of 139 in TN (top 30%) — families likely to look elsewhere, expect single-tenant / working-renter base with shorter leases.
- Zoned schools: East Side Elementary (math 27% / reading 18%, grade F, #596 of 952 statewide, top 63%, 551 students, 0% FRL) — zoned schools average 0% FRL vs 52% district-wide (52 pts lower); this property's tenant base skews higher-income than the district average.
- Market conditions: Rents flat; 167 active listings in the ZIP; 40 comparable units currently listed for rent nearby; rentals at typical pace (median 24d on market — plan ~3-4 weeks tenant-placement turnaround); 2,133 units permitted in Hamilton County in 2024 (405 in 5+ unit buildings).
- This rent runs 43% of the median local income ($57k/yr) — at the standard rent-burdened threshold; future hikes will face affordability resistance.
Forward outlook
- Local home prices are declining (-3.0%/yr); year-one equity from $1k of loan paydown is wiped out by about $5k of value loss. Plan a longer hold.
- Hamilton County population projected at +23% by 2050 — long-run rental-demand tailwind backs the buy-and-hold thesis.
Negotiation context
- It's been on market 38 days — a 3% lower offer ($175k) is reasonable based on typical stale-listing flexibility.
- 3 sale attempts with the ask held roughly flat each time — persistent listings suggest the price (not the market) is what's stuck; bring a comps-based counter.
Risks & watch-outs
- Watch-outs: flood insurance adds $66/mo; built in 1910 — expect roof / HVAC / electrical / plumbing capex.
- Climate carrying-cost: severe flood risk; extreme-heat days projected 7→19/yr by 2055 (HVAC capex compounding) — expect insurance premiums to compound above CPI over the hold.
Questions for the listing agent
- It's been on market 38 days. Have you received any prior offers? Is the seller open to a 3% concession, seller financing, or rate buy-down credit?
- Built in 1910 — when were the roof, HVAC, electrical panel, plumbing, and water heater last replaced?
- What's the actual annual flood-insurance premium (NFIP or private), and is the property in a SFHA with mandatory coverage?
- Is there a deadline driving the sale (1031 exchange, divorce, estate, relocation)? That informs how much negotiation room exists.
- Schools are F-rated, which usually means shorter tenancies and higher turnover. Who's the typical renter profile here, and what's been the actual vacancy rate?
- Crime grade is F in this area — have there been break-ins, vandalism, or insurance claims at this property in the last 3 years? What carrier currently insures it and at what premium?
- What's the average days-on-market for RENTAL listings here right now (not sales)? A rising rental-DOM trend means longer vacancies and softer asking-rent achievability than the comps imply.
- What's the recent tenant-quality profile in this submarket — average credit score on applications, eviction rate, late-payment / NSF rate, and stable-employment percentage? A property-management company in the area should have these aggregated.
- How much new for-sale + rental construction is in the pipeline within 1–3 miles? Heavy new supply typically softens prices + rents 12–24 months out; constrained supply supports both.
Investment metrics
- 1% rule
- 1.13% ✓
- Cap rate
- 8.72%
- Cash-on-cash
- 8.66%
- DSCR
- 1.39
- GRM
- 7.4
CMA / ARV
- ARV (on-the-fly)
- $271,138
- Comps found
- 8
Show comp detail 8 sales within ~0.75 mi
| Address | Dist | Beds/Ba | Sqft | Sold | Price | $/sf | Match |
|---|---|---|---|---|---|---|---|
| 1510 E 13th St | 0.20mi | 3/2.0 | 1,290 (+2%) | 12mo | $339,000 | $263 | 74 |
| 1713 S Orchard Knob Ave | 0.33mi | 3/1.0 | 1,182 (-7%) | 2mo | $65,000 | $55 | 71 |
| 1706 E 14th St | 0.24mi | 3/2.0 | 1,320 (+4%) | 12mo | $250,000 | $189 | 68 |
| 1612 Vance Ave | 0.47mi | 3/1.0 | 1,350 (+7%) | 14mo | $189,000 | $140 | 55 |
| 1805 S Willow St | 0.51mi | 3/2.0 | 1,385 (+9%) | 7mo | $296,900 | $214 | 51 |
| 1000 S Beech St | 0.56mi | 2/2.0 (-1) | 1,187 (-6%) | 5mo | $275,000 | $232 | 50 |
| 1005 S Hickory St | 0.40mi | 3/2.0 | 1,084 (-14%) | 15mo | $220,000 | $203 | 41 |
| 1204 S Lyerly St | 0.74mi | 3/2.0 | 1,441 (+14%) | 18mo | $350,000 | $243 | 24 |
Match score weights: distance 35% · size 25% · config 20% · recency 20%. Top-matched comps best support the ARV.
Projected returns pro-forma
-3.0% appreciation · 0.03% rent growth · sell at horizon
- IRR
- -9.0%
- Equity multiple
- 0.68×
- Total profit
- $-16,068
- Equity at exit
- $26,839
- IRR
- -4.2%
- Equity multiple
- 0.76×
- Total profit
- $-12,157
- Equity at exit
- $15,563
Cash invested: $50,400 (down + closing). Projections, not guarantees.
Landlord ↔ Tenant lean methodology
- Overall (STATE)
- 87 Strongly Landlord-Friendly
- State Tennessee
- 87 Strongly Landlord-Friendly · R+13
- County
- — inherits STATE
- City
- — inherits STATE
ZIP-level market 37404
- Home prices YoY
- -30.6%
- Rents YoY
- 0.0%
- Active inventory
- 167
- Price-to-rent
- 7.4×
Monthly cashflow live
- Estimated rent
- $2,035 high interval (Pro) →
- Mortgage (P&I)
- −$944
- Tax est. 1.5%
- −$225 /mo · $2,700/yr
- Insurance
- −$75
- Flood insurance flood zone
- −$66 /mo · $798/yr
- HOA
- −$0
- Vacancy / Maint / Mgmt
- −$427
- Net cashflow
- $297
Break-even live
UW: 25.0% down · 7.5% · 30yr · 1.5% tax · 5.0% vac · 8.0% maint · 8.0% mgmt
Financing live
Cash to close
- Down payment
- $45,000
- Closing costs
- $5,400
- Reserves months
- —
- Total cash needed
- —
Loan-product check · same deal, 3 products live
Conventional
25% down · 7.5% · 30yr
- Down + closing
- —
- Monthly P&I
- —
- Monthly cashflow
- —
- DSCR
- —
- Eligible?
- —
Personal DTI + credit; lowest rate.
DSCR
20% down · 8.5% · 30yr
- Down + closing
- —
- Monthly P&I
- —
- Monthly cashflow
- —
- DSCR
- —
- Eligible?
- —
No personal income docs; deal must DSCR.
Hard money
10% down · 12.0% · 12mo
- Down + closing
- —
- Monthly P&I
- —
- Monthly cashflow
- —
- DSCR
- —
- Eligible?
- —
Short-term bridge; refi at stabilization.
Rent comps 40 comps
| Address | Beds | Baths | Sqft | Rent | $/sqft | DOM | Units | Dist |
|---|---|---|---|---|---|---|---|---|
| 1652 Mari Cir Chattanooga, TN | 3.0 | 3.0 | 1700 | $2,500 | $1.47 | 23d | 1 | 0.07mi |
| 1816 S Holly St Chattanooga, TN | 4.0 | 2.0 | 1415 | $1,700 | $1.20 | 13d | 1 | 0.21mi |
| 1800 S Holtzclaw Ave Chattanooga, TN | 3.0 | 3.0 | 1500 | $2,500 | $1.67 | 23d | 1 | 0.22mi |
| 1603 Fagan St #202 Chattanooga, TN | 2.0 | 2.0 | 1048 | $1,875 | $1.79 | 23d | 1 | 0.60mi |
| 1603 Fagan St Chattanooga, TN | 2.0 | 2.0 | 1048 | $1,895 | $1.81 | 23d | 1 | 0.60mi |
| 1609 Fagan St #105 Chattanooga, TN | 2.0 | 1.5 | 1200 | $1,750 | $1.46 | 23d | 1 | 0.61mi |
| 1615 Fagan St Chattanooga, TN | 2.0 | 2.5 | 1173 | $2,600 | $2.22 | 13d | 1 | 0.63mi |
| 901 E Main St Chattanooga, TN | 2.0 | 1.0 | 710 | $1,290 | $1.82 | 13d | 1 | 0.65mi |
| 900 E Main St Chattanooga, TN | 1.0–2.0 | 1.0–2.0 | 752 | $1,845 | $2.45 | 21d | 16 | 0.66mi |
| 1705 Bailey Ave Chattanooga, TN | 3.0 | 2.0 | 1632 | $1,850 | $1.13 | 23d | 1 | 0.68mi |
| 2239 E 19th St Chattanooga, TN | 4.0 | 2.0 | 1250 | $2,090 | $1.67 | 23d | 1 | 0.72mi |
| 2001 S Lyerly St Chattanooga, TN | 2.0–3.0 | 2.0 | 1080 | $1,385 | $1.28 | 13d | 6 | 0.74mi |
| 2322 E 18th Street Pl Chattanooga, TN | 2.0 | 2.5 | 1340 | $1,595 | $1.19 | 21d | 1 | 0.76mi |
| 2341 E 18th St Chattanooga, TN | 2.0 | 2.5 | 1316 | $1,725 | $1.31 | 23d | 1 | 0.77mi |
| 2328 E 18th St Chattanooga, TN | 3.0 | 2.5 | 1616 | $2,095 | $1.30 | 23d | 1 | 0.77mi |
| 2347 E 18th St Chattanooga, TN | 2.0 | 2.5 | 1340 | $1,695 | $1.26 | 23d | 1 | 0.77mi |
| 2303 E 19th St Chattanooga, TN | 3.0 | 2.5 | 1544 | $1,995 | $1.29 | 21d | 1 | 0.78mi |
| 2360 E 18th St Chattanooga, TN | 3.0 | 2.5 | 1544 | $2,095 | $1.36 | 23d | 1 | 0.78mi |
| 2318 E Main St Chattanooga, TN | 2.0 | 2.0 | 1000 | $1,515 | $1.51 | 13d | 1 | 0.78mi |
| 2335 E 19th St Chattanooga, TN | 3.0 | 2.5 | 1616 | $1,995 | $1.23 | 23d | 1 | 0.79mi |
| 2100 Rossville Ave Chattanooga, TN | 1.0–2.0 | 1.0–2.0 | 1140 | $2,199 | $1.93 | 13d | 13 | 0.80mi |
| 1809 Cotton Way Chattanooga, TN | 2.0 | 2.5 | 1412 | $2,295 | $1.63 | 23d | 1 | 0.84mi |
| 630 E 17th St Chattanooga, TN | 3.0 | 2.5 | 1604 | $2,400 | $1.50 | 23d | 1 | 0.89mi |
| 2106 Duncan Ave Unit 102 Chattanooga, TN | 3.0 | 2.5 | 1600 | $2,295 | $1.43 | 23d | 1 | 0.92mi |
| 2009 McCallie Ave Chattanooga, TN | 2.0 | 2.0 | 1000 | $1,430 | $1.43 | 13d | 1 | 0.96mi |
| 1818 Dodds Ave Chattanooga, TN | 2.0 | 1.0 | 1036 | $1,099 | $1.06 | 13d | 1 | 1.01mi |
| 2612 E 19th St Chattanooga, TN | 2.0 | 1.0 | 900 | $1,150 | $1.28 | 23d | 1 | 1.04mi |
| 226 N Hickory St Chattanooga, TN | 3.0 | 2.0 | 1350 | $1,895 | $1.40 | 21d | 1 | 1.05mi |
| 2111 Oak St Chattanooga, TN | 2.0 | 2.0 | 1100 | $1,595 | $1.45 | 13d | 1 | 1.06mi |
| 756 Bespoke Way Chattanooga, TN | 3.0 | 3.0 | 1510 | $4,000 | $2.65 | 13d | 1 | 1.07mi |
| 1905 Ivy St Chattanooga, TN | 4.0 | 3.0 | 1860 | $2,495 | $1.34 | 23d | 1 | 1.09mi |
| 2425 Chamberlain Ave Chattanooga, TN | 3.0 | 2.0 | 1422 | $1,795 | $1.26 | 23d | 1 | 1.10mi |
| 659 Bespoke WAY Chattanooga, TN | 3.0 | 3.0 | 1564 | $2,750 | $1.76 | 23d | 1 | 1.11mi |
| 912 Oak St Apt 1 Chattanooga, TN | 2.0 | 2.0 | 1000 | $1,400 | $1.40 | 23d | 1 | 1.16mi |
| 1362 Passenger St Unit 5008 Chattanooga, TN | 2.0 | 2.0 | 1255 | $2,475 | $1.97 | 13d | 1 | 1.16mi |
| 1362 Passenger St Unit 3008 Chattanooga, TN | 2.0 | 2.0 | 1255 | $2,119 | $1.69 | 13d | 1 | 1.16mi |
| 1348 Passenger St Chattanooga, TN | 1.0–3.0 | 1.0–2.0 | 1073 | $2,604 | $2.43 | 13d | 18 | 1.19mi |
| 1711 Read Ave Unit A Chattanooga, TN | 3.0 | 1.5 | 1010 | $1,700 | $1.68 | 21d | 1 | 1.23mi |
| 513 Central Ave Chattanooga, TN | 3.0 | 2.0 | 1000 | $1,800 | $1.80 | 23d | 1 | 1.24mi |
| 2417 13th Ave Chattanooga, TN | 2.0 | 1.0 | 950 | $1,150 | $1.21 | 23d | 1 | 1.25mi |
Listing history 19 events
-
2026-06-18days on market $180,000 Active 38 DOM
-
2026-06-17days on market $180,000 Active 37 DOM
-
2026-06-16days on market $180,000 Active 36 DOM
-
2026-06-15days on market $180,000 Active 35 DOM
-
2026-06-14days on market $180,000 Active 33 DOM
-
2026-06-10days on market $180,000 Active 30 DOM
-
2026-06-09days on market $180,000 Active 29 DOM
-
2026-06-08days on market $180,000 Active 28 DOM
-
2026-06-07days on market $180,000 Active 27 DOM
-
2026-06-05days on market $180,000 Active 24 DOM
-
2026-06-03days on market $180,000 Active 23 DOM
-
2026-06-02days on market $180,000 Active 22 DOM
-
2026-06-01days on market $180,000 Active 21 DOM
-
2026-05-31days on market $180,000 Active 20 DOM
-
2026-05-30days on market $180,000 Active 19 DOM
-
2026-05-11$180,000 Active
-
2026-05-07$180,000 Active 655-char remark
Show marketing remark (655 chars)
Investor or renovation opportunity at 1510 E 16th Street! This property is being sold AS-IS and is priced to reflect the work needed. The main home offers 3 bedrooms and 1 bathroom * * , plus a separate detached building currently rented as an efficiency apartment, which does not have a bathroom once reapaired can be good cash flow. Appliances and shed do not convey. Conveniently located just minutes from Chattanooga's vibrant downtown, dining, entertainment, and attractions. With vision and updates, this property could be a great addition to an investment portfolio or a value-add primary residence. Needs a 2-hour notice, best to show after 1 pm.
-
2026-04-20$180,000 Active 672-char remark
Show marketing remark (672 chars)
Investor or renovation opportunity at 1510 E 16th Street! This property is being sold AS-IS and is priced to reflect the work needed. The main home offers 3 bedrooms and 1 bathroom**, plus a separate detached building currently rented as an efficiency apartment it does not have a bathroom. providing excellent income potential or flexible living space. Conveniently located just minutes from Chattanooga’s vibrant downtown, dining, entertainment, and attractions. With vision and updates, this property could be a great addition to an investment portfolio or a value-add primary residence. Needs 2 hour notice best to show after 1 pm. Pictures will be posted soon.
-
2026-04-16historical $180,000 672-char remark
Show marketing remark (672 chars)
Investor or renovation opportunity at 1510 E 16th Street! This property is being sold AS-IS and is priced to reflect the work needed. The main home offers 3 bedrooms and 1 bathroom**, plus a separate detached building currently rented as an efficiency apartment it does not have a bathroom. providing excellent income potential or flexible living space. Conveniently located just minutes from Chattanooga’s vibrant downtown, dining, entertainment, and attractions. With vision and updates, this property could be a great addition to an investment portfolio or a value-add primary residence. Needs 2 hour notice best to show after 1 pm. Pictures will be posted soon.
ⓘ Source: listings_history table (triggers on properties + properties_extension) + one-shot
backfill from property_details.listing_events for pre-trigger history.
Climate risk First Street
- Flood 8/10 Severe FEMA zone X (unshaded) · 93% chance over 30 yrs
- Wildfire 1/10 Low
- Heat 6/10 Major 7 d/yr ≥104°F today · 19 d/yr by 30 yrs out
- Wind 4/10 Moderate 11% chance of damaging wind over 30 yrs
- Air quality 3/10 Moderate 2 unhealthy d/yr today · 2 by 30 yrs out
Nearby sold comps map
Loading sold comps map…
Walkable amenities ~0.75 mi
Loading nearby amenities…
Taxation est. · year 1
- Rental income
- $24,421
- − Mortgage interest
- −$10,083
- − Property taxes
- −$2,700
- − Insurance
- −$1,697
- − Repairs & maintenance
- −$1,954
- − Management
- −$1,954
- − Depreciation
- −$5,236
- Taxable income
- $797
- Est. tax owed @ 24.0%
- −$191
- After-tax cash flow
- $3,376/yr
For passive investors: Depreciation is non-cash, so a rental often shows a tax loss while cash-flowing — sheltering income. Rental losses are passive: they offset passive income freely, and up to $25,000/yr can offset ordinary (W-2) income if you actively participate and your MAGI is under $100k (phasing out to $0 by $150k); unused losses carry forward. On sale, claimed depreciation is recaptured at up to 25%, and gains may owe capital-gains tax (a 1031 exchange can defer both). Figures are a year-1 estimate at your 24.0% rate — not tax advice; consult a CPA.
Schools (NCES district)
- District
- Hamilton County
- NCES district ID
- 4701590
- Math proficiency
- 31% ▼ -10.00%
- Reading proficiency
- 31% ▼ -3.00%
- Median HH income
- $47,456
- Composite
- 26.8/100
- National rank
- #7122
- State rank
- #42 of 139 in TN
Livability — Chattanooga
- Score
- 78/100
- State rank
- #3
- US rank
- #2582
Category grades
Schools grade is shown separately in the Schools card above.
Census & demographics
- Census place
- Chattanooga, TN
- County
- Hamilton County · 312,777 people
- City population
- 131,999
- Metro
- Chattanooga, TN-GA
- Population (ZIP)
- 14,737
- Household income
- $56,637
- Rent vs Own
- Severe rent burden
- 486.0
Population outlook (Hamilton County) Hauer SSP2
- Today (2025)
- 393,784 people
- By 2030
- 412,983 · +4.9%
- By 2040
- 449,502 · +14.1%
- By 2050
- 484,341 · +23.0%
- By 2075
- 565,746 · +43.7%
- By 2100
- 618,394 · +57.0%
Race, ethnicity, and origin ACS 2023
- Neighborhood character
- Diverse neighborhood (Simpson 0.67)
- Race & ethnicity
- Black 38% White 38% Hispanic / Latino 21% Two or more races 11%
- Hispanic origin (detail)
- Mexican 3%
- Common ancestry
- Slovak 3% Romanian 1% Lithuanian 1%
- Foreign-born
- 11% · Canada
- Languages at home
- 81% English-only · Spanish 18%
Political lean MEDSL · Hamilton
- 2024 margin
- R (+13.1) · D 42.7% · R 55.7% · Other 1.6%
- 2008→2024 swing
- -1.2pp toward R · 2008: -11.8pp · 2024: -13.1pp
- All cycles
- 2024: R+13.1 2020: R+9.7 2016: R+16.6 2012: R+14.8 2008: R+11.8
Not yet ingested
- Civics
- —
Market trends
- HPI YoY
- ▼ -139.43%
- Current HPI
- 315.8539
- Rent YoY
- ▬ 0.03%
- Metro
- Chattanooga, TN-GA
- State GDP YoY
- ▲ 2.78%
- F500 in state
- 22
Industry mix (Fortune 500 HQ in TN)
| Industry | F500 HQs | Revenue |
|---|---|---|
| Healthcare | 3 | $91B |
|
||
| Retail | 3 | $72B |
|
||
| Transportation / Logistics | 1 | $88B |
|
||
| Paper / Packaging | 1 | $19B |
|
||
| Insurance | 1 | $13B |
|
||
| Energy | 1 | $12B |
|
||
Price history
+0.0% since first listed4 events — show timeline
- 2026-05-11 Listed $180,000 REALTRACS as Distributed by MLS Grid
- 2026-05-07 Listed $180,000 GCAR
- 2026-04-20 Listed $180,000 REALTRACS as Distributed by MLS Grid
- 2026-04-16 Coming Soon $180,000 REALTRACS as Distributed by MLS Grid
Property tax history
+3.4%/yrLatest (2025): $322 · +80.0% YoY. Source: county tax records.
Cash-flow waterfall
monthlySold comps — $/sqft
last 12 mo · ≤1 miLoading sold comps…