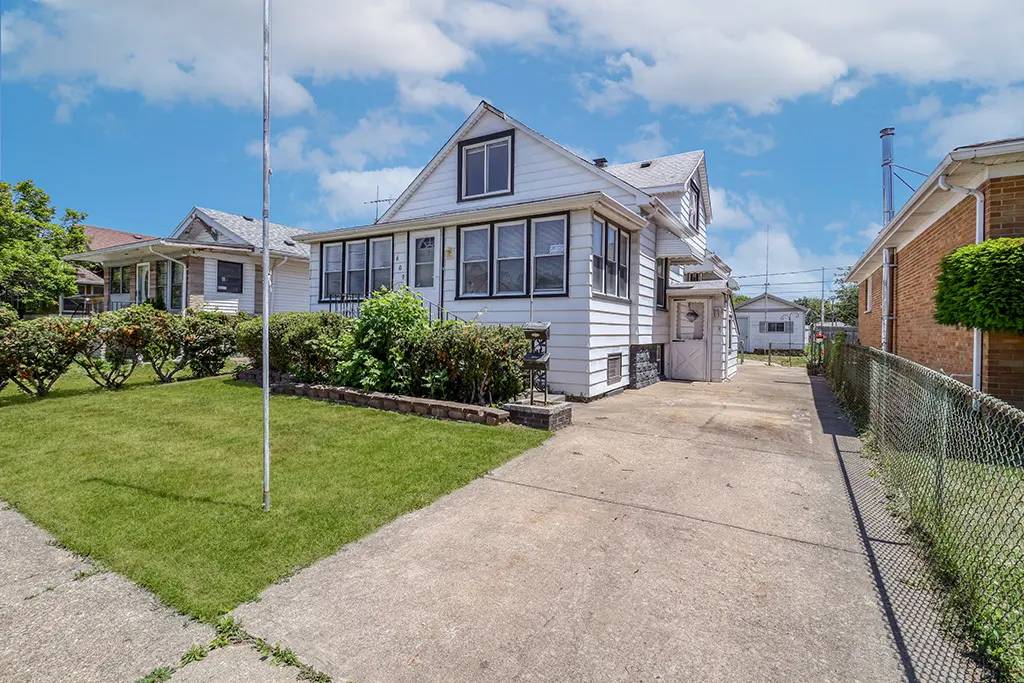
609 Greenbay Ave · Calumet City, IL
Flood risk 1/10 · Minimal
- FEMA flood zone
- X (unshaded)
- Chance of flooding over 30 yrs
- 0.0%
- Est. flood insurance / yr
- $473 – $860
Fire risk 1/10 · Minimal
- Est. fire insurance / yr
- $804 – $1,492
Heat risk 3/10 · Minor
- Hot days now (above 102°F)
- 7 days/yr
- Hot days in 30 yrs
- 15 days/yr
Wind risk 2/10 · Minimal
- Chance of severe wind over 30 yrs
- 0.0%
Air-quality risk 4/10 · Minor
- Unhealthy air days now
- 5 days/yr
- Unhealthy air days in 30 yrs
- 6 days/yr
Risk factors via First Street. Map © Google.
Why this score? — see what drove the D+ grade
The composite is a weighted blend of 9 inputs, each scored 0–100. Each bar is that input's sub-score; the figure is the points it added to the 100-point composite (weight × sub-score).
- Cash flow +23.8/30.0
- DSCR +7.7/10.0
- 1% rule +6.1/10.0
- Rent growth +4.0/5.0
- Livability +3.6/5.0
- Condition / age +2.5/5.0
- Schools +1.0/10.0
- ARV discount +0.0/15.0
- Appreciation +0.0/10.0
$185,000
🖨 Deal sheet 📄 Offer letter ✓ Due diligence
Listing remarks
Spacious 5-bedroom, 2-bath home with approximately 1,600 square feet of finished living space, a full basement, detached garage, and a rare detached utility-serviced accessory building. Fresh paint and new carpeting enhance the home's clean and inviting interior. Featuring a versatile layout with five bedrooms, generous living and dining spaces, and a full basement, this property offers exceptional space and flexibility. The detached accessory building adds additional space and potential not often found at this price point. Conveniently located near schools, shopping, dining, parks, and commuter routes. Property sold AS-IS. Buyer responsible for municipal requirements and inspections.
Key facts
- Garage
- Built 1924
- Listed 12 days
Property features AI
Finance
- Other: Property not rebuilt or recently rehabbed; Parcel number available in records
- HOA & community: No master association fee required
Exterior
- Parking: Detached garage with garage door opener; Concrete driveway/parking; 1 garage space (1 total parking space)
- Utilities: Public water; Public sewer
- Home design: Detached single-family home; 2-story design; Fee simple ownership; Estimated living area
- Construction: Aluminum siding; Home is over 100 years old; Built before 1978
- Exterior features: Lot less than 0.25 acre; Lot dimensions listed as 5000 (per records)
Interior
- Kitchen: Kitchen on main level (14 x 10)
- Bedrooms: 5 bedrooms (master and other main-level and second-level bedrooms listed below); Master bedroom on main level (10 x 13); Bedroom 2 on main level (10 x 13); Bedroom 3 on second level (12 x 12); Bedroom 4 on second level (11 x 11); Bedroom 5 on second level (9 x 10)
- Flooring: Laminate flooring in some rooms including kitchen and Bedroom 5; Carpet in living room, dining room, and several upstairs bedrooms
- Bathrooms: 2 full bathrooms; Basement contains at least one bathroom
- Heating & cooling: Natural gas heating; Window air conditioning units
- Interior features: Partially finished full basement; 8 total rooms
- Laundry & utility: Laundry room included
Neighborhood map
What this means for you Summary
Snapshot
- This is a 4-bed/1.0-bath single-family listed at $185k.
Deal economics
- At list price, monthly cash flow is $356 ($4k/yr) — positive.
- The deal already cash-flows at list — no discount required.
- Meets the 1% rule at list price ($2k rent vs $185k).
Location & tenants
- Location reads 71/100 on livability (#330 in IL) — a middle-class / working-renter tenant base. Strengths: commute A+, cost of living A+, housing A+; Watch: employment C-, crime D-, amenities F.
- Thornton Fractional Twp Hsd 215 (suburban): math 9% / reading 13% proficiency, ranked #563 of 620 in IL (top 91%) — low school quality limits family demand, transient renter base, plan for 1-2y turnover.
- Zoned schools: Thornton Fractnl No High School (math 6% / reading 10%, grade F, #587 of 693 statewide, top 85%, 1,383 students, 0% FRL).
- Market conditions: Rents rising fast (+6.2%/yr); 198 active listings in the ZIP; 2 comparable units currently listed for rent nearby; 6,272 units permitted in Cook County in 2024 (4,658 in 5+ unit buildings).
- This rent runs 44% of the median local income ($55k/yr) — at the standard rent-burdened threshold; future hikes will face affordability resistance.
Forward outlook
- Local home prices are declining (-3.0%/yr); year-one equity from $1k of loan paydown is wiped out by about $6k of value loss. Plan a longer hold.
- At projected returns (-3.0% appreciation + 6.2% rent growth), your $52k cash investment doubles in ~9 years — after that, you're playing with house money.
Negotiation context
- Only 12 days on market — expect competitive offers; lowballing is unlikely to land.
Risks & watch-outs
- Watch-outs: built in 1924 — expect roof / HVAC / electrical / plumbing capex.
Questions for the listing agent
- Built in 1924 — when were the roof, HVAC, electrical panel, plumbing, and water heater last replaced?
- Is there a deadline driving the sale (1031 exchange, divorce, estate, relocation)? That informs how much negotiation room exists.
- Schools are F-rated, which usually means shorter tenancies and higher turnover. Who's the typical renter profile here, and what's been the actual vacancy rate?
- Crime grade is D in this area — have there been break-ins, vandalism, or insurance claims at this property in the last 3 years? What carrier currently insures it and at what premium?
- The area grade is low — what's the realistic commute time and amenity access for the typical tenant pool here? Any planned neighborhood developments (good or bad) we should know about?
- What's the average days-on-market for RENTAL listings here right now (not sales)? A rising rental-DOM trend means longer vacancies and softer asking-rent achievability than the comps imply.
- What's the recent tenant-quality profile in this submarket — average credit score on applications, eviction rate, late-payment / NSF rate, and stable-employment percentage? A property-management company in the area should have these aggregated.
- How much new for-sale + rental construction is in the pipeline within 1–3 miles? Heavy new supply typically softens prices + rents 12–24 months out; constrained supply supports both.
Investment metrics
- 1% rule
- 1.11% ✓
- Cap rate
- 8.60%
- Cash-on-cash
- 8.24%
- DSCR
- 1.37
- GRM
- 7.5
CMA / ARV
- ARV (on-the-fly)
- $141,336
- Comps found
- 12
Show comp detail 12 sales within ~0.75 mi
| Address | Dist | Beds/Ba | Sqft | Sold | Price | $/sf | Match |
|---|---|---|---|---|---|---|---|
| 419 157th St | 0.59mi | 4/2.0 | 957 (+2%) | 3mo | $80,000 | $84 | 62 |
| 302 153rd St | 0.42mi | 3/1.0 (-1) | 1,016 (+8%) | 2mo | $175,000 | $172 | 60 |
| 708 May St | 0.22mi | 3/1.5 (-1) | 1,042 (+11%) | 7mo | $170,000 | $163 | 58 |
| 409 Price Ave | 0.53mi | 3/1.5 (-1) | 957 (+2%) | 8mo | $160,000 | $167 | 58 |
| 441 State St | 0.60mi | 3/1.0 (-1) | 964 (+3%) | 8mo | $99,000 | $103 | 55 |
| 219 154th Pl | 0.55mi | 3/1.0 (-1) | 860 (-8%) | 2mo | $60,000 | $70 | 54 |
| 544 Garfield Ave | 0.53mi | 3/1.0 (-1) | 1,008 (+8%) | 9mo | $130,000 | $129 | 50 |
| 433 154th Pl | 0.32mi | 3/1.5 (-1) | 1,061 (+13%) | 9mo | $159,950 | $151 | 48 |
| 863 Mackinaw Ave | 0.59mi | 3/1.0 (-1) | 823 (-12%) | 1mo | $139,900 | $170 | 46 |
| 1129 Sibley Blvd | 0.48mi | 3/1.0 (-1) | 1,075 (+15%) | 3mo | $106,000 | $99 | 45 |
| 782 Campbell Ave | 0.68mi | 3/1.0 (-1) | 1,046 (+12%) | 6mo | $168,000 | $161 | 39 |
| 607 Forsythe Ave | 0.69mi | 3/1.0 (-1) | 840 (-10%) | 9mo | $105,000 | $125 | 38 |
Match score weights: distance 35% · size 25% · config 20% · recency 20%. Top-matched comps best support the ARV.
Projected returns pro-forma
-3.0% appreciation · 6.17% rent growth · sell at horizon
- IRR
- -0.3%
- Equity multiple
- 0.99×
- Total profit
- $-542
- Equity at exit
- $27,584
- IRR
- 12.4%
- Equity multiple
- 2.13×
- Total profit
- $58,354
- Equity at exit
- $15,995
Cash invested: $51,800 (down + closing). Projections, not guarantees.
Landlord ↔ Tenant lean methodology
- Overall (STATE)
- 43 Moderately Tenant-Leaning
- State Illinois
- 43 Moderately Tenant-Leaning · D+7
- County
- — inherits STATE
- City
- — inherits STATE
ZIP-level market 60409
- Home prices YoY
- -27.6%
- Rents YoY
- 6.2%
- Active inventory
- 198
- Price-to-rent
- 7.5×
Monthly cashflow live
- Estimated rent
- $2,050 medium interval (Pro) →
- Mortgage (P&I)
- −$970
- Tax from tax record
- −$217 /mo · $2,598/yr
- Insurance
- −$77
- HOA
- −$0
- Vacancy / Maint / Mgmt
- −$431
- Net cashflow
- $356
Break-even live
UW: 25.0% down · 7.5% · 30yr · 1.5% tax · 5.0% vac · 8.0% maint · 8.0% mgmt
Financing live
Cash to close
- Down payment
- $46,250
- Closing costs
- $5,550
- Reserves months
- —
- Total cash needed
- —
Loan-product check · same deal, 3 products live
Conventional
25% down · 7.5% · 30yr
- Down + closing
- —
- Monthly P&I
- —
- Monthly cashflow
- —
- DSCR
- —
- Eligible?
- —
Personal DTI + credit; lowest rate.
DSCR
20% down · 8.5% · 30yr
- Down + closing
- —
- Monthly P&I
- —
- Monthly cashflow
- —
- DSCR
- —
- Eligible?
- —
No personal income docs; deal must DSCR.
Hard money
10% down · 12.0% · 12mo
- Down + closing
- —
- Monthly P&I
- —
- Monthly cashflow
- —
- DSCR
- —
- Eligible?
- —
Short-term bridge; refi at stabilization.
Rent comps 2 comps
| Address | Beds | Baths | Sqft | Rent | $/sqft | DOM | Units | Dist |
|---|---|---|---|---|---|---|---|---|
| 115 157th St Unit 3 Calumet City, IL | 3.0 | 1.0 | 800 | $1,350 | $1.69 | 24d | 1 | 0.86mi |
| 2790 E State St Apt 2E Burnham, IL | 3.0 | 2.0 | 1100 | $1,695 | $1.54 | 24d | 1 | 0.95mi |
Listing history 9 events
-
2026-06-18days on market $185,000 Active 12 DOM
-
2026-06-17days on market $185,000 Active 11 DOM
-
2026-06-16days on market $185,000 Active 10 DOM
-
2026-06-15days on market $185,000 Active 9 DOM
-
2026-06-13days on market $185,000 Active 7 DOM
-
2026-06-09days on market $185,000 Active 3 DOM
-
2026-06-08days on market $185,000 Active 2 DOM
-
2026-06-07remarks 693-char remark
-
2026-06-07$185,000 Active 1 DOM
ⓘ Source: listings_history table (triggers on properties + properties_extension) + one-shot
backfill from property_details.listing_events for pre-trigger history.
Tax reassessment forecast IL · Partial reset (capped growth)
- Current annual tax
- $2,598 · $217/mo
- Projected year-2 tax
- $3,399 · $283/mo
- Expected delta
- +$801/yr (+$67/mo · 30.8%)
ⓘ Screening estimate from a state-policy table — verify with the county assessor before closing.
Climate risk First Street
- Flood 1/10 Low FEMA zone X (unshaded) · 0% chance over 30 yrs
- Wildfire 1/10 Low
- Heat 3/10 Moderate 7 d/yr ≥102°F today · 15 d/yr by 30 yrs out
- Wind 2/10 Low 0% chance of damaging wind over 30 yrs
- Air quality 4/10 Moderate 5 unhealthy d/yr today · 6 by 30 yrs out
Nearby sold comps map
Loading sold comps map…
Walkable amenities ~0.75 mi
Loading nearby amenities…
Taxation est. · year 1
- Rental income
- $24,602
- − Mortgage interest
- −$10,363
- − Property taxes
- −$2,598
- − Insurance
- −$925
- − Repairs & maintenance
- −$1,968
- − Management
- −$1,968
- − Depreciation
- −$5,382
- Taxable income
- $1,398
- Est. tax owed @ 24.0%
- −$336
- After-tax cash flow
- $3,935/yr
For passive investors: Depreciation is non-cash, so a rental often shows a tax loss while cash-flowing — sheltering income. Rental losses are passive: they offset passive income freely, and up to $25,000/yr can offset ordinary (W-2) income if you actively participate and your MAGI is under $100k (phasing out to $0 by $150k); unused losses carry forward. On sale, claimed depreciation is recaptured at up to 25%, and gains may owe capital-gains tax (a 1031 exchange can defer both). Figures are a year-1 estimate at your 24.0% rate — not tax advice; consult a CPA.
Schools (NCES district)
- District
- Thornton Fractional Twp Hsd 215
- NCES district ID
- 1738940
- Math proficiency
- 9% ▼ -3.00%
- Reading proficiency
- 13% ▼ -3.00%
- Median HH income
- $48,207
- Composite
- 10.27/100
- National rank
- #9793
- State rank
- #563 of 620 in IL
Livability — Calumet City
- Score
- 71/100
- State rank
- #330
- US rank
- #6552
Category grades
Schools grade is shown separately in the Schools card above.
Census & demographics
- Census place
- Calumet City, IL
- County
- Cook County · 4,486,803 people
- City population
- 35,100
- Metro
- Chicago-Naperville-Elgin, IL-IN-WI
- Population (ZIP)
- 35,100
- Household income
- $55,369
- Rent vs Own
- Severe rent burden
- 2415.0
Population outlook (Cook County) Hauer SSP2
- Today (2025)
- 5,347,519 people
- By 2030
- 5,357,703 · +0.2%
- By 2040
- 5,324,924 · -0.4%
- By 2050
- 5,230,762 · -2.2%
- By 2075
- 4,785,735 · -10.5%
- By 2100
- 4,188,836 · -21.7%
Race, ethnicity, and origin ACS 2023
- Neighborhood character
- Predominantly Black (74%)
- Race & ethnicity
- Black 74% Hispanic / Latino 15% White 7% Two or more races 4%
- Hispanic origin (detail)
- Mexican 14%
- Common ancestry
- Romanian 2%
- Foreign-born
- 9% · Canada
- Languages at home
- 83% English-only · Spanish 14%
Political lean MEDSL · Cook
- 2024 margin
- Solid D (+42.0) · D 70.4% · R 28.4% · Other 1.2%
- 2008→2024 swing
- -11.4pp toward R · 2008: 53.4pp · 2024: 42.0pp
- All cycles
- 2024: D+42.0 2020: D+50.3 2016: D+53.0 2012: D+49.4 2008: D+53.4
Not yet ingested
- Civics
- —
Market trends
- HPI YoY
- ▼ -75.01%
- Current HPI
- 197.2137
- Rent YoY
- ▲ 6.17%
- Metro
- Chicago-Naperville-Elgin, IL-IN-WI
- State GDP YoY
- ▲ 1.59%
- F500 in state
- 60
Industry mix (Fortune 500 HQ in IL)
| Industry | F500 HQs | Revenue |
|---|---|---|
| Insurance | 4 | $201B |
|
||
| Consumer Goods | 4 | $87B |
|
||
| Industrial Machinery | 3 | $64B |
|
||
| Healthcare | 2 | $55B |
|
||
| Retail / Pharmacy | 1 | $148B |
|
||
| Agriculture / Food | 1 | $86B |
|
||
Price history
3 events — show timeline
- 2026-06-06 Listed $185,000 MRED as Distributed by MLS Grid
- 2026-06-06 Listing Removed — MRED as Distributed by MLS Grid
- 2026-04-09 Listing Removed — MRED as Distributed by MLS Grid
Property tax history
+12.2%/yrLatest (2023): $2,598 · +381.5% YoY. Source: county tax records.
Cash-flow waterfall
monthlySold comps — $/sqft
last 12 mo · ≤1 miLoading sold comps…