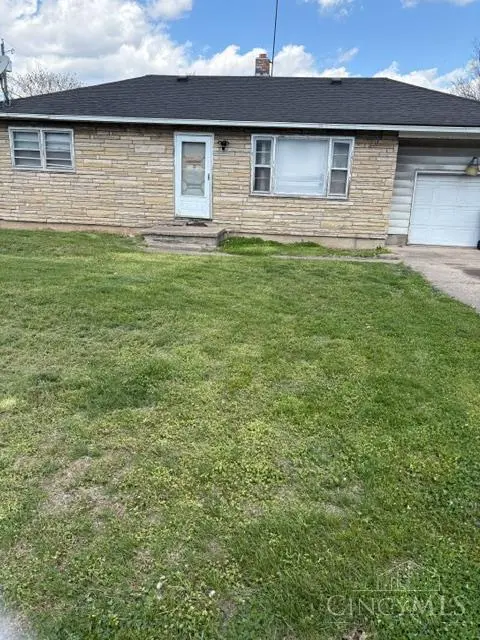
3127 Andrew St · Middletown, OH
Flood risk 1/10 · Minimal
- FEMA flood zone
- X (unshaded)
- Chance of flooding over 30 yrs
- 0.0%
- Est. flood insurance / yr
- $507 – $1,088
Fire risk 1/10 · Minimal
- Est. fire insurance / yr
- $713 – $1,323
Heat risk 4/10 · Minor
- Hot days now (above 103°F)
- 7 days/yr
- Hot days in 30 yrs
- 19 days/yr
Wind risk 2/10 · Minimal
- Chance of severe wind over 30 yrs
- 1.0%
Air-quality risk 3/10 · Minor
- Unhealthy air days now
- 2 days/yr
- Unhealthy air days in 30 yrs
- 3 days/yr
Risk factors via First Street. Map © Google.
Why this score? — see what drove the B+ grade
The composite is a weighted blend of 9 inputs, each scored 0–100. Each bar is that input's sub-score; the figure is the points it added to the 100-point composite (weight × sub-score).
- Cash flow +30.0/30.0
- ARV discount +14.4/15.0
- 1% rule +10.0/10.0
- DSCR +10.0/10.0
- Rent growth +4.1/5.0
- Livability +3.6/5.0
- Condition / age +2.5/5.0
- Schools +2.0/10.0
- Appreciation +0.0/10.0
$109,900
🖨 Deal sheet 📄 Offer letter ✓ Due diligence
Listing remarks MLS
2 bedroom ranch with partial basement, all appliances to stay, very nice lot with lots of potential
Key facts
- Garage
- Built 1956
- Listed 72 days
Neighborhood map
What this means for you Summary
Snapshot
- This is a 2-bed/1.0-bath single-family listed at $110k.
Deal economics
- At list price, monthly cash flow is $630 ($8k/yr) — positive.
- The deal already cash-flows at list — no discount required.
- Meets the 1% rule at list price ($2k rent vs $110k).
- Recommended offer: $103k (6.0% below list) — sets the bar for market timing.
- Cap rate 13.2% vs local median 4.5% in Middletown — top-decile yield for the area; either an underpriced asset or a hidden risk that comps aren't pricing in. Stress-test before assuming the spread holds.
Location & tenants
- Location reads 72/100 on livability (#389 in OH) — a middle-class / working-renter tenant base. Strengths: cost of living A+, housing A+, health & safety A+; Watch: schools D+, crime D+, amenities D+.
- Middletown City (suburban): math 21% / reading 28% proficiency, ranked #610 of 656 in OH (top 93%) — low school quality limits family demand, transient renter base, plan for 1-2y turnover; 69% free/reduced lunch — lower-income household profile, screen leases tightly.
- Market conditions: Rents rising fast (+6.3%/yr); 203 active listings in the ZIP; 7 comparable units currently listed for rent nearby; rentals leasing fast (median 2d on market — plan ~1-2 weeks tenant-placement turnaround); 1,163 units permitted in Butler County in 2024 (356 in 5+ unit buildings).
Forward outlook
- Local home prices are declining (-3.0%/yr); year-one equity from $760 of loan paydown is wiped out by about $3k of value loss. Plan a longer hold.
- At projected returns (-3.0% appreciation + 6.3% rent growth), your $31k cash investment doubles in ~5 years — after that, you're playing with house money.
Negotiation context
- It's been on market 72 days — a 6% lower offer ($103k) is reasonable based on typical stale-listing flexibility.
- 2 sale attempts; this cycle's ask has dropped $20k (15%) from the opening price — seller is motivated, your offer sets the floor, not the list.
Risks & watch-outs
- Watch-outs: built in 1956 — expect roof / HVAC / electrical / plumbing capex.
Questions for the listing agent
- It's been on market 72 days. Have you received any prior offers? Is the seller open to a 6% concession, seller financing, or rate buy-down credit?
- Built in 1956 — when were the roof, HVAC, electrical panel, plumbing, and water heater last replaced?
- Why hasn't it sold? Are there any deal-killer items the seller is aware of (foundation, flood, title, zoning, code violations)?
- Is there a deadline driving the sale (1031 exchange, divorce, estate, relocation)? That informs how much negotiation room exists.
- Schools are D-rated, which usually means shorter tenancies and higher turnover. Who's the typical renter profile here, and what's been the actual vacancy rate?
- Crime grade is D in this area — have there been break-ins, vandalism, or insurance claims at this property in the last 3 years? What carrier currently insures it and at what premium?
- What's the average days-on-market for RENTAL listings here right now (not sales)? A rising rental-DOM trend means longer vacancies and softer asking-rent achievability than the comps imply.
- What's the recent tenant-quality profile in this submarket — average credit score on applications, eviction rate, late-payment / NSF rate, and stable-employment percentage? A property-management company in the area should have these aggregated.
- How much new for-sale + rental construction is in the pipeline within 1–3 miles? Heavy new supply typically softens prices + rents 12–24 months out; constrained supply supports both.
Investment metrics
- 1% rule
- 1.55% ✓
- Cap rate
- 13.17%
- Cash-on-cash
- 24.55%
- DSCR
- 2.09
- GRM
- 5.4
CMA / ARV
- ARV (median comp)
- $129,779
- List price
- $109,900
- Delta
- -15.32%
- Verdict
- UNDERPRICED
- Comps
- 20 within 1.0 mi
Show comp detail 12 sales within ~0.75 mi
| Address | Dist | Beds/Ba | Sqft | Sold | Price | $/sf | Match |
|---|---|---|---|---|---|---|---|
| 3210 Finley St | 0.09mi | 3/1.0 (+1) | 860 (-0%) | 2mo | $139,900 | $163 | 88 |
| 3220 Finley St | 0.14mi | 2/1.0 | 840 (-3%) | 5mo | $154,000 | $183 | 85 |
| 1505 Pershing Ave | 0.37mi | 2/1.0 | 864 (0%) | 2mo | $155,000 | $179 | 81 |
| 1617 Pershing Ave | 0.37mi | 2/1.0 | 868 (+0%) | 10mo | $70,000 | $81 | 74 |
| 3107 Judy Dr | 0.45mi | 3/1.0 (+1) | 864 (0%) | 1mo | $115,500 | $134 | 73 |
| 3003 Roslyn Dr | 0.32mi | 3/1.0 (+1) | 864 (0%) | 14mo | $179,600 | $208 | 68 |
| 3013 Yankee Rd | 0.28mi | 2/2.0 | 816 (-6%) | 14mo | $189,900 | $233 | 62 |
| 3009 Seneca St | 0.62mi | 3/1.0 (+1) | 864 (0%) | 8mo | $129,900 | $150 | 60 |
| 1309 Oxford State Rd | 0.40mi | 3/1.0 (+1) | 792 (-8%) | 4mo | $170,000 | $215 | 59 |
| 1702 Glenwood Ave | 0.29mi | 3/1.0 (+1) | 965 (+12%) | 8mo | $174,900 | $181 | 56 |
| 1717 Pershing Ave | 0.41mi | 2/1.0 | 972 (+12%) | 8mo | $127,000 | $131 | 54 |
| 3014 Ben Harrison St | 0.59mi | 2/1.0 | 762 (-12%) | 12mo | $134,000 | $176 | 43 |
Match score weights: distance 35% · size 25% · config 20% · recency 20%. Top-matched comps best support the ARV.
Projected returns pro-forma
-3.0% appreciation · 6.31% rent growth · sell at horizon
- IRR
- 21.5%
- Equity multiple
- 1.91×
- Total profit
- $28,148
- Equity at exit
- $16,386
- IRR
- 31.6%
- Equity multiple
- 4.31×
- Total profit
- $101,886
- Equity at exit
- $9,502
Cash invested: $30,772 (down + closing). Projections, not guarantees.
Landlord ↔ Tenant lean methodology
- Overall (STATE)
- 73 Landlord-Friendly
- State Ohio
- 73 Landlord-Friendly · R+6
- County
- — inherits STATE
- City
- — inherits STATE
ZIP-level market 45044
- Rents YoY
- 6.3%
- Active inventory
- 203
- Price-to-rent
- 5.4×
Monthly cashflow live
- Estimated rent
- $1,704 high interval (Pro) →
- Mortgage (P&I)
- −$576
- Tax from tax record
- −$94 /mo · $1,132/yr
- Insurance
- −$46
- HOA
- −$0
- Vacancy / Maint / Mgmt
- −$358
- Net cashflow
- $630
Break-even live
UW: 25.0% down · 7.5% · 30yr · 1.5% tax · 5.0% vac · 8.0% maint · 8.0% mgmt
Financing live
Cash to close
- Down payment
- $27,475
- Closing costs
- $3,297
- Reserves months
- —
- Total cash needed
- —
Loan-product check · same deal, 3 products live
Conventional
25% down · 7.5% · 30yr
- Down + closing
- —
- Monthly P&I
- —
- Monthly cashflow
- —
- DSCR
- —
- Eligible?
- —
Personal DTI + credit; lowest rate.
DSCR
20% down · 8.5% · 30yr
- Down + closing
- —
- Monthly P&I
- —
- Monthly cashflow
- —
- DSCR
- —
- Eligible?
- —
No personal income docs; deal must DSCR.
Hard money
10% down · 12.0% · 12mo
- Down + closing
- —
- Monthly P&I
- —
- Monthly cashflow
- —
- DSCR
- —
- Eligible?
- —
Short-term bridge; refi at stabilization.
Rent comps 7 comps
| Address | Beds | Baths | Sqft | Rent | $/sqft | DOM | Units | Dist |
|---|---|---|---|---|---|---|---|---|
| 1419 Oxford State Rd Middletown, OH | 2.0 | 1.0 | 900 | $2,495 | $2.77 | 1d | 1 | 0.22mi |
| 1109 Oxford State Rd Middletown, OH | 2.0 | 1.0 | 744 | $995 | $1.34 | 1d | 1 | 0.55mi |
| 2206 Baltimore St Middletown, OH | 1.0 | 1.0 | 596 | $900 | $1.51 | 43d | 1 | 0.82mi |
| 2000 Pearl St Middletown, OH | 2.0 | 1.0 | 900 | $3,500 | $3.89 | 1d | 4 | 0.96mi |
| 1904 Baltimore St Middletown, OH | 2.0 | 1.0 | 624 | $975 | $1.56 | 43d | 1 | 1.01mi |
| 2101 S Main St Middletown, OH | 1.0–2.0 | 1.0 | 757 | $900 | $1.19 | 1d | 1 | 1.32mi |
| 1409 Young St Unit 1 Middletown, OH | 1.0 | 1.0 | 1050 | $950 | $0.90 | 4d | 1 | 1.39mi |
Listing history 16 events
-
2026-06-18days on market $109,900 Active 72 DOM
-
2026-06-17days on market $109,900 Active 71 DOM
-
2026-06-16days on market $109,900 Active 70 DOM
-
2026-06-15days on market $109,900 Active 69 DOM
-
2026-06-13days on market $109,900 Active 67 DOM
-
2026-06-09days on market $109,900 Active 63 DOM
-
2026-06-08days on market $109,900 Active 62 DOM
-
2026-06-07pricedays on market $109,900 Active 61 DOM
-
2026-06-03days on market $119,900 Active 57 DOM
-
2026-06-02days on market $119,900 Active 56 DOM
-
2026-06-01days on market $119,900 Active 55 DOM
-
2026-05-31days on market $119,900 Active 54 DOM
-
2026-05-19price $119,900 99-char remark
Show marketing remark (99 chars)
2 bedroom ranch with partial basement, all appliances to stay, very nice lot with lots of potential
-
2026-05-19price $119,900 99-char remark
Show marketing remark (99 chars)
2 bedroom ranch with partial basement, all appliances to stay, very nice lot with lots of potential
-
2026-04-07$129,900 Active 99-char remark
Show marketing remark (99 chars)
2 bedroom ranch with partial basement, all appliances to stay, very nice lot with lots of potential
-
2026-04-03$129,900 Active 99-char remark
Show marketing remark (99 chars)
2 bedroom ranch with partial basement, all appliances to stay, very nice lot with lots of potential
ⓘ Source: listings_history table (triggers on properties + properties_extension) + one-shot
backfill from property_details.listing_events for pre-trigger history.
Tax reassessment forecast OH · Partial reset (capped growth)
- Current annual tax
- $1,132 · $94/mo
- Projected year-2 tax
- $1,423 · $119/mo
- Expected delta
- +$291/yr (+$24/mo · 25.7%)
ⓘ Screening estimate from a state-policy table — verify with the county assessor before closing.
Climate risk First Street
- Flood 1/10 Low FEMA zone X (unshaded) · 0% chance over 30 yrs
- Wildfire 1/10 Low
- Heat 4/10 Moderate 7 d/yr ≥103°F today · 19 d/yr by 30 yrs out
- Wind 2/10 Low 100% chance of damaging wind over 30 yrs
- Air quality 3/10 Moderate 2 unhealthy d/yr today · 3 by 30 yrs out
Nearby sold comps map
Loading sold comps map…
Walkable amenities ~0.75 mi
Loading nearby amenities…
Taxation est. · year 1
- Rental income
- $20,445
- − Mortgage interest
- −$6,156
- − Property taxes
- −$1,132
- − Insurance
- −$550
- − Repairs & maintenance
- −$1,636
- − Management
- −$1,636
- − Depreciation
- −$3,197
- Taxable income
- $6,139
- Est. tax owed @ 24.0%
- −$1,473
- After-tax cash flow
- $6,081/yr
For passive investors: Depreciation is non-cash, so a rental often shows a tax loss while cash-flowing — sheltering income. Rental losses are passive: they offset passive income freely, and up to $25,000/yr can offset ordinary (W-2) income if you actively participate and your MAGI is under $100k (phasing out to $0 by $150k); unused losses carry forward. On sale, claimed depreciation is recaptured at up to 25%, and gains may owe capital-gains tax (a 1031 exchange can defer both). Figures are a year-1 estimate at your 24.0% rate — not tax advice; consult a CPA.
Schools (NCES district)
- District
- Middletown City
- NCES district ID
- 3904440
- Math proficiency
- 21% ▼ -17.00%
- Reading proficiency
- 28% ▼ -15.00%
- Median HH income
- $36,650
- Composite
- 20.35/100
- National rank
- #8605
- State rank
- #610 of 656 in OH
Livability — Middletown
- Score
- 72/100
- State rank
- #389
- US rank
- #6338
Category grades
Schools grade is shown separately in the Schools card above.
Census & demographics
- Census place
- Middletown, OH
- County
- Butler County · 381,674 people
- City population
- 96,117
- Metro
- Cincinnati, OH-KY-IN
- Population (ZIP)
- 56,217
- Household income
- $73,732
- Rent vs Own
- Severe rent burden
- 1532.0
Population outlook (Butler County) Hauer SSP2
- Today (2025)
- 387,706 people
- By 2030
- 392,028 · +1.1%
- By 2040
- 395,307 · +2.0%
- By 2050
- 391,116 · +0.9%
- By 2075
- 378,642 · -2.3%
- By 2100
- 343,248 · -11.5%
Race, ethnicity, and origin ACS 2023
- Neighborhood character
- Predominantly White (72%)
- Race & ethnicity
- White 72% Black 12% Two or more races 8% Hispanic / Latino 7% Asian 2%
- Hispanic origin (detail)
- Mexican 2% Dominican 1%
- Common ancestry
- Slovak 2% Italian 2% Romanian 2%
- Foreign-born
- 6% · Canada
- Languages at home
- 92% English-only · Spanish 4% Other Indo-European 1% Tagalog/Filipino 1%
Political lean MEDSL · Butler
- 2024 margin
- Strong R (+26.3) · D 36.4% · R 62.7%
- 2008→2024 swing
- -3.6pp toward R · 2008: -22.6pp · 2024: -26.3pp
- All cycles
- 2024: R+26.3 2020: R+24.0 2016: R+28.3 2012: R+26.2 2008: R+22.6
Not yet ingested
- Civics
- —
Market trends
- HPI YoY
- ▼ -164.07%
- Current HPI
- 219.0479
- Rent YoY
- ▲ 6.31%
- Metro
- Cincinnati, OH-KY-IN
- State GDP YoY
- ▲ 1.98%
- F500 in state
- 48
Industry mix (Fortune 500 HQ in OH)
| Industry | F500 HQs | Revenue |
|---|---|---|
| Insurance | 3 | $145B |
|
||
| Industrial Machinery | 3 | $49B |
|
||
| Financial Services | 3 | $24B |
|
||
| Consumer Goods | 2 | $93B |
|
||
| Aerospace / Defense | 2 | $47B |
|
||
| Utilities | 2 | $33B |
|
||
Price history
-7.7% since first listed4 events — show timeline
- 2026-05-19 Price Changed $119,900 Dayton MLS
- 2026-05-19 Price Changed $119,900 Cincy MLS
- 2026-04-07 Listed $129,900 Dayton MLS
- 2026-04-03 Listed $129,900 Cincy MLS
Property tax history
+0.2%/yrLatest (2025): $1,132 · +1.3% YoY. Source: county tax records.
Cash-flow waterfall
monthlySold comps — $/sqft
last 12 mo · ≤1 miLoading sold comps…