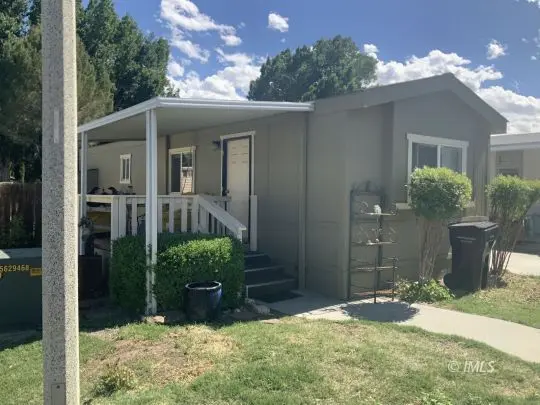
2344 Edinburgh Ave · Dixon Lane-MeadowCreek, CA
Flood risk No data
- FEMA flood zone
- —
- Chance of flooding over 30 yrs
- —
- Est. flood insurance / yr
- —
Fire risk No data
- Est. fire insurance / yr
- —
Heat risk No data
- Hot days now (above threshold)
- —
- Hot days in 30 yrs
- —
Wind risk No data
- Chance of severe wind over 30 yrs
- —
Air-quality risk No data
- Unhealthy air days now
- —
- Unhealthy air days in 30 yrs
- —
Risk factors via First Street. Map © Google.
Why this score? — see what drove the B- grade
The composite is a weighted blend of 9 inputs, each scored 0–100. Each bar is that input's sub-score; the figure is the points it added to the 100-point composite (weight × sub-score).
- Cash flow +30.0/30.0
- 1% rule +10.0/10.0
- DSCR +10.0/10.0
- ARV discount +7.8/15.0
- Schools +2.7/10.0
- Rent growth +2.5/5.0
- Livability +2.5/5.0
- Condition / age +2.5/5.0
- Appreciation +0.0/10.0
$59,900
🖨 Deal sheet 📄 Offer letter ✓ Due diligence
Listing remarks MLS
One bedroom, one bath located in the Highlands senior park! Close to the clubhouse, and pool. This home has newer laminate flooring, newer double pane windows, and great mountain views from the back yard!
Key facts
- Clubhouse
- Pool
- Mountain views
Tags
Property features AI
Finance
- Financial info: Offered for sale
Exterior
- Utilities: Propane service; Public sewer
- Home design: Single-story; Composition roof; One-family residential zoning (Inyo County)
- Exterior features: Concrete driveway; Covered porch; Wood fencing; Lawn; Views; Has view
Interior
- Kitchen: Gas oven; Gas range; Refrigerator
- Bathrooms: 1 full bathroom
- Heating & cooling: Floor furnace heating; Has cooling
- Interior features: Double pane windows; Unfurnished; Other interior features (see remarks)
- Laundry & utility: Laundry features: see remarks; Propane water heater
Neighborhood map
What this means for you Summary
Snapshot
- This is a 1-bed/1.0-bath manufactured listed at $60k.
Deal economics
- At list price, monthly cash flow is $832 ($10k/yr) — positive.
- The deal already cash-flows at list — no discount required.
- Meets the 1% rule at list price ($2k rent vs $60k).
Location & tenants
- Location reads: area grade B — affects rentability + tenant quality, not the cash-flow math above.
- Bishop Unified (town): math 25% / reading 36% proficiency, ranked #337 of 517 in CA (top 65%) — families likely to look elsewhere, expect single-tenant / working-renter base with shorter leases.
- Market conditions: 74 active listings in the ZIP; 18 units permitted in Inyo County in 2024 (0 in 5+ unit buildings).
Forward outlook
- Local home prices are declining (-3.0%/yr); year-one equity from $414 of loan paydown is wiped out by about $2k of value loss. Plan a longer hold.
- Inyo County population projected at -18% by 2050 — secular population decline; favor cash flow + early exit over multi-decade hold.
- At projected returns (-3.0% appreciation + 3.0% rent growth), your $17k cash investment doubles in ~2 years — after that, you're playing with house money.
Negotiation context
- Only 5 days on market — expect competitive offers; lowballing is unlikely to land.
- 2 sale attempts with the ask held roughly flat each time — persistent listings suggest the price (not the market) is what's stuck; bring a comps-based counter.
Questions for the listing agent
- Is there a deadline driving the sale (1031 exchange, divorce, estate, relocation)? That informs how much negotiation room exists.
- What's the average days-on-market for RENTAL listings here right now (not sales)? A rising rental-DOM trend means longer vacancies and softer asking-rent achievability than the comps imply.
- What's the recent tenant-quality profile in this submarket — average credit score on applications, eviction rate, late-payment / NSF rate, and stable-employment percentage? A property-management company in the area should have these aggregated.
- How much new for-sale + rental construction is in the pipeline within 1–3 miles? Heavy new supply typically softens prices + rents 12–24 months out; constrained supply supports both.
Investment metrics
- 1% rule
- 2.63% ✓
- Cap rate
- 22.96%
- Cash-on-cash
- 59.52%
- DSCR
- 3.65
- GRM
- 3.2
CMA / ARV
- ARV (on-the-fly)
- $60,368
- Comps found
- 3
Show comp detail 3 sales within ~0.75 mi
| Address | Dist | Beds/Ba | Sqft | Sold | Price | $/sf | Match |
|---|---|---|---|---|---|---|---|
| 2344 Edinburgh Ave | 0.00mi | 1/1.0 | 616 (0%) | 0mo | $44,000 | $71 | 100 |
| 1445 Highlands Sienor Park Dunbar Ln | 0.06mi | 2/1.0 (+1) | 611 (-1%) | 14mo | $60,000 | $98 | 79 |
| 2233 Tam O Shanter Ave | 0.41mi | 2/1.5 (+1) | 672 (+9%) | 11mo | $98,000 | $146 | 50 |
Match score weights: distance 35% · size 25% · config 20% · recency 20%. Top-matched comps best support the ARV.
Projected returns pro-forma
-3.0% appreciation · 3.0% rent growth · sell at horizon
- IRR
- 58.2%
- Equity multiple
- 3.58×
- Total profit
- $43,304
- Equity at exit
- $8,931
- IRR
- 63.0%
- Equity multiple
- 7.32×
- Total profit
- $106,035
- Equity at exit
- $5,179
Cash invested: $16,772 (down + closing). Projections, not guarantees.
Landlord ↔ Tenant lean methodology
- Overall (STATE)
- 18 Strongly Tenant-Friendly
- State California
- 18 Strongly Tenant-Friendly · D+13
- County
- — inherits STATE
- City
- — inherits STATE
ZIP-level market 93514
- Active inventory
- 74
- Price-to-rent
- 3.2×
Monthly cashflow live
- Estimated rent
- $1,577 medium interval (Pro) →
- Mortgage (P&I)
- −$314
- Tax est. 1.5%
- −$75 /mo · $898/yr
- Insurance
- −$25
- HOA
- −$0
- Vacancy / Maint / Mgmt
- −$331
- Net cashflow
- $832
Break-even live
UW: 25.0% down · 7.5% · 30yr · 1.5% tax · 5.0% vac · 8.0% maint · 8.0% mgmt
Financing live
Cash to close
- Down payment
- $14,975
- Closing costs
- $1,797
- Reserves months
- —
- Total cash needed
- —
Loan-product check · same deal, 3 products live
Conventional
25% down · 7.5% · 30yr
- Down + closing
- —
- Monthly P&I
- —
- Monthly cashflow
- —
- DSCR
- —
- Eligible?
- —
Personal DTI + credit; lowest rate.
DSCR
20% down · 8.5% · 30yr
- Down + closing
- —
- Monthly P&I
- —
- Monthly cashflow
- —
- DSCR
- —
- Eligible?
- —
No personal income docs; deal must DSCR.
Hard money
10% down · 12.0% · 12mo
- Down + closing
- —
- Monthly P&I
- —
- Monthly cashflow
- —
- DSCR
- —
- Eligible?
- —
Short-term bridge; refi at stabilization.
Listing history 2 events
-
2026-05-21$59,900 Active 204-char remark
Show marketing remark (204 chars)
One bedroom, one bath located in the Highlands senior park! Close to the clubhouse, and pool. This home has newer laminate flooring, newer double pane windows, and great mountain views from the back yard!
-
2026-05-21$59,900 Active
Show marketing remark (204 chars)
One bedroom, one bath located in the Highlands senior park! Close to the clubhouse, and pool. This home has newer laminate flooring, newer double pane windows, and great mountain views from the back yard!
ⓘ Source: listings_history table (triggers on properties + properties_extension) + one-shot
backfill from property_details.listing_events for pre-trigger history.
Nearby sold comps map
Loading sold comps map…
Walkable amenities ~0.75 mi
Loading nearby amenities…
Taxation est. · year 1
- Rental income
- $18,925
- − Mortgage interest
- −$3,355
- − Property taxes
- −$898
- − Insurance
- −$300
- − Repairs & maintenance
- −$1,514
- − Management
- −$1,514
- − Depreciation
- −$1,743
- Taxable income
- $9,601
- Est. tax owed @ 24.0%
- −$2,304
- After-tax cash flow
- $7,679/yr
For passive investors: Depreciation is non-cash, so a rental often shows a tax loss while cash-flowing — sheltering income. Rental losses are passive: they offset passive income freely, and up to $25,000/yr can offset ordinary (W-2) income if you actively participate and your MAGI is under $100k (phasing out to $0 by $150k); unused losses carry forward. On sale, claimed depreciation is recaptured at up to 25%, and gains may owe capital-gains tax (a 1031 exchange can defer both). Figures are a year-1 estimate at your 24.0% rate — not tax advice; consult a CPA.
Schools (NCES district)
- District
- Bishop Unified
- NCES district ID
- 0601409
- Math proficiency
- 25% ▼ -9.00%
- Reading proficiency
- 36% ▼ -6.00%
- Median HH income
- $49,430
- Composite
- 26.52/100
- National rank
- #7197
- State rank
- #337 of 517 in CA
Livability — Dixon Lane-MeadowCreek
No livability data for this city. (Only ~50 U.S. cities are tracked.)
Census & demographics
- Census place
- Dixon Lane-MeadowCreek, CA
- Population (ZIP)
- 14,961
Population outlook (Inyo County) Hauer SSP2
- Today (2025)
- 17,399 people
- By 2030
- 16,824 · -3.3%
- By 2040
- 15,543 · -10.7%
- By 2050
- 14,332 · -17.6%
- By 2075
- 12,213 · -29.8%
- By 2100
- 9,997 · -42.5%
Race, ethnicity, and origin ACS 2023
- Neighborhood character
- Diverse neighborhood (Simpson 0.58)
- Race & ethnicity
- White 60% Hispanic / Latino 25% Two or more races 14% Native American 9% Asian 2%
- Hispanic origin (detail)
- Mexican 20%
- Common ancestry
- Slovak 4% Italian 3% Romanian 2%
- Foreign-born
- 9% · Canada, Jamaica
- Languages at home
- 85% English-only · Spanish 12% Other Indo-European 1% Tagalog/Filipino 1%
Political lean MEDSL · Inyo
- 2024 margin
- Toss-up / Even · D 46.9% · R 49.9% · Other 3.1%
- 2008→2024 swing
- +6.2pp toward D · 2008: -9.2pp · 2024: -3.0pp
- All cycles
- 2024: R+3.0 2020: D+0.1 2016: R+13.7 2012: R+11.8 2008: R+9.2
Not yet ingested
- Civics
- —
Market trends
- HPI YoY
- ▼ -387.39%
- Current HPI
- 231.287
- Rent YoY
- —
- Metro
- —
- State GDP YoY
- ▲ 3.21%
- F500 in state
- 116
Industry mix (Fortune 500 HQ in CA)
| Industry | F500 HQs | Revenue |
|---|---|---|
| Technology | 27 | $1,492B |
|
||
| Financial Services | 3 | $174B |
|
||
| Retail | 3 | $44B |
|
||
| Insurance | 3 | $26B |
|
||
| Media / Entertainment | 2 | $115B |
|
||
| Pharmaceuticals / Biotech | 2 | $62B |
|
||
Price history
+0.0% since first listed2 events — show timeline
- 2026-05-21 Listed $59,900 MLBOR
- 2026-05-21 Listed $59,900 IMLS
Property tax history
-0.7%/yrLatest (2025): $63 · +12.2% YoY. Source: county tax records.
Cash-flow waterfall
monthlySold comps — $/sqft
last 12 mo · ≤1 miLoading sold comps…