1810 Holiday Dr · Holiday, FL
Flood risk 1/10 · Minimal
- FEMA flood zone
- X (unshaded)
- Chance of flooding over 30 yrs
- 0.0%
- Est. flood insurance / yr
- $507 – $1,088
Fire risk 2/10 · Minimal
- Est. fire insurance / yr
- $947 – $1,759
Heat risk 10/10 · Severe
- Hot days now (above 109°F)
- 7 days/yr
- Hot days in 30 yrs
- 28 days/yr
Wind risk 10/10 · Severe
- Chance of severe wind over 30 yrs
- 99.0%
Air-quality risk 2/10 · Minimal
- Unhealthy air days now
- 1 days/yr
- Unhealthy air days in 30 yrs
- 1 days/yr
Risk factors via First Street. Map © Google.
Why this score? — see what drove the B+ grade
The composite is a weighted blend of 9 inputs, each scored 0–100. Each bar is that input's sub-score; the figure is the points it added to the 100-point composite (weight × sub-score).
- Cash flow +30.0/30.0
- ARV discount +15.0/15.0
- 1% rule +10.0/10.0
- DSCR +10.0/10.0
- Schools +4.3/10.0
- Livability +3.3/5.0
- Rent growth +3.0/5.0
- Condition / age +2.5/5.0
- Appreciation +0.0/10.0
$49,900
🖨 Deal sheet 📄 Offer letter ✓ Due diligence
Listing remarks MLS
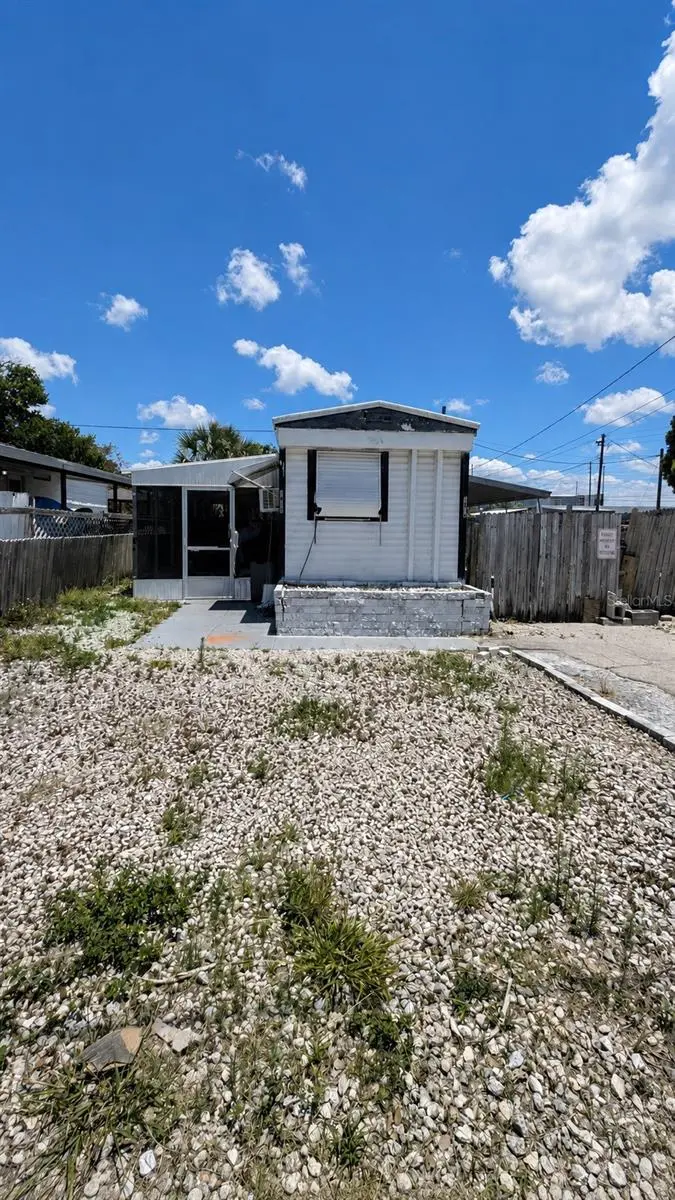
ADORABLE 2 BR 1.5 BA MOBILE FEATURING EAT-IN KITCHEN & LIVING ROOM, CARPORT & SHED. COMES FULLY FURNISHED. GREAT WINTER OR VACATION HOME. COME OWN A BIT OF SUNSHINE.
Key facts
- 3,719 sq ft lot
- 2 parking spots
- Built 1964
Property features AI
Finance
- Other: Property type: Residential mobile home; Lot size about 0.09 acres (approx. 0 to less than 1/4 acre)
Exterior
- Parking: Carport with 2 spaces
- Utilities: Public water available; Septic sewer; Electricity available; Water available; Sewer available
- Home design: Residential mobile home (single wide); One story; Faces east; Entry on main level
- Construction: Metal frame construction; Metal siding; Other construction materials; Metal roof; Pillar/post/pier foundation; Built as a single wide
- Exterior features: Other exterior features
Interior
- Kitchen: No appliances included
- Bedrooms: 2 bedrooms
- Flooring: Carpet; Vinyl
- Bathrooms: 1 full bathroom
- Heating & cooling: No central heating; Wall/window air conditioning units
- Interior features: Kitchen and family room combined; Other interior features
- Laundry & utility: Washer hookup; Electric dryer hookup; Other laundry feature
Neighborhood map
What this means for you Summary
Snapshot
- This is a 1-bed/1.0-bath manufactured listed at $50k.
Deal economics
- At list price, monthly cash flow is $614 ($7k/yr) — positive.
- The deal already cash-flows at list — no discount required.
- Meets the 1% rule at list price ($1k rent vs $50k).
- Recommended offer: $49k (1.5% below list) — sets the bar for market timing.
- Cap rate 21.1% vs local median 4.7% in Holiday — top-decile yield for the area; either an underpriced asset or a hidden risk that comps aren't pricing in. Stress-test before assuming the spread holds.
Location & tenants
- Location reads 66/100 on livability (#623 in FL) — a middle-class / working-renter tenant base. Strengths: cost of living A+, housing A+, health & safety B; Watch: crime D+, schools D, amenities F.
- Pasco (suburban): math 50% / reading 52% proficiency, ranked #32 of 73 in FL (top 44%) — acceptable for families but not a draw, mixed tenant base, ~2y average lease.
- Market conditions: Rents rising (+2.0%/yr); 324 active listings in the ZIP; 17 comparable units currently listed for rent nearby; rentals at typical pace (median 21d on market — plan ~3-4 weeks tenant-placement turnaround); 6,765 units permitted in Pasco County in 2024 (1,250 in 5+ unit buildings).
Forward outlook
- Local home prices are declining (-3.0%/yr); year-one equity from $345 of loan paydown is wiped out by about $1k of value loss. Plan a longer hold.
- Pasco County population projected at +29% by 2050 — long-run rental-demand tailwind backs the buy-and-hold thesis.
- At projected returns (-3.0% appreciation + 2.0% rent growth), your $14k cash investment doubles in ~3 years — after that, you're playing with house money.
Negotiation context
- It's been on market 30 days — a 2% lower offer ($49k) is reasonable based on typical stale-listing flexibility.
- 2 sale attempts since 21y ago with the ask held roughly flat each time — persistent listings suggest the price (not the market) is what's stuck; bring a comps-based counter.
- Current owner paid $26k; list at $50k implies a 88% gain — meaningful room to come down on a strong offer.
Risks & watch-outs
- Climate carrying-cost: severe wind risk, 99% chance of damaging wind over 30y; extreme-heat days projected 7→28/yr by 2055 (HVAC capex compounding) — expect insurance premiums to compound above CPI over the hold.
Questions for the listing agent
- Built in 1964 — when were the roof, HVAC, electrical panel, plumbing, and water heater last replaced?
- Is there a deadline driving the sale (1031 exchange, divorce, estate, relocation)? That informs how much negotiation room exists.
- Schools are D-rated, which usually means shorter tenancies and higher turnover. Who's the typical renter profile here, and what's been the actual vacancy rate?
- Crime grade is D in this area — have there been break-ins, vandalism, or insurance claims at this property in the last 3 years? What carrier currently insures it and at what premium?
- What's the average days-on-market for RENTAL listings here right now (not sales)? A rising rental-DOM trend means longer vacancies and softer asking-rent achievability than the comps imply.
- What's the recent tenant-quality profile in this submarket — average credit score on applications, eviction rate, late-payment / NSF rate, and stable-employment percentage? A property-management company in the area should have these aggregated.
- How much new for-sale + rental construction is in the pipeline within 1–3 miles? Heavy new supply typically softens prices + rents 12–24 months out; constrained supply supports both.
Investment metrics
- 1% rule
- 2.51% ✓
- Cap rate
- 21.05%
- Cash-on-cash
- 52.72%
- DSCR
- 3.35
- GRM
- 3.3
CMA / ARV
- ARV (on-the-fly)
- $75,920
- Comps found
- 6
Show comp detail 6 sales within ~0.75 mi
| Address | Dist | Beds/Ba | Sqft | Sold | Price | $/sf | Match |
|---|---|---|---|---|---|---|---|
| 1909 Lullaby Dr | 0.24mi | 1/1.0 | 470 (-10%) | 3mo | $68,500 | $146 | 70 |
| 2025 Melody Dr | 0.25mi | 2/1.5 (+1) | 576 (+11%) | 3mo | $87,500 | $152 | 61 |
| 2110 Orange Dr | 0.34mi | 2/1.5 (+1) | 460 (-12%) | 1mo | $57,000 | $124 | 57 |
| 1852 Hoyle Dr | 0.32mi | 2/1.0 (+1) | 576 (+11%) | 7mo | $55,000 | $95 | 56 |
| 2143 Orange Dr | 0.40mi | 2/1.0 (+1) | 480 (-8%) | 9mo | $71,500 | $149 | 56 |
| 1840 Dixie Ln | 0.69mi | 1/1.0 | 460 (-12%) | 2mo | $40,000 | $87 | 47 |
Match score weights: distance 35% · size 25% · config 20% · recency 20%. Top-matched comps best support the ARV.
Projected returns pro-forma
-3.0% appreciation · 2.05% rent growth · sell at horizon
- IRR
- 49.6%
- Equity multiple
- 3.14×
- Total profit
- $29,859
- Equity at exit
- $7,440
- IRR
- 54.7%
- Equity multiple
- 6.13×
- Total profit
- $71,715
- Equity at exit
- $4,314
Cash invested: $13,972 (down + closing). Projections, not guarantees.
Landlord ↔ Tenant lean methodology
- Overall (STATE)
- 87 Strongly Landlord-Friendly
- State Florida
- 87 Strongly Landlord-Friendly · R+3
- County
- — inherits STATE
- City
- — inherits STATE
ZIP-level market 34691
- Home prices YoY
- -23.9%
- Rents YoY
- 2.0%
- Active inventory
- 324
- Price-to-rent
- 3.3×
Monthly cashflow live
- Estimated rent
- $1,255 high interval (Pro) →
- Mortgage (P&I)
- −$262
- Tax from tax record
- −$95 /mo · $1,138/yr
- Insurance
- −$21
- HOA
- −$0
- Vacancy / Maint / Mgmt
- −$263
- Net cashflow
- $614
Break-even live
UW: 25.0% down · 7.5% · 30yr · 1.5% tax · 5.0% vac · 8.0% maint · 8.0% mgmt
Financing live
Cash to close
- Down payment
- $12,475
- Closing costs
- $1,497
- Reserves months
- —
- Total cash needed
- —
Loan-product check · same deal, 3 products live
Conventional
25% down · 7.5% · 30yr
- Down + closing
- —
- Monthly P&I
- —
- Monthly cashflow
- —
- DSCR
- —
- Eligible?
- —
Personal DTI + credit; lowest rate.
DSCR
20% down · 8.5% · 30yr
- Down + closing
- —
- Monthly P&I
- —
- Monthly cashflow
- —
- DSCR
- —
- Eligible?
- —
No personal income docs; deal must DSCR.
Hard money
10% down · 12.0% · 12mo
- Down + closing
- —
- Monthly P&I
- —
- Monthly cashflow
- —
- DSCR
- —
- Eligible?
- —
Short-term bridge; refi at stabilization.
Rent comps 17 comps
| Address | Beds | Baths | Sqft | Rent | $/sqft | DOM | Units | Dist |
|---|---|---|---|---|---|---|---|---|
| 2117 Calusa Trl Unit B Holiday, FL | 1.0 | 1.0 | 708 | $1,200 | $1.69 | 5d | 1 | 0.37mi |
| 2133 Melody Dr Holiday, FL | 2.0 | 1.0 | 510 | $1,078 | $2.11 | 15d | 1 | 0.38mi |
| 2122 Ranchita Trl Holiday, FL | 2.0 | 1.0 | 648 | $1,399 | $2.16 | 24d | 1 | 0.41mi |
| 2051 Pleasure Dr Holiday, FL | 2.0 | 1.0 | 720 | $1,200 | $1.67 | 24d | 1 | 0.42mi |
| 4318 Tahitian Gardens Cir Unit B Holiday, FL | 1.0 | 1.0 | 576 | $1,200 | $2.08 | 24d | 1 | 0.59mi |
| 4358 Tahitian Gardens Cir Unit G Holiday, FL | 1.0 | 1.0 | 600 | $1,350 | $2.25 | 24d | 1 | 0.66mi |
| 4358 Tahitian Gardens Cir Holiday, FL | 1.0 | 1.0 | 600 | $1,350 | $2.25 | 15d | 1 | 0.66mi |
| 5409 Oceanic Rd Holiday, FL | 1.0 | 1.0 | 624 | $1,225 | $1.96 | 24d | 1 | 0.99mi |
| 4205 Jordana Way Holiday, FL | 1.0–3.0 | 1.0–2.0 | 1027 | $1,176 | $1.14 | 2d | 13 | 1.00mi |
| 5419 Oceanic Rd Holiday, FL | 1.0 | 1.0 | 624 | $1,200 | $1.92 | 12d | 1 | 1.00mi |
| 5441 Oceanic Rd Holiday, FL | 1.0 | 1.0 | 600 | $1,100 | $1.83 | 24d | 1 | 1.04mi |
| 4348 Plaza Dr Holiday, FL | 1.0–2.0 | 1.0–2.0 | 860 | $1,099 | $1.28 | 2d | 9 | 1.05mi |
| 5603 Cheyenne Dr Holiday, FL | 1.0 | 1.0 | 525 | $1,100 | $2.10 | 24d | 1 | 1.20mi |
| 5633 Golden Nugget Dr Holiday, FL | 1.0 | 1.0 | 600 | $1,175 | $1.96 | 24d | 1 | 1.24mi |
| 623 Beckett Way Unit B Tarpon Springs, FL | 1.0 | 1.0 | 600 | $1,250 | $2.08 | 3d | 1 | 1.28mi |
| 5709 Silver Spur Dr Holiday, FL | 1.0 | 1.0 | 727 | $1,095 | $1.51 | 15d | 1 | 1.30mi |
| 1525 Swordbill Dr Holiday, FL | 1.0 | 1.0 | 700 | $1,090 | $1.56 | 20d | 1 | 1.33mi |
Listing history 16 events
-
2026-06-18days on market $49,900 Active 30 DOM
-
2026-06-17days on market $49,900 Active 29 DOM
-
2026-06-16days on market $49,900 Active 28 DOM
-
2026-06-15days on market $49,900 Active 27 DOM
-
2026-06-13days on market $49,900 Active 25 DOM
-
2026-06-09days on market $49,900 Active 21 DOM
-
2026-06-08days on market $49,900 Active 20 DOM
-
2026-06-07days on market $49,900 Active 19 DOM
-
2026-06-04days on market $49,900 Active 16 DOM
-
2026-06-03days on market $49,900 Active 15 DOM
-
2026-06-02days on market $49,900 Active 14 DOM
-
2026-06-01days on market $49,900 Active 13 DOM
-
2026-05-31days on market $49,900 Active 12 DOM
-
2026-05-19$49,900 Active
-
2005-05-06soldstatus $26,500 177-char remark
Show marketing remark (177 chars)
ADORABLE 2 BR 1.5 BA MOBILE FEATURING EAT-IN KITCHEN & LIVING ROOM, CARPORT & SHED. COMES FULLY FURNISHED. GREAT WINTER OR VACATION HOME. COME OWN A BIT OF SUNSHINE.
-
2005-03-25$29,900 177-char remark
Show marketing remark (177 chars)
ADORABLE 2 BR 1.5 BA MOBILE FEATURING EAT-IN KITCHEN & LIVING ROOM, CARPORT & SHED. COMES FULLY FURNISHED. GREAT WINTER OR VACATION HOME. COME OWN A BIT OF SUNSHINE.
ⓘ Source: listings_history table (triggers on properties + properties_extension) + one-shot
backfill from property_details.listing_events for pre-trigger history.
Tax reassessment forecast FL · Resets to sale price
- Current annual tax
- $1,138 · $95/mo
- Projected year-2 tax
- $1,138 · $95/mo
- Expected delta
- $0/yr ($0/mo · 0.0%)
ⓘ Screening estimate from a state-policy table — verify with the county assessor before closing.
Climate risk First Street
- Flood 1/10 Low FEMA zone X (unshaded) · 0% chance over 30 yrs
- Wildfire 2/10 Low
- Heat 10/10 Extreme 7 d/yr ≥109°F today · 28 d/yr by 30 yrs out
- Wind 10/10 Extreme 99% chance of damaging wind over 30 yrs
- Air quality 2/10 Low 1 unhealthy d/yr today · 1 by 30 yrs out
Nearby sold comps map
Loading sold comps map…
Walkable amenities ~0.75 mi
Loading nearby amenities…
Taxation est. · year 1
- Rental income
- $15,055
- − Mortgage interest
- −$2,795
- − Property taxes
- −$1,138
- − Insurance
- −$250
- − Repairs & maintenance
- −$1,204
- − Management
- −$1,204
- − Depreciation
- −$1,452
- Taxable income
- $7,012
- Est. tax owed @ 24.0%
- −$1,683
- After-tax cash flow
- $5,683/yr
For passive investors: Depreciation is non-cash, so a rental often shows a tax loss while cash-flowing — sheltering income. Rental losses are passive: they offset passive income freely, and up to $25,000/yr can offset ordinary (W-2) income if you actively participate and your MAGI is under $100k (phasing out to $0 by $150k); unused losses carry forward. On sale, claimed depreciation is recaptured at up to 25%, and gains may owe capital-gains tax (a 1031 exchange can defer both). Figures are a year-1 estimate at your 24.0% rate — not tax advice; consult a CPA.
Schools (NCES district)
- District
- Pasco
- NCES district ID
- 1201530
- Math proficiency
- 50% ▼ -10.00%
- Reading proficiency
- 52% ▼ -5.00%
- Median HH income
- $45,039
- Composite
- 43.14/100
- National rank
- #3074
- State rank
- #32 of 73 in FL
Livability — Holiday
- Score
- 66/100
- State rank
- #623
- US rank
- #12124
Category grades
Schools grade is shown separately in the Schools card above.
Census & demographics
- Census place
- Holiday, FL
- County
- Pasco County · 524,098 people
- City population
- 33,730
- Metro
- Tampa-St. Petersburg-Clearwater, FL
- Population (ZIP)
- 21,232
- Household income
- $50,288
- Rent vs Own
- Severe rent burden
- 1031.0
Population outlook (Pasco County) Hauer SSP2
- Today (2025)
- 570,045 people
- By 2030
- 605,844 · +6.3%
- By 2040
- 674,806 · +18.4%
- By 2050
- 736,022 · +29.1%
- By 2075
- 862,900 · +51.4%
- By 2100
- 906,364 · +59.0%
Race, ethnicity, and origin ACS 2023
- Neighborhood character
- Predominantly White (73%)
- Race & ethnicity
- White 73% Hispanic / Latino 15% Two or more races 11% Black 7% Asian 2%
- Hispanic origin (detail)
- Mexican 2% Puerto Rican 6% Cuban 2% Dominican 2%
- Common ancestry
- Romanian 3% Iranian 2% Lithuanian 2%
- Foreign-born
- 10% · Canada, Vietnam
- Languages at home
- 82% English-only · Spanish 8% Other Indo-European 5% Other Asian/Pacific 1%
Political lean MEDSL · Pasco
- 2024 margin
- Strong R (+25.2) · D 36.9% · R 62.1% · Other 1.0%
- 2008→2024 swing
- -21.6pp toward R · 2008: -3.6pp · 2024: -25.2pp
- All cycles
- 2024: R+25.2 2020: R+20.1 2016: R+21.6 2012: R+6.7 2008: R+3.6
Not yet ingested
- Civics
- —
Market trends
- HPI YoY
- ▼ -102.84%
- Current HPI
- 326.9843
- Rent YoY
- ▲ 2.05%
- Metro
- Tampa-St. Petersburg-Clearwater, FL
- State GDP YoY
- ▲ 3.28%
- F500 in state
- 36
Industry mix (Fortune 500 HQ in FL)
| Industry | F500 HQs | Revenue |
|---|---|---|
| Industrial Technology | 2 | $29B |
|
||
| Insurance | 2 | $17B |
|
||
| Retail | 1 | $60B |
|
||
| Technology Distribution | 1 | $58B |
|
||
| Homebuilding | 1 | $35B |
|
||
| Technology Manufacturing | 1 | $35B |
|
||
Price history
+66.9% since first listed3 events — show timeline
- 2026-05-19 Listed $49,900 Stellar MLS as Distributed by MLS Grid
- 2005-05-06 Sold (MLS) $26,500 Stellar MLS as Distributed by MLS Grid
- 2005-03-25 Listed $29,900 Stellar MLS as Distributed by MLS Grid
Property tax history
+10.1%/yrLatest (2025): $1,138 · +1.0% YoY. Source: county tax records.
Cash-flow waterfall
monthlySold comps — $/sqft
last 12 mo · ≤1 miLoading sold comps…