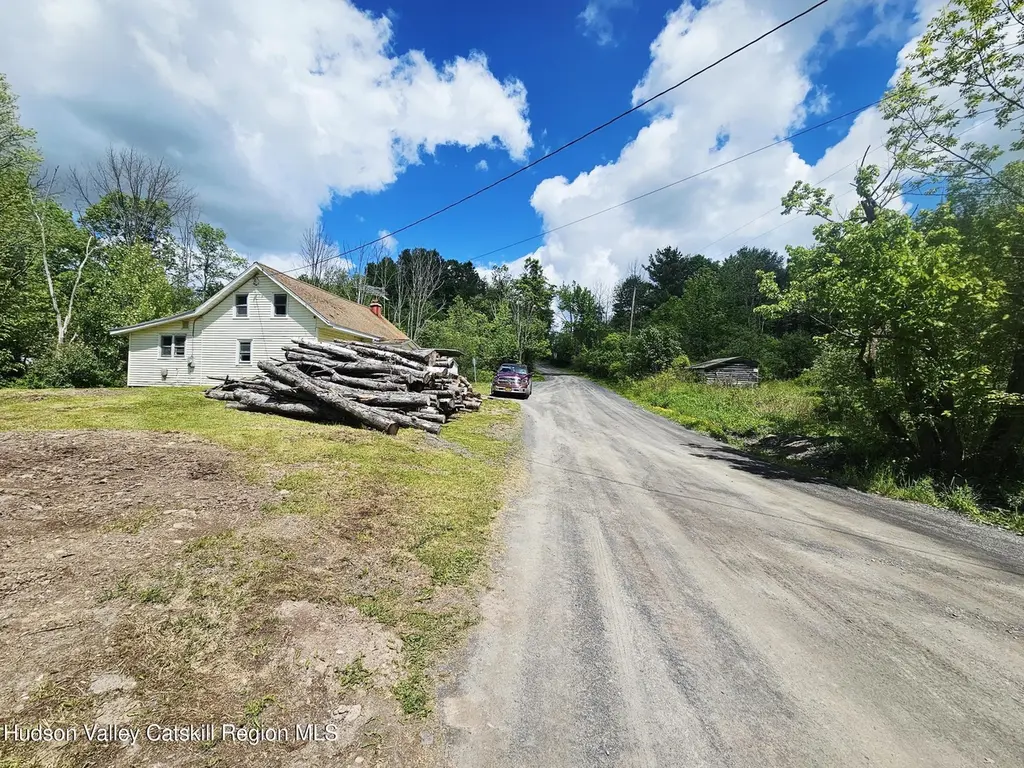
143 Gulf Rd · Preston-Potter Hollow, NY
Flood risk 9/10 · Severe
- FEMA flood zone
- X (unshaded)
- Chance of flooding over 30 yrs
- 0.99%
- Est. flood insurance / yr
- $507 – $1,088
Fire risk 1/10 · Minimal
- Est. fire insurance / yr
- $691 – $1,283
Heat risk 1/10 · Minimal
- Hot days now (above 88°F)
- 7 days/yr
- Hot days in 30 yrs
- 16 days/yr
Wind risk 2/10 · Minimal
- Chance of severe wind over 30 yrs
- 3.0%
Air-quality risk 1/10 · Minimal
- Unhealthy air days now
- 0 days/yr
- Unhealthy air days in 30 yrs
- 0 days/yr
Risk factors via First Street. Map © Google.
Why this score? — see what drove the C+ grade
The composite is a weighted blend of 9 inputs, each scored 0–100. Each bar is that input's sub-score; the figure is the points it added to the 100-point composite (weight × sub-score).
- Cash flow +22.4/30.0
- ARV discount +7.5/15.0
- DSCR +7.2/10.0
- Appreciation +7.1/10.0
- 1% rule +5.9/10.0
- Schools +4.2/10.0
- Rent growth +2.5/5.0
- Livability +2.5/5.0
- Condition / age +1.0/5.0
$139,000
🖨 Deal sheet 📄 Offer letter ✓ Due diligence
Listing remarks
Bring your tool belt and your vision 143 Gulf Road has just hit the market! Tucked away where privacy, nature, and country charm come together, this unique property offers an opportunity that's becoming harder and harder to find. Situated on 3.11 acres at the corner of Gulf Road and Gulf Road Extension, this peaceful setting is surrounded by nature and bordered by state land, creating a secluded retreat with room to explore, hunt, hike, and enjoy the outdoors right from your doorstep. The property features a charming cottage with improvements already started, giving the next owner a head start on transforming it into a cozy country getaway, hunting camp, weekend retreat, or year-round resid
Key facts
- 3.11 acres
- Secluded retreat
- Picturesque stream
Tags
Property features AI
Exterior
- Parking: Off-street parking
- Utilities: Private well water; Septic tank; 150 amp electrical service
- Home design: Single-family house; One level
- Construction: Wood siding; Asphalt shingle roof; Block, raised foundation; Built as a house (single family residence)
- Exterior features: Corner, level, private and wooded lot; Private maintained road; Barn on property; Has a view
Interior
- Flooring: Laminate; Vinyl; Wood
- Bathrooms: 1 full bathroom
- Heating & cooling: Propane heating; Wood heating; No central cooling
- Interior features: Laminate, vinyl and wood flooring; Basement with exterior entry
Neighborhood map
What this means for you Summary
Snapshot
- This is a 3-bed/1.0-bath single-family listed at $139k. Condition is rated poor.
Deal economics
- At list price, monthly cash flow is $165 ($2k/yr) — positive.
- The deal already cash-flows at list — no discount required.
- Meets the 1% rule at list price ($2k rent vs $139k).
- Recommended offer: $137k (1.5% below list) — sets the bar for market timing.
- Cap rate 8.3% vs local median 2.1% in Preston-Potter Hollow — top-decile yield for the area; either an underpriced asset or a hidden risk that comps aren't pricing in. Stress-test before assuming the spread holds.
Location & tenants
- Location reads: area grade C — affects rentability + tenant quality, not the cash-flow math above.
- Middleburgh Central School District (rural): math 44% / reading 54% proficiency, ranked #409 of 590 in NY (top 69%) — families likely to look elsewhere, expect single-tenant / working-renter base with shorter leases.
- Market conditions: 12 active listings in the ZIP; 675 units permitted in Albany County in 2024 (451 in 5+ unit buildings).
Forward outlook
- In year one you build about $7k of equity ($961 loan paydown + $6k appreciation (4.2% local appreciation)).
- Albany County population projected at +9% by 2050 — modest demand growth; plan on rents tracking national, not racing it.
- At projected returns (4.2% appreciation + 3.0% rent growth), your $39k cash investment doubles in ~5 years — after that, you're playing with house money.
- By year 6, paydown + projected appreciation supports a ~$36k cash-out refi (75% LTV) — recoverable capital for the next deal without selling this one.
Negotiation context
- It's been on market 15 days — a 2% lower offer ($137k) is reasonable based on typical stale-listing flexibility.
Risks & watch-outs
- Watch-outs: flood insurance adds $66/mo; built in 1885 — expect roof / HVAC / electrical / plumbing capex.
- Climate carrying-cost: severe flood risk — expect insurance premiums to compound above CPI over the hold.
Questions for the listing agent
- Have any recent inspections been done? Can we get a copy of the seller's disclosures and any deferred-maintenance estimates?
- Built in 1885 — when were the roof, HVAC, electrical panel, plumbing, and water heater last replaced?
- What's the actual annual flood-insurance premium (NFIP or private), and is the property in a SFHA with mandatory coverage?
- Is there a deadline driving the sale (1031 exchange, divorce, estate, relocation)? That informs how much negotiation room exists.
- What's the average days-on-market for RENTAL listings here right now (not sales)? A rising rental-DOM trend means longer vacancies and softer asking-rent achievability than the comps imply.
- What's the recent tenant-quality profile in this submarket — average credit score on applications, eviction rate, late-payment / NSF rate, and stable-employment percentage? A property-management company in the area should have these aggregated.
- How much new for-sale + rental construction is in the pipeline within 1–3 miles? Heavy new supply typically softens prices + rents 12–24 months out; constrained supply supports both.
Investment metrics
- 1% rule
- 1.09% ✓
- Cap rate
- 8.29%
- Cash-on-cash
- 7.13%
- DSCR
- 1.32
- GRM
- 7.7
CMA / ARV
No comps found within radius.
Projected returns pro-forma
4.15% appreciation · 3.0% rent growth · sell at horizon
- IRR
- 15.2%
- Equity multiple
- 1.92×
- Total profit
- $35,932
- Equity at exit
- $71,671
- IRR
- 16.2%
- Equity multiple
- 3.65×
- Total profit
- $103,171
- Equity at exit
- $118,189
Cash invested: $38,920 (down + closing). Projections, not guarantees.
Landlord ↔ Tenant lean methodology
- Overall (STATE)
- 15 Strongly Tenant-Friendly
- State New York
- 15 Strongly Tenant-Friendly · D+10
- County
- — inherits STATE
- City
- — inherits STATE
ZIP-level market 12147
- Home prices YoY
- 1.4%
- Active inventory
- 12
- Price-to-rent
- 7.7×
Monthly cashflow live
- Estimated rent
- $1,509 medium interval (Pro) →
- Mortgage (P&I)
- −$729
- Tax est. 1.5%
- −$174 /mo · $2,085/yr
- Insurance
- −$58
- Flood insurance flood zone
- −$66 /mo · $798/yr
- HOA
- −$0
- Vacancy / Maint / Mgmt
- −$317
- Net cashflow
- $165
Break-even live
UW: 25.0% down · 7.5% · 30yr · 1.5% tax · 5.0% vac · 8.0% maint · 8.0% mgmt
Financing live
Cash to close
- Down payment
- $34,750
- Closing costs
- $4,170
- Reserves months
- —
- Total cash needed
- —
Loan-product check · same deal, 3 products live
Conventional
25% down · 7.5% · 30yr
- Down + closing
- —
- Monthly P&I
- —
- Monthly cashflow
- —
- DSCR
- —
- Eligible?
- —
Personal DTI + credit; lowest rate.
DSCR
20% down · 8.5% · 30yr
- Down + closing
- —
- Monthly P&I
- —
- Monthly cashflow
- —
- DSCR
- —
- Eligible?
- —
No personal income docs; deal must DSCR.
Hard money
10% down · 12.0% · 12mo
- Down + closing
- —
- Monthly P&I
- —
- Monthly cashflow
- —
- DSCR
- —
- Eligible?
- —
Short-term bridge; refi at stabilization.
Listing history 12 events
-
2026-06-18days on market $139,000 Active 15 DOM
-
2026-06-17days on market $139,000 Active 14 DOM
-
2026-06-16days on market $139,000 Active 13 DOM
-
2026-06-15days on market $139,000 Active 12 DOM
-
2026-06-13days on market $139,000 Active 10 DOM
-
2026-06-12days on market $139,000 Active 9 DOM
-
2026-06-09days on market $139,000 Active 6 DOM
-
2026-06-08days on market $139,000 Active 5 DOM
-
2026-06-07days on market $139,000 Active 4 DOM
-
2026-06-07days on market $139,000 Active 3 DOM
-
2026-06-04remarks 699-char remark
-
2026-06-04$139,000 Active 1 DOM
ⓘ Source: listings_history table (triggers on properties + properties_extension) + one-shot
backfill from property_details.listing_events for pre-trigger history.
Climate risk First Street
- Flood 9/10 Extreme FEMA zone X (unshaded) · 99% chance over 30 yrs
- Wildfire 1/10 Low
- Heat 1/10 Low 7 d/yr ≥88°F today · 16 d/yr by 30 yrs out
- Wind 2/10 Low 3% chance of damaging wind over 30 yrs
- Air quality 1/10 Low 0 unhealthy d/yr today · 0 by 30 yrs out
Nearby sold comps map
Loading sold comps map…
Walkable amenities ~0.75 mi
Loading nearby amenities…
Taxation est. · year 1
- Rental income
- $18,106
- − Mortgage interest
- −$7,786
- − Property taxes
- −$2,085
- − Insurance
- −$1,492
- − Repairs & maintenance
- −$1,448
- − Management
- −$1,448
- − Depreciation
- −$4,044
- Taxable loss
- −$198
- Est. tax savings @ 24.0%
- +$48
- After-tax cash flow
- $2,026/yr
For passive investors: Depreciation is non-cash, so a rental often shows a tax loss while cash-flowing — sheltering income. Rental losses are passive: they offset passive income freely, and up to $25,000/yr can offset ordinary (W-2) income if you actively participate and your MAGI is under $100k (phasing out to $0 by $150k); unused losses carry forward. On sale, claimed depreciation is recaptured at up to 25%, and gains may owe capital-gains tax (a 1031 exchange can defer both). Figures are a year-1 estimate at your 24.0% rate — not tax advice; consult a CPA.
Condition & rehab AI · 13 photos
This property requires extensive repairs and updates to bring it up to a livable condition. Significant structural and safety issues are present, and improvements are needed in multiple areas to increase its resale and rental value.
Repairs flagged
- Major Exposed beams in kitchen — Structural damage and safety hazard.
- Major Exposed plumbing in bath — Risk of water damage and potential leaks.
- Major Damaged shingles on roof — Leakage and potential structural issues.
- Major Peeling siding — Structural integrity and weather resistance compromised.
- Major Missing windows — Safety and security concerns.
- Major Exposed subflooring in kitchen and living area — Structural damage and safety hazard.
- Major Paint peeling and exposed drywall — Structural integrity and safety hazard.
- Major Exposed ductwork and missing components — Safety and functionality concerns.
- Major Overgrown vegetation — Safety and property value concerns.
Value-add opportunities
- Resale Re-roofing and siding repair — Improves structural integrity and safety.
- Resale Interior repairs and updates — Enhances living space and safety.
- Resale HVAC system replacement — Improves comfort and energy efficiency.
- Both Landscaping and curb appeal improvements — Enhances property value and appeal.
- Resale Kitchen and bath updates — Enhances living space and functionality.
- Resale Windows and door replacements — Improves safety and energy efficiency.
- Resale Interior drywall and paint repairs — Enhances living space and safety.
- Resale HVAC system replacement — Improves comfort and energy efficiency.
- Both Landscaping and curb appeal improvements — Enhances property value and appeal.
Renovation cost estimate screening
| Repair item | Severity | Est. cost |
|---|---|---|
| Exposed beams in kitchen · Structural damage and safety hazard. | Major | $15,000–50,000 |
| Exposed plumbing in bath · Risk of water damage and potential leaks. | Major | $15,000–50,000 |
| Damaged shingles on roof · Leakage and potential structural issues. | Major | $15,000–50,000 |
| Peeling siding · Structural integrity and weather resistance compromised. | Major | $15,000–50,000 |
| Missing windows · Safety and security concerns. | Major | $15,000–50,000 |
| Exposed subflooring in kitchen and living area · Structural damage and safety hazard. | Major | $15,000–50,000 |
| Paint peeling and exposed drywall · Structural integrity and safety hazard. | Major | $15,000–50,000 |
| Exposed ductwork and missing components · Safety and functionality concerns. | Major | $15,000–50,000 |
| Overgrown vegetation · Safety and property value concerns. | Major | $15,000–50,000 |
| Total estimated repair cost · 9 items | $135,000–450,000 |
Value-add ROI direction
- Resale Re-roofing and siding repair — Improves structural integrity and safety. ↑
- Resale Interior repairs and updates — Enhances living space and safety. ↑
- Resale HVAC system replacement — Improves comfort and energy efficiency. ↑
- Both Landscaping and curb appeal improvements — Enhances property value and appeal. ↑
- Resale Kitchen and bath updates — Enhances living space and functionality. ↑
- Resale Windows and door replacements — Improves safety and energy efficiency. ↑
- Resale Interior drywall and paint repairs — Enhances living space and safety. ↑
- Resale HVAC system replacement — Improves comfort and energy efficiency. ↑
- Both Landscaping and curb appeal improvements — Enhances property value and appeal. ↑
ⓘ Cost ranges are severity-bucket heuristics (US national rule-of-thumb). Get contractor quotes + a written scope before underwriting a rehab budget.
Schools (NCES district)
- District
- Middleburgh Central School District
- NCES district ID
- 3619260
- Math proficiency
- 44% ▼ -11.00%
- Reading proficiency
- 54% ▲ 5.00%
- Median HH income
- $47,677
- Composite
- 41.7/100
- National rank
- #3412
- State rank
- #409 of 590 in NY
Livability — Preston-Potter Hollow
No livability data for this city. (Only ~50 U.S. cities are tracked.)
Census & demographics
- City population
- 842
- Population (ZIP)
- 508
Population outlook (Albany County) Hauer SSP2
- Today (2025)
- 320,794 people
- By 2030
- 327,401 · +2.1%
- By 2040
- 338,218 · +5.4%
- By 2050
- 348,467 · +8.6%
- By 2075
- 381,693 · +19.0%
- By 2100
- 393,809 · +22.8%
Race, ethnicity, and origin ACS 2023
- Neighborhood character
- Predominantly White (96%)
- Race & ethnicity
- White 96% Asian 3%
- Common ancestry
- Subsaharan African 24% Danish 5% Romanian 5%
- Foreign-born
- 20% · China, Vietnam
- Languages at home
- 81% English-only · Russian/Polish/Slavic 16% Other Indo-European 2%
Political lean MEDSL · Albany
- 2024 margin
- Strong D (+25.8) · D 62.9% · R 37.1%
- 2008→2024 swing
- -3.6pp toward R · 2008: 29.4pp · 2024: 25.8pp
- All cycles
- 2024: D+25.8 2020: D+31.4 2016: D+24.3 2012: D+31.0 2008: D+29.4
Not yet ingested
- Civics
- —
Market trends
- HPI YoY
- ▲ 4.15%
- Current HPI
- 307.8963
- Rent YoY
- —
- Metro
- —
- State GDP YoY
- ▲ 2.60%
- F500 in state
- 92
Industry mix (Fortune 500 HQ in NY)
| Industry | F500 HQs | Revenue |
|---|---|---|
| Financial Services | 10 | $950B |
|
||
| Consumer Goods | 9 | $162B |
|
||
| Insurance | 4 | $225B |
|
||
| Telecommunications | 2 | $144B |
|
||
| Pharmaceuticals | 2 | $112B |
|
||
| Media / Entertainment | 2 | $69B |
|
||
Price history
1 event — show timeline
- 2026-06-02 Listed $139,000 HVCRMLS
Cash-flow waterfall
monthlySold comps — $/sqft
last 12 mo · ≤1 miLoading sold comps…