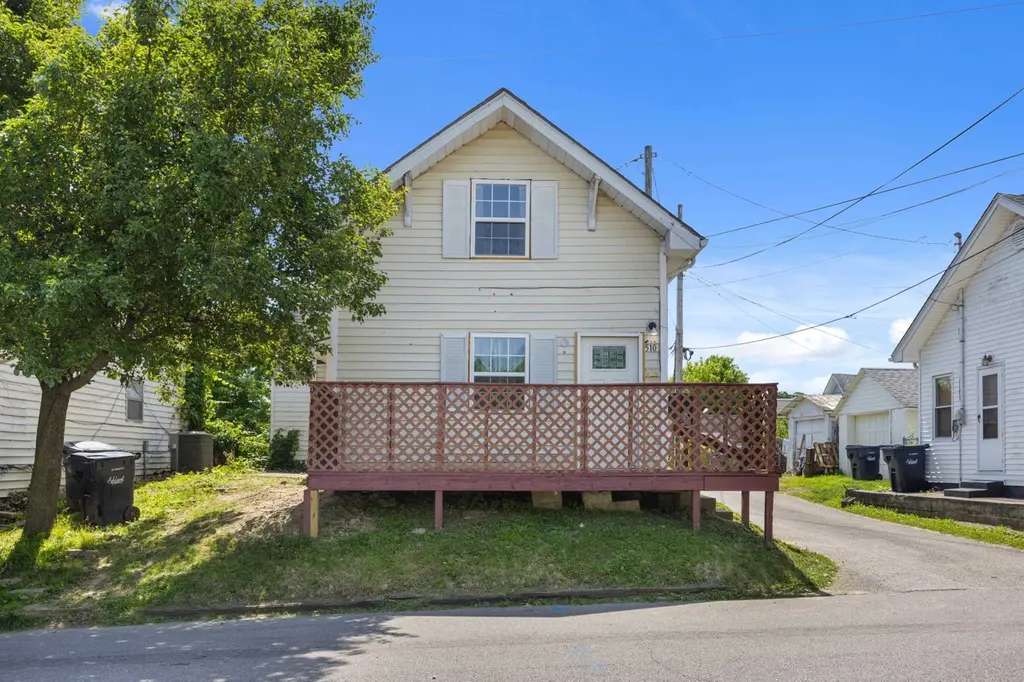
510 8th Street St · Ashland, KY
Flood risk 1/10 · Minimal
- FEMA flood zone
- X (unshaded)
- Chance of flooding over 30 yrs
- 0.0%
- Est. flood insurance / yr
- $507 – $1,088
Fire risk 2/10 · Minimal
- Est. fire insurance / yr
- $839 – $1,559
Heat risk 5/10 · Moderate
- Hot days now (above 102°F)
- 7 days/yr
- Hot days in 30 yrs
- 20 days/yr
Wind risk 2/10 · Minimal
- Chance of severe wind over 30 yrs
- 2.0%
Air-quality risk 2/10 · Minimal
- Unhealthy air days now
- 0 days/yr
- Unhealthy air days in 30 yrs
- 2 days/yr
Risk factors via First Street. Map © Google.
Why this score? — see what drove the B- grade
The composite is a weighted blend of 9 inputs, each scored 0–100. Each bar is that input's sub-score; the figure is the points it added to the 100-point composite (weight × sub-score).
- Cash flow +30.0/30.0
- DSCR +10.0/10.0
- 1% rule +8.5/10.0
- ARV discount +7.5/15.0
- Schools +3.2/10.0
- Livability +3.2/5.0
- Rent growth +2.5/5.0
- Condition / age +2.5/5.0
- Appreciation +0.0/10.0
$89,000
🖨 Deal sheet 📄 Offer letter ✓ Due diligence
Listing remarks
Looking for an affordable home, investment property or potential short term rental opportunity? This charming home offers low-maintenance living in a convenient location within walking distance of the Ashland City Pool at Dawson Park, Ashland Town Center, shopping, dining, and other everyday amenities. Step inside to find fresh paint, laminate flooring, and new carpet throughout the entire home. The main level features a comfortable living room, bedroom, and a convenient laundry room with an exterior access door. The eat-in kitchen has been refreshed with new cabinets, countertops, and a new stove, creating a functional and inviting space for everyday meals. Upstairs offers a vaulted-ceilin
Key facts
- New stove
- New cabinets
- New countertops
Tags
Property features AI
Exterior
- Parking: No dedicated parking
- Utilities: Public water; Public sewer
- Home design: Single-family residence; One story; Residential property
- Construction: Vinyl siding; Block foundation; Composition roof; 831 above-grade finished area
- Exterior features: Front porch; Level lot
Interior
- Kitchen: Electric range
- Bathrooms: 1 full bathroom
- Heating & cooling: Baseboard heating
- Interior features: Electric range; Electric water heater; Total of 4 rooms
- Laundry & utility: Electric water heater
Neighborhood map
What this means for you Summary
Snapshot
- This is a 2-bed/1.0-bath single-family listed at $89k.
Deal economics
- At list price, monthly cash flow is $433 ($5k/yr) — positive.
- The deal already cash-flows at list — no discount required.
- Meets the 1% rule at list price ($1k rent vs $89k).
- Cap rate 12.1% vs local median 5.4% in Ashland — top-decile yield for the area; either an underpriced asset or a hidden risk that comps aren't pricing in. Stress-test before assuming the spread holds.
Location & tenants
- Location reads 64/100 on livability (#304 in KY) — a middle-class / working-renter tenant base. Strengths: cost of living A+, housing A+; Watch: schools C-, amenities F, commute F.
- Ashland Independent (urban): math 32% / reading 44% proficiency, ranked #49 of 165 in KY (top 30%) — families likely to look elsewhere, expect single-tenant / working-renter base with shorter leases.
- Market conditions: 100 active listings in the ZIP; 1 comparable units currently listed for rent nearby; 2 units permitted in Boyd County in 2024 (0 in 5+ unit buildings).
Forward outlook
- Local home prices are declining (-3.0%/yr); year-one equity from $615 of loan paydown is wiped out by about $3k of value loss. Plan a longer hold.
- Boyd County population projected at -17% by 2050 — secular population decline; favor cash flow + early exit over multi-decade hold.
- At projected returns (-3.0% appreciation + 3.0% rent growth), your $25k cash investment doubles in ~6 years — after that, you're playing with house money.
Negotiation context
- Only 12 days on market — expect competitive offers; lowballing is unlikely to land.
Risks & watch-outs
- Climate carrying-cost: extreme-heat days projected 7→20/yr by 2055 (HVAC capex compounding) — expect insurance premiums to compound above CPI over the hold.
Questions for the listing agent
- Is there a deadline driving the sale (1031 exchange, divorce, estate, relocation)? That informs how much negotiation room exists.
- What's the average days-on-market for RENTAL listings here right now (not sales)? A rising rental-DOM trend means longer vacancies and softer asking-rent achievability than the comps imply.
- What's the recent tenant-quality profile in this submarket — average credit score on applications, eviction rate, late-payment / NSF rate, and stable-employment percentage? A property-management company in the area should have these aggregated.
- How much new for-sale + rental construction is in the pipeline within 1–3 miles? Heavy new supply typically softens prices + rents 12–24 months out; constrained supply supports both.
Investment metrics
- 1% rule
- 1.35% ✓
- Cap rate
- 12.13%
- Cash-on-cash
- 20.85%
- DSCR
- 1.93
- GRM
- 6.2
CMA / ARV
No comps found within radius.
Projected returns pro-forma
-3.0% appreciation · 3.0% rent growth · sell at horizon
- IRR
- 13.2%
- Equity multiple
- 1.53×
- Total profit
- $13,114
- Equity at exit
- $13,270
- IRR
- 22.0%
- Equity multiple
- 2.88×
- Total profit
- $46,762
- Equity at exit
- $7,695
Cash invested: $24,920 (down + closing). Projections, not guarantees.
Landlord ↔ Tenant lean methodology
- Overall (STATE)
- 83 Strongly Landlord-Friendly
- State Kentucky
- 83 Strongly Landlord-Friendly · R+16
- County
- — inherits STATE
- City
- — inherits STATE
ZIP-level market 41101
- Active inventory
- 100
- Price-to-rent
- 6.2×
Monthly cashflow live
- Estimated rent
- $1,205 medium interval (Pro) →
- Mortgage (P&I)
- −$467
- Tax from tax record
- −$15 /mo · $182/yr
- Insurance
- −$37
- HOA
- −$0
- Vacancy / Maint / Mgmt
- −$253
- Net cashflow
- $433
Break-even live
UW: 25.0% down · 7.5% · 30yr · 1.5% tax · 5.0% vac · 8.0% maint · 8.0% mgmt
Financing live
Cash to close
- Down payment
- $22,250
- Closing costs
- $2,670
- Reserves months
- —
- Total cash needed
- —
Loan-product check · same deal, 3 products live
Conventional
25% down · 7.5% · 30yr
- Down + closing
- —
- Monthly P&I
- —
- Monthly cashflow
- —
- DSCR
- —
- Eligible?
- —
Personal DTI + credit; lowest rate.
DSCR
20% down · 8.5% · 30yr
- Down + closing
- —
- Monthly P&I
- —
- Monthly cashflow
- —
- DSCR
- —
- Eligible?
- —
No personal income docs; deal must DSCR.
Hard money
10% down · 12.0% · 12mo
- Down + closing
- —
- Monthly P&I
- —
- Monthly cashflow
- —
- DSCR
- —
- Eligible?
- —
Short-term bridge; refi at stabilization.
Rent comps 1 comps
| Address | Beds | Baths | Sqft | Rent | $/sqft | DOM | Units | Dist |
|---|---|---|---|---|---|---|---|---|
| 200 Providence Hill Dr Ashland, KY | 1.0–3.0 | 1.0–2.0 | 1100 | $1,205 | $1.10 | 2d | 1 | 0.81mi |
Listing history 10 events
-
2026-06-18days on market $89,000 Active 12 DOM
-
2026-06-17days on market $89,000 Active 11 DOM
-
2026-06-16days on market $89,000 Active 10 DOM
-
2026-06-15days on market $89,000 Active 9 DOM
-
2026-06-13days on market $89,000 Active 7 DOM
-
2026-06-12days on market $89,000 Active 6 DOM
-
2026-06-09days on market $89,000 Active 3 DOM
-
2026-06-08days on market $89,000 Active 2 DOM
-
2026-06-07remarks 699-char remark
-
2026-06-07$89,000 Active 1 DOM
ⓘ Source: listings_history table (triggers on properties + properties_extension) + one-shot
backfill from property_details.listing_events for pre-trigger history.
Tax reassessment forecast KY · Resets to sale price
- Current annual tax
- $182 · $15/mo
- Projected year-2 tax
- $765 · $64/mo
- Expected delta
- +$583/yr (+$49/mo · 320.6%)
ⓘ Screening estimate from a state-policy table — verify with the county assessor before closing.
Climate risk First Street
- Flood 1/10 Low FEMA zone X (unshaded) · 0% chance over 30 yrs
- Wildfire 2/10 Low
- Heat 5/10 Major 7 d/yr ≥102°F today · 20 d/yr by 30 yrs out
- Wind 2/10 Low 2% chance of damaging wind over 30 yrs
- Air quality 2/10 Low 0 unhealthy d/yr today · 2 by 30 yrs out
Nearby sold comps map
Loading sold comps map…
Walkable amenities ~0.75 mi
Loading nearby amenities…
Taxation est. · year 1
- Rental income
- $14,460
- − Mortgage interest
- −$4,985
- − Property taxes
- −$182
- − Insurance
- −$445
- − Repairs & maintenance
- −$1,157
- − Management
- −$1,157
- − Depreciation
- −$2,589
- Taxable income
- $3,945
- Est. tax owed @ 24.0%
- −$947
- After-tax cash flow
- $4,249/yr
For passive investors: Depreciation is non-cash, so a rental often shows a tax loss while cash-flowing — sheltering income. Rental losses are passive: they offset passive income freely, and up to $25,000/yr can offset ordinary (W-2) income if you actively participate and your MAGI is under $100k (phasing out to $0 by $150k); unused losses carry forward. On sale, claimed depreciation is recaptured at up to 25%, and gains may owe capital-gains tax (a 1031 exchange can defer both). Figures are a year-1 estimate at your 24.0% rate — not tax advice; consult a CPA.
Schools (NCES district)
- District
- Ashland Independent
- NCES district ID
- 2100150
- Math proficiency
- 32% ▼ -16.00%
- Reading proficiency
- 44% ▼ -15.00%
- Median HH income
- $36,579
- Composite
- 31.51/100
- National rank
- #5971
- State rank
- #49 of 165 in KY
Livability — Ashland
- Score
- 64/100
- State rank
- #304
- US rank
- #14462
Category grades
Schools grade is shown separately in the Schools card above.
Census & demographics
- Census place
- Ashland, KY
- City population
- 19,331
- Population (ZIP)
- 19,331
Population outlook (Boyd County) Hauer SSP2
- Today (2025)
- 46,137 people
- By 2030
- 44,585 · -3.4%
- By 2040
- 41,442 · -10.2%
- By 2050
- 38,313 · -17.0%
- By 2075
- 31,077 · -32.6%
- By 2100
- 23,432 · -49.2%
Race, ethnicity, and origin ACS 2023
- Neighborhood character
- Predominantly White (89%)
- Race & ethnicity
- White 89% Two or more races 5% Hispanic / Latino 3% Black 2% Asian 1%
- Common ancestry
- Serbian 3% Slovak 2% Italian 2%
- Foreign-born
- 2% · Canada
- Languages at home
- 96% English-only · Spanish 2%
Political lean MEDSL · Boyd
- 2024 margin
- Solid R (+38.5) · D 30.0% · R 68.6% · Other 1.4%
- 2008→2024 swing
- -26.2pp toward R · 2008: -12.3pp · 2024: -38.5pp
- All cycles
- 2024: R+38.5 2020: R+33.2 2016: R+37.0 2012: R+16.3 2008: R+12.3
Not yet ingested
- Civics
- —
Market trends
- HPI YoY
- ▼ -81.83%
- Current HPI
- 148.0076
- Rent YoY
- —
- Metro
- —
- State GDP YoY
- ▲ 1.81%
- F500 in state
- 4
Industry mix (Fortune 500 HQ in KY)
| Industry | F500 HQs | Revenue |
|---|---|---|
| Healthcare | 1 | $118B |
|
||
| Food / Beverage | 1 | $7B |
|
||
Price history
1 event — show timeline
- 2026-06-06 Listed $89,000 AABOR
Property tax history
+2.0%/yrLatest (2025): $182 · -1.0% YoY. Source: county tax records.
Cash-flow waterfall
monthlySold comps — $/sqft
last 12 mo · ≤1 miLoading sold comps…