 🔨 Auction
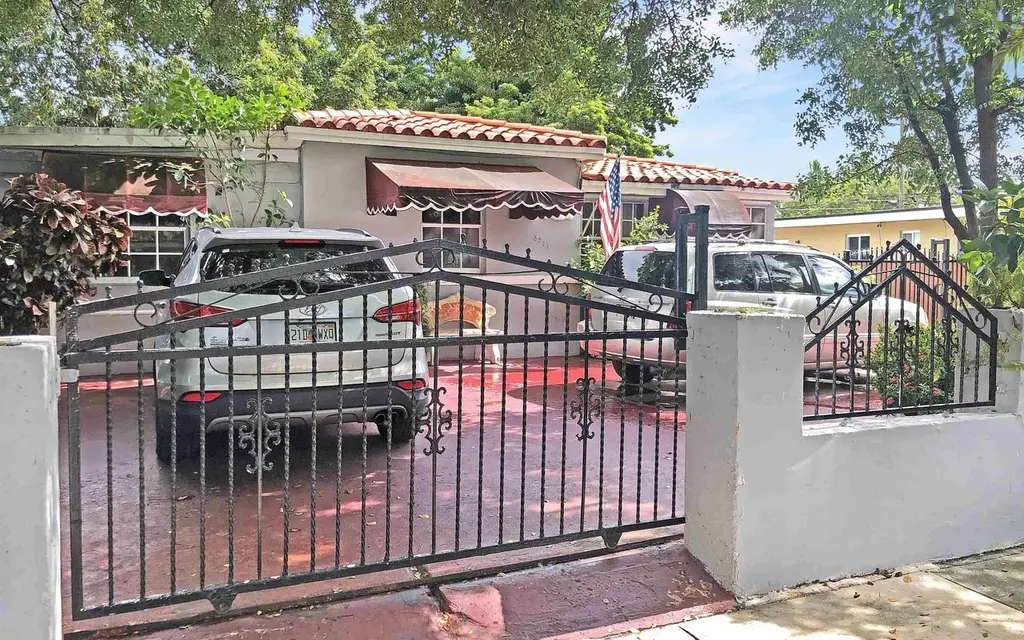
3911 NW 2nd St · Miami, FL
Flood risk 1/10 · Minimal
- FEMA flood zone
- X (unshaded)
- Chance of flooding over 30 yrs
- 0.0%
- Est. flood insurance / yr
- $507 – $1,088
Fire risk 1/10 · Minimal
- Est. fire insurance / yr
- $947 – $1,759
Heat risk 10/10 · Severe
- Hot days now (above 104°F)
- 4 days/yr
- Hot days in 30 yrs
- 15 days/yr
Wind risk 10/10 · Severe
- Chance of severe wind over 30 yrs
- 99.0%
Air-quality risk 2/10 · Minimal
- Unhealthy air days now
- 1 days/yr
- Unhealthy air days in 30 yrs
- 1 days/yr
Risk factors via First Street. Map © Google.
Why this score? — see what drove the F grade
The composite is a weighted blend of 9 inputs, each scored 0–100. Each bar is that input's sub-score; the figure is the points it added to the 100-point composite (weight × sub-score).
- ARV discount +7.5/15.0
- Schools +4.2/10.0
- Livability +3.9/5.0
- Condition / age +2.5/5.0
- Rent growth +1.4/5.0
- Cash flow +0.3/30.0
- 1% rule +0.0/10.0
- DSCR +0.0/10.0
- Appreciation +0.0/10.0
$5,000
🖨 Deal sheet (PDF) 📄 Offer letter ✓ Due diligence
Listing remarks
Foreclosure Auction Ends June 17, 2026 at 9:00 AM EST. Explore this charming 2-bedroom, 1-bath residence set in a peaceful and well-located Miami community. The list price is the opening bid for the online auction. Sold As-is. Explore more details and submit your bid through Federa.
Key facts
- Garage
- Listed 8 days
Property features AI
Finance
- Other: Directions: Near Flagler St and S Le Jeune
Exterior
- Parking: Detached or attached garage with space for 1 car
- Home design: Residential property; One-story
- Exterior features: Lot approximately 0.16 acres; Zoning: 0100
Interior
- Bathrooms: One full bathroom
- Interior features: Single-story layout
Neighborhood map
What this means for you Summary
Snapshot
- This is a 2-bed/1.0-bath single-family listed at $5k.
Deal economics
- At list price, monthly cash flow is $-3k ($-41k/yr) — negative.
- The deal already cash-flows at list — no discount required.
- Meets the 1% rule at list price ($2k rent vs $5k).
- Cap rate 1.0% vs local median 1.9% in Miami — below-typical yield; the buyer is paying a premium for something (appreciation thesis, condition, location) that the cap rate doesn't capture.
Location & tenants
- Location reads 78/100 on livability (#177 in FL, #2,724 nationally) — a middle-class / working-renter tenant base. Strengths: amenities A+, commute A+, health & safety A+; Watch: employment C-, crime F, cost of living F.
- Miami-Dade (suburban): math 45% / reading 54% proficiency, ranked #40 of 73 in FL (top 55%) — families likely to look elsewhere, expect single-tenant / working-renter base with shorter leases; 64% free/reduced lunch — lower-income household profile, screen leases tightly.
- Market conditions: Rents falling (-4.5%/yr); 196 active listings in the ZIP; 10,051 units permitted in Miami-Dade County in 2024 (7,758 in 5+ unit buildings).
- At $2,391/mo this rent would consume 49% of the median local household income ($58k/yr) (locally 3930% of renters already pay >50% of income on rent) — very limited rent-growth headroom before tenants either downsize or default.
Forward outlook
- Local home prices are declining (-3.0%/yr); year-one equity from $5k of loan paydown is wiped out by about $23k of value loss. Plan a longer hold.
- Miami-Dade County population projected at +28% by 2050 — long-run rental-demand tailwind backs the buy-and-hold thesis.
Negotiation context
- Only 8 days on market — expect competitive offers; lowballing is unlikely to land.
- 3 sale attempts since 2y ago with the ask held roughly flat each time — persistent listings suggest the price (not the market) is what's stuck; bring a comps-based counter.
Risks & watch-outs
- Watch-outs: property tax is 229.9% of price; built in 1946 — expect roof / HVAC / electrical / plumbing capex.
- Climate carrying-cost: severe wind risk, 99% chance of damaging wind over 30y; extreme-heat days projected 4→15/yr by 2055 (HVAC capex compounding) — expect insurance premiums to compound above CPI over the hold.
Questions for the listing agent
- What do current leases actually rent for vs. the listed asking? Can we see a recent rent roll and the last 12 months of T-12 income?
- Built in 1946 — when were the roof, HVAC, electrical panel, plumbing, and water heater last replaced?
- Property tax is high relative to price — has the assessment been appealed recently, and will the sale trigger a re-assessment?
- Is there a deadline driving the sale (1031 exchange, divorce, estate, relocation)? That informs how much negotiation room exists.
- Schools are B-rated — typically a magnet for longer-tenancy family renters. What's the average tenant stay here, and is there a school-zone premium baked into asking?
- Crime grade is F in this area — have there been break-ins, vandalism, or insurance claims at this property in the last 3 years? What carrier currently insures it and at what premium?
- The area grade is low — what's the realistic commute time and amenity access for the typical tenant pool here? Any planned neighborhood developments (good or bad) we should know about?
- What's the average days-on-market for RENTAL listings here right now (not sales)? A rising rental-DOM trend means longer vacancies and softer asking-rent achievability than the comps imply.
- What's the recent tenant-quality profile in this submarket — average credit score on applications, eviction rate, late-payment / NSF rate, and stable-employment percentage? A property-management company in the area should have these aggregated.
- How much new for-sale + rental construction is in the pipeline within 1–3 miles? Heavy new supply typically softens prices + rents 12–24 months out; constrained supply supports both.
Investment metrics
- 1% rule
- 0.31% ✗
- Cap rate
- 0.96%
- Cash-on-cash
- -19.06%
- DSCR
- 0.15
- GRM
- 26.7
CMA / ARV
- ARV (on-the-fly)
- $766,352
- Comps found
- 1
Show comp detail 1 sale within ~0.75 mi
| Address | Dist | Beds/Ba | Sqft | Sold | Price | $/sf | Match |
|---|---|---|---|---|---|---|---|
| 3921 SW 4th St | 0.36mi | 3/2.0 (+1) | 1,657 (-9%) | 23mo | $699,900 | $422 | 40 |
Match score weights: distance 35% · size 25% · config 20% · recency 20%. Top-matched comps best support the ARV.
Projected returns pro-forma
-3.0% appreciation · 0.0% rent growth · sell at horizon
- IRR
- -57.9%
- Equity multiple
- -0.62×
- Total profit
- $-348,179
- Equity at exit
- $114,266
- IRR
- —
- Equity multiple
- -1.84×
- Total profit
- $-609,573
- Equity at exit
- $66,260
Cash invested: $214,579 (down + closing). Projections, not guarantees.
Landlord ↔ Tenant lean methodology
- Overall (STATE)
- 87 Strongly Landlord-Friendly
- State Florida
- 87 Strongly Landlord-Friendly · R+3
- County
- — inherits STATE
- City
- — inherits STATE
ZIP-level market 33126
- Rents YoY
- -4.5%
- Active inventory
- 196
- Price-to-rent
- 0.2×
Monthly cashflow live
- Estimated rent
- $2,391 medium interval (Pro) →
- Mortgage (P&I)
- −$4,019
- Tax est. 1.5%
- −$958 /mo · $11,495/yr
- Insurance
- −$319
- HOA
- −$0
- Vacancy / Maint / Mgmt
- −$502
- Net cashflow
- $-3,408
Break-even live
Sensitivity live
| Price | -10% $-2,878 | -5% $-3,143 | +0% $-3,408 | +5% $-3,672 | +10% $-3,937 |
|---|---|---|---|---|---|
| Rent | -10% $-3,596 | -5% $-3,502 | +0% $-3,408 | +5% $-3,313 | +10% $-3,219 |
| Rate | -1.0pp $-3,022 | -0.5pp $-3,213 | base $-3,408 | +0.5pp $-3,606 | +1.0pp $-3,808 |
UW: 25.0% down · 7.5% · 30yr · 1.5% tax · 5.0% vac · 8.0% maint · 8.0% mgmt
Financing live
Cash to close
- Down payment
- $191,588
- Closing costs
- $22,991
- Reserves months
- —
- Total cash needed
- —
Loan-product check · same deal, 3 products live
Conventional
25% down · 7.5% · 30yr
- Down + closing
- —
- Monthly P&I
- —
- Monthly cashflow
- —
- DSCR
- —
- Eligible?
- —
Personal DTI + credit; lowest rate.
DSCR
20% down · 8.5% · 30yr
- Down + closing
- —
- Monthly P&I
- —
- Monthly cashflow
- —
- DSCR
- —
- Eligible?
- —
No personal income docs; deal must DSCR.
Hard money
10% down · 12.0% · 12mo
- Down + closing
- —
- Monthly P&I
- —
- Monthly cashflow
- —
- DSCR
- —
- Eligible?
- —
Short-term bridge; refi at stabilization.
Listing history 6 events
-
2026-06-17days on market $5,000 Active 8 DOM
-
2026-06-16days on market $5,000 Active 7 DOM
-
2026-06-15days on market $5,000 Active 6 DOM
-
2026-06-13days on market $5,000 Active 4 DOM
-
2026-06-10remarks 283-char remark
-
2026-06-10$5,000 Active 1 DOM
ⓘ Source: listings_history table (triggers on properties + properties_extension) + one-shot
backfill from property_details.listing_events for pre-trigger history.
Climate risk First Street
- Flood 1/10 Low FEMA zone X (unshaded) · 0% chance over 30 yrs
- Wildfire 1/10 Low
- Heat 10/10 Extreme 4 d/yr ≥104°F today · 15 d/yr by 30 yrs out
- Wind 10/10 Extreme 99% chance of damaging wind over 30 yrs
- Air quality 2/10 Low 1 unhealthy d/yr today · 1 by 30 yrs out
Nearby sold comps map
Loading sold comps map…
Walkable amenities ~0.75 mi
Loading nearby amenities…
Taxation est. · year 1
- Rental income
- $28,687
- − Mortgage interest
- −$42,928
- − Property taxes
- −$11,495
- − Insurance
- −$3,832
- − Repairs & maintenance
- −$2,295
- − Management
- −$2,295
- − Depreciation
- −$22,294
- Taxable loss
- −$56,451
- Est. tax savings @ 24.0%
- +$13,548
- After-tax cash flow
- $-27,342/yr
For passive investors: Depreciation is non-cash, so a rental often shows a tax loss while cash-flowing — sheltering income. Rental losses are passive: they offset passive income freely, and up to $25,000/yr can offset ordinary (W-2) income if you actively participate and your MAGI is under $100k (phasing out to $0 by $150k); unused losses carry forward. On sale, claimed depreciation is recaptured at up to 25%, and gains may owe capital-gains tax (a 1031 exchange can defer both). Figures are a year-1 estimate at your 24.0% rate — not tax advice; consult a CPA.
Schools (NCES district)
- District
- Miami-Dade
- NCES district ID
- 1200390
- Math proficiency
- 45% ▼ -16.00%
- Reading proficiency
- 54% ▼ -5.00%
- Median HH income
- $43,928
- Composite
- 41.76/100
- National rank
- #3397
- State rank
- #40 of 73 in FL
Livability — Miami
- Score
- 78/100
- State rank
- #177
- US rank
- #2724
Category grades
Schools grade is shown separately in the Schools card above.
Census & demographics
- Census place
- Miami, FL
- County
- Miami-Dade County · 2,697,751 people
- City population
- 827,308
- Metro
- Miami-Fort Lauderdale-Pompano Beach, FL
- Population (ZIP)
- 47,307
- Household income
- $58,210
- Rent vs Own
- Severe rent burden
- 3930.0
Population outlook (Miami-Dade County) Hauer SSP2
- Today (2025)
- 3,126,439 people
- By 2030
- 3,325,765 · +6.4%
- By 2040
- 3,697,561 · +18.3%
- By 2050
- 4,012,134 · +28.3%
- By 2075
- 4,605,612 · +47.3%
- By 2100
- 4,866,598 · +55.7%
Race, ethnicity, and origin ACS 2023
- Neighborhood character
- Predominantly Hispanic (95%)
- Race & ethnicity
- Hispanic / Latino 95% Two or more races 50% White 3%
- Hispanic origin (detail)
- Mexican 1% Puerto Rican 2% Cuban 60% Dominican 2%
- Foreign-born
- 76% · Canada, Jamaica, Guatemala
- Languages at home
- 8% English-only · Spanish 91%
Political lean MEDSL · Miami-Dade
- 2024 margin
- R (+11.4) · D 43.9% · R 55.4%
- 2008→2024 swing
- -27.6pp toward R · 2008: 16.1pp · 2024: -11.4pp
- All cycles
- 2024: R+11.4 2020: D+7.3 2016: D+29.6 2012: D+23.7 2008: D+16.1
Not yet ingested
- Civics
- —
Market trends
- HPI YoY
- ▼ -343.54%
- Current HPI
- 318.6854
- Rent YoY
- ▼ -4.50%
- Metro
- Miami-Fort Lauderdale-Pompano Beach, FL
- State GDP YoY
- ▲ 3.28%
- F500 in state
- 36
Industry mix (Fortune 500 HQ in FL)
| Industry | F500 HQs | Revenue |
|---|---|---|
| Industrial Technology | 2 | $29B |
|
||
| Insurance | 2 | $17B |
|
||
| Retail | 1 | $60B |
|
||
| Technology Distribution | 1 | $58B |
|
||
| Homebuilding | 1 | $35B |
|
||
| Technology Manufacturing | 1 | $35B |
|
||
Price history
-92.3% since first listed12 events — show timeline
- 2026-06-09 Listed $5,000 NFMLS
- 2025-01-02 Listing Removed — CATRS
- 2024-11-26 Relisted — CATRS
- 2024-10-08 Contingent — CATRS
- 2024-10-04 Price Changed $670,000 CATRS
- 2024-09-22 Price Changed $680,000 CATRS
- 2024-09-14 Price Changed $720,000 CATRS
- 2024-08-19 Price Changed $790,000 CATRS
- 2024-08-14 Price Changed $830,000 CATRS
- 2024-07-26 Listed $870,000 CATRS
- 1998-03-25 Sold (Public Records) $145,000 Public Records
- 1990-06-26 Sold (Public Records) $65,000 Public Records
Property tax history
-0.4%/yrLatest (2025): $4,389 · +2.6% YoY. Source: county tax records.
Cash-flow waterfall
monthlySold comps — $/sqft
last 12 mo · ≤1 miLoading sold comps…