 Fourplex
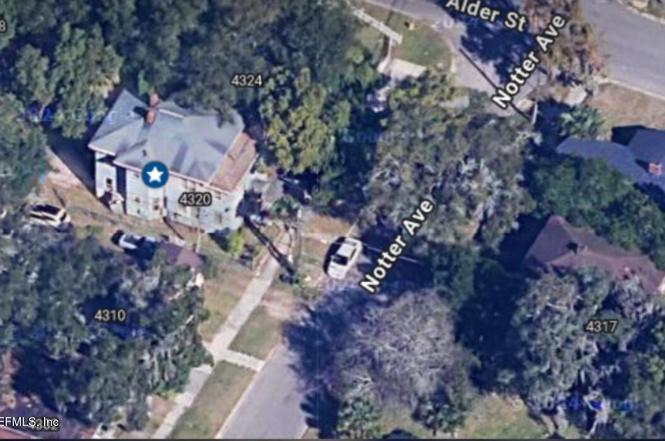
4320 Notter Ave · Jacksonville, FL
Flood risk 1/10 · Minimal
- FEMA flood zone
- X (unshaded)
- Chance of flooding over 30 yrs
- 0.0%
- Est. flood insurance / yr
- $507 – $1,088
Fire risk 1/10 · Minimal
- Est. fire insurance / yr
- $947 – $1,759
Heat risk 9/10 · Severe
- Hot days now (above 107°F)
- 7 days/yr
- Hot days in 30 yrs
- 20 days/yr
Wind risk 9/10 · Severe
- Chance of severe wind over 30 yrs
- 99.0%
Air-quality risk 4/10 · Minor
- Unhealthy air days now
- 6 days/yr
- Unhealthy air days in 30 yrs
- 6 days/yr
Risk factors via First Street. Map © Google.
Why this score? — see what drove the B+ grade
The composite is a weighted blend of 9 inputs, each scored 0–100. Each bar is that input's sub-score; the figure is the points it added to the 100-point composite (weight × sub-score).
- Cash flow +30.0/30.0
- ARV discount +15.0/15.0
- 1% rule +10.0/10.0
- DSCR +10.0/10.0
- Livability +4.2/5.0
- Schools +3.9/10.0
- Rent growth +2.7/5.0
- Condition / age +2.5/5.0
- Appreciation +0.0/10.0
$178,000
🖨 Deal sheet 📄 Offer letter ✓ Due diligence
Multi-family units
County records classify this as Multi-Family (5+ Unit). Listing-text estimate: 4 units. estimate disagrees with records
5+ unit building — per-unit beds/baths from public records are typically unavailable; the breakdown below (if shown) is an estimate from the listing text.
Listing remarks MLS
THIS IS A FOUR-PLEX, FOUR APARTMENTS, GREAT OPPORTUNITY FOR INVESTORS.THIS IS NOT A SHORT SALE.
Key facts
- 4,791 sq ft lot
- Built 1924
- Listed 146 days
Property features AI
Finance
- Financial info: Tax information available
Exterior
- Parking: Additional parking available
- Utilities: Electricity available and connected; Water available and connected; Sewer available and connected
- Home design: Quadruplex; Attached property; 2-story building
- Exterior features: Few trees on the lot
Interior
- Bedrooms: 4 bedrooms
- Heating & cooling: Central heating; Central air conditioning
- Interior features: Unfurnished; Property used for investment and residential purposes
Neighborhood map
What this means for you Summary
Snapshot
- This is a 4 × 2-bed/1.5-bath units multifamily listed at $178k.
Deal economics
- At list price, monthly cash flow is $2k ($23k/yr) — positive. Per door: $488/mo.
- The deal already cash-flows at list — no discount required.
- Meets the 1% rule at list price ($4k rent vs $178k).
- Recommended offer: $157k (12.0% below list) — sets the bar for market timing.
- Cap rate 19.5% vs local median 4.0% in Jacksonville — top-decile yield for the area; either an underpriced asset or a hidden risk that comps aren't pricing in. Stress-test before assuming the spread holds.
Location & tenants
- Location reads 83/100 on livability (#50 in FL, #911 nationally) — a professional / high-income tenant draw. Strengths: amenities A+, commute A+, housing A+.
- Duval (urban): math 46% / reading 45% proficiency, ranked #48 of 73 in FL (top 66%) — families likely to look elsewhere, expect single-tenant / working-renter base with shorter leases.
- Market conditions: Rents flat; 194 active listings in the ZIP; 4 comparable units currently listed for rent nearby; rentals at typical pace (median 17d on market — plan ~3-4 weeks tenant-placement turnaround); lower-income renter base — watch delinquency; 6,503 units permitted in Duval County in 2024 (1,131 in 5+ unit buildings).
- At $3,879/mo this rent would consume 119% of the median local household income ($39k/yr) (locally 1057% of renters already pay >50% of income on rent) — very limited rent-growth headroom before tenants either downsize or default.
Forward outlook
- Local home prices are declining (-3.0%/yr); year-one equity from $1k of loan paydown is wiped out by about $5k of value loss. Plan a longer hold.
- Duval County population projected at +19% by 2050 — long-run rental-demand tailwind backs the buy-and-hold thesis.
- At projected returns (-3.0% appreciation + 0.9% rent growth), your $50k cash investment doubles in ~3 years — after that, you're playing with house money.
Negotiation context
- It's been on market 147 days — a 12% lower offer ($157k) is reasonable based on typical stale-listing flexibility.
- 4 sale attempts since 17y ago with the ask held roughly flat each time — persistent listings suggest the price (not the market) is what's stuck; bring a comps-based counter.
- Current owner paid $12k; list at $178k implies a 1383% gain — meaningful room to come down on a strong offer.
Risks & watch-outs
- Watch-outs: built in 1924 — expect roof / HVAC / electrical / plumbing capex.
- Climate carrying-cost: severe wind risk, 99% chance of damaging wind over 30y; extreme-heat days projected 7→20/yr by 2055 (HVAC capex compounding) — expect insurance premiums to compound above CPI over the hold.
Questions for the listing agent
- It's been on market 147 days. Have you received any prior offers? Is the seller open to a 12% concession, seller financing, or rate buy-down credit?
- Can we see the unit-by-unit rent roll, current vacancy, and any below-market leases? What's the average tenancy length?
- What capital expenditures (roof, boiler, parking lot, exteriors) have been made in the last 5 years, and what's planned in the next 2?
- Built in 1924 — when were the roof, HVAC, electrical panel, plumbing, and water heater last replaced?
- Why hasn't it sold? Are there any deal-killer items the seller is aware of (foundation, flood, title, zoning, code violations)?
- Is there a deadline driving the sale (1031 exchange, divorce, estate, relocation)? That informs how much negotiation room exists.
- Schools are B-rated — typically a magnet for longer-tenancy family renters. What's the average tenant stay here, and is there a school-zone premium baked into asking?
- What's the average days-on-market for RENTAL listings here right now (not sales)? A rising rental-DOM trend means longer vacancies and softer asking-rent achievability than the comps imply.
- What's the recent tenant-quality profile in this submarket — average credit score on applications, eviction rate, late-payment / NSF rate, and stable-employment percentage? A property-management company in the area should have these aggregated.
- How much new apartment / multifamily construction is in the pipeline within 1–3 miles? Heavy new supply (>2% of stock underway) typically softens rents 12–24 months out; light construction supports rent growth.
Investment metrics
- 1% rule
- 2.18% ✓
- Cap rate
- 19.47%
- Cash-on-cash
- 47.05%
- DSCR
- 3.09
- GRM
- 3.8
CMA / ARV
- ARV (on-the-fly)
- $290,260
- Comps found
- 1
Show comp detail 1 sale within ~0.75 mi
| Address | Dist | Beds/Ba | Sqft | Sold | Price | $/sf | Match |
|---|---|---|---|---|---|---|---|
| 532 W 24th St | 0.45mi | 4/2.0 | 2,358 (-7%) | 21mo | $270,000 | $115 | 43 |
Match score weights: distance 35% · size 25% · config 20% · recency 20%. Top-matched comps best support the ARV.
Projected returns pro-forma
-3.0% appreciation · 0.94% rent growth · sell at horizon
- IRR
- 42.1%
- Equity multiple
- 2.76×
- Total profit
- $87,712
- Equity at exit
- $26,540
- IRR
- 47.3%
- Equity multiple
- 5.12×
- Total profit
- $205,547
- Equity at exit
- $15,390
Cash invested: $49,840 (down + closing). Projections, not guarantees.
Landlord ↔ Tenant lean methodology
- Overall (STATE)
- 87 Strongly Landlord-Friendly
- State Florida
- 87 Strongly Landlord-Friendly · R+3
- County
- — inherits STATE
- City
- — inherits STATE
ZIP-level market 32206
- Home prices YoY
- -23.7%
- Rents YoY
- 0.9%
- Active inventory
- 194
- Price-to-rent
- 15.3×
Monthly cashflow live
- Estimated rent
- $3,879 high interval (Pro) →
- Mortgage (P&I)
- −$933
- Tax from tax record
- −$103 /mo · $1,234/yr
- Insurance
- −$74
- HOA
- −$0
- Vacancy / Maint / Mgmt
- −$815
- Net cashflow
- $1,954
Break-even live
4-unit breakdown (identical units grouped — click to expand)
| Units | Beds | Baths | Est. rent |
|---|---|---|---|
| 4× units | 2 | 1.5 | $3,880 |
| #1 | 2 | 1.5 | $970 |
| #2 | 2 | 1.5 | $970 |
| #3 | 2 | 1.5 | $970 |
| #4 | 2 | 1.5 | $970 |
| Total (4 units) | $3,879 | ||
UW: 25.0% down · 7.5% · 30yr · 1.5% tax · 5.0% vac · 8.0% maint · 8.0% mgmt
Financing live
Cash to close
- Down payment
- $44,500
- Closing costs
- $5,340
- Reserves months
- —
- Total cash needed
- —
Loan-product check · same deal, 3 products live
Conventional
25% down · 7.5% · 30yr
- Down + closing
- —
- Monthly P&I
- —
- Monthly cashflow
- —
- DSCR
- —
- Eligible?
- —
Personal DTI + credit; lowest rate.
DSCR
20% down · 8.5% · 30yr
- Down + closing
- —
- Monthly P&I
- —
- Monthly cashflow
- —
- DSCR
- —
- Eligible?
- —
No personal income docs; deal must DSCR.
Hard money
10% down · 12.0% · 12mo
- Down + closing
- —
- Monthly P&I
- —
- Monthly cashflow
- —
- DSCR
- —
- Eligible?
- —
Short-term bridge; refi at stabilization.
Rent comps 4 comps
| Address | Beds | Baths | Sqft | Rent | $/sqft | DOM | Units | Dist |
|---|---|---|---|---|---|---|---|---|
| 421 Golfair Blvd Jacksonville, FL | 4.0 | 2.5 | 1761 | $1,381 | $0.78 | 16d | 1 | 0.21mi |
| 30 W 12th St Jacksonville, FL | 4.0 | 3.0 | 1792 | $2,580 | $1.44 | 1d | 1 | 1.04mi |
| 1931 Silver St Jacksonville, FL | 3.0 | 2.0 | 2132 | $2,600 | $1.22 | 23d | 1 | 1.19mi |
| 1827 N Market St Jacksonville, FL | 5.0 | 3.5 | 2750 | $3,100 | $1.13 | 17d | 1 | 1.42mi |
Listing history 23 events
-
2026-06-18days on market $178,000 Active 147 DOM
-
2026-06-17days on market $178,000 Active 146 DOM
-
2026-06-16days on market $178,000 Active 145 DOM
-
2026-06-15remarks 485-char remark
-
2026-06-15statusdays on market $178,000 Active 144 DOM
-
2026-06-10days on market $178,000 Active Under Contract 138 DOM
-
2026-06-08days on market $178,000 Active Under Contract 137 DOM
-
2026-06-07days on market $178,000 Active Under Contract 136 DOM
-
2026-06-03days on market $178,000 Active Under Contract 132 DOM
-
2026-06-02days on market $178,000 Active Under Contract 131 DOM
-
2026-06-01days on market $178,000 Active Under Contract 130 DOM
-
2026-05-31days on market $178,000 Active Under Contract 129 DOM
-
2026-03-26historical Active Under Contract
-
2026-01-19$178,000 Active
-
2015-06-15historical 95-char remark
Show marketing remark (95 chars)
THIS IS A FOUR-PLEX, FOUR APARTMENTS, GREAT OPPORTUNITY FOR INVESTORS.THIS IS NOT A SHORT SALE.
-
2014-06-15$40,000 Active 95-char remark
Show marketing remark (95 chars)
THIS IS A FOUR-PLEX, FOUR APARTMENTS, GREAT OPPORTUNITY FOR INVESTORS.THIS IS NOT A SHORT SALE.
-
2009-08-27historical 213-char remark
Show marketing remark (213 chars)
CAN BE A LARGE SFR OR A DUPLEX. GREAT OPPORTUNITY FOR INVESTOR. NEEDS REPAIRS. SELLER ACQUIRED PROPERTY THROUGH FORECLOSURE. SELLER AND AGENT MAKE NO REPRESENTATION OR WARRANTIES ON PROPERTY. BEING SOLD ''AS IS''.
-
2009-08-21soldstatus $12,000 213-char remark
Show marketing remark (213 chars)
CAN BE A LARGE SFR OR A DUPLEX. GREAT OPPORTUNITY FOR INVESTOR. NEEDS REPAIRS. SELLER ACQUIRED PROPERTY THROUGH FORECLOSURE. SELLER AND AGENT MAKE NO REPRESENTATION OR WARRANTIES ON PROPERTY. BEING SOLD ''AS IS''.
-
2009-07-24$13,910 213-char remark
Show marketing remark (213 chars)
CAN BE A LARGE SFR OR A DUPLEX. GREAT OPPORTUNITY FOR INVESTOR. NEEDS REPAIRS. SELLER ACQUIRED PROPERTY THROUGH FORECLOSURE. SELLER AND AGENT MAKE NO REPRESENTATION OR WARRANTIES ON PROPERTY. BEING SOLD ''AS IS''.
-
2009-07-13historical
-
2009-04-28$15,500
-
1977-01-25soldstatus $20,000
-
1975-05-29soldstatus $25,100
ⓘ Source: listings_history table (triggers on properties + properties_extension) + one-shot
backfill from property_details.listing_events for pre-trigger history.
Tax reassessment forecast FL · Resets to sale price
- Current annual tax
- $1,234 · $103/mo
- Projected year-2 tax
- $1,477 · $123/mo
- Expected delta
- +$244/yr (+$20/mo · 19.7%)
ⓘ Screening estimate from a state-policy table — verify with the county assessor before closing.
Climate risk First Street
- Flood 1/10 Low FEMA zone X (unshaded) · 0% chance over 30 yrs
- Wildfire 1/10 Low
- Heat 9/10 Extreme 7 d/yr ≥107°F today · 20 d/yr by 30 yrs out
- Wind 9/10 Extreme 99% chance of damaging wind over 30 yrs
- Air quality 4/10 Moderate 6 unhealthy d/yr today · 6 by 30 yrs out
Nearby sold comps map
Loading sold comps map…
Walkable amenities ~0.75 mi
Loading nearby amenities…
Taxation est. · year 1
- Rental income
- $46,548
- − Mortgage interest
- −$9,971
- − Property taxes
- −$1,234
- − Insurance
- −$890
- − Repairs & maintenance
- −$3,724
- − Management
- −$3,724
- − Depreciation
- −$5,178
- Taxable income
- $21,828
- Est. tax owed @ 24.0%
- −$5,239
- After-tax cash flow
- $18,209/yr
For passive investors: Depreciation is non-cash, so a rental often shows a tax loss while cash-flowing — sheltering income. Rental losses are passive: they offset passive income freely, and up to $25,000/yr can offset ordinary (W-2) income if you actively participate and your MAGI is under $100k (phasing out to $0 by $150k); unused losses carry forward. On sale, claimed depreciation is recaptured at up to 25%, and gains may owe capital-gains tax (a 1031 exchange can defer both). Figures are a year-1 estimate at your 24.0% rate — not tax advice; consult a CPA.
Schools (NCES district)
- District
- Duval
- NCES district ID
- 1200480
- Math proficiency
- 46% ▼ -11.00%
- Reading proficiency
- 45% ▼ -4.00%
- Median HH income
- $48,987
- Composite
- 38.97/100
- National rank
- #4076
- State rank
- #48 of 73 in FL
Livability — Jacksonville
- Score
- 83/100
- State rank
- #50
- US rank
- #911
Category grades
Schools grade is shown separately in the Schools card above.
Census & demographics
- Census place
- Jacksonville, FL
- County
- Duval County · 1,015,274 people
- City population
- 979,034
- Metro
- Jacksonville, FL
- Population (ZIP)
- 17,105
- Household income
- $39,242
- Rent vs Own
- Severe rent burden
- 1057.0
Population outlook (Duval County) Hauer SSP2
- Today (2025)
- 1,013,010 people
- By 2030
- 1,059,228 · +4.6%
- By 2040
- 1,141,439 · +12.7%
- By 2050
- 1,205,258 · +19.0%
- By 2075
- 1,324,282 · +30.7%
- By 2100
- 1,319,620 · +30.3%
Race, ethnicity, and origin ACS 2023
- Neighborhood character
- Predominantly Black (65%)
- Race & ethnicity
- Black 65% White 22% Two or more races 8% Hispanic / Latino 6%
- Hispanic origin (detail)
- Mexican 1% Puerto Rican 2%
- Common ancestry
- Italian 2% Romanian 1% Slovak 1%
- Foreign-born
- 5% · Canada
- Languages at home
- 93% English-only · Spanish 3% Arabic 1% German/W. Germanic 1%
Political lean MEDSL · Duval
- 2024 margin
- Toss-up / Even · D 48.7% · R 50.1% · Other 1.2%
- 2008→2024 swing
- +0.4pp no change · 2008: -1.9pp · 2024: -1.5pp
- All cycles
- 2024: R+1.5 2020: D+3.8 2016: R+1.5 2012: R+3.6 2008: R+1.9
Not yet ingested
- Civics
- —
Market trends
- HPI YoY
- ▼ -64.55%
- Current HPI
- 208.1852
- Rent YoY
- ▲ 0.94%
- Metro
- Jacksonville, FL
- State GDP YoY
- ▲ 3.28%
- F500 in state
- 36
Industry mix (Fortune 500 HQ in FL)
| Industry | F500 HQs | Revenue |
|---|---|---|
| Industrial Technology | 2 | $29B |
|
||
| Insurance | 2 | $17B |
|
||
| Retail | 1 | $60B |
|
||
| Technology Distribution | 1 | $58B |
|
||
| Homebuilding | 1 | $35B |
|
||
| Technology Manufacturing | 1 | $35B |
|
||
Price history
+609.2% since first listed11 events — show timeline
- 2026-03-26 Contingent — realMLS
- 2026-01-19 Listed $178,000 realMLS
- 2015-06-15 Listing Removed — realMLS
- 2014-06-15 Listed $40,000 realMLS
- 2009-08-27 Listing Removed — realMLS
- 2009-08-21 Sold (MLS) $12,000 realMLS
- 2009-07-24 Listed $13,910 realMLS
- 2009-07-13 Listing Removed — realMLS
- 2009-04-28 Listed $15,500 realMLS
- 1977-01-25 Sold (Public Records) $20,000 Public Records
- 1975-05-29 Sold (Public Records) $25,100 Public Records
Property tax history
+1.6%/yrLatest (2025): $1,234 · +40.0% YoY. Source: county tax records.
Cash-flow waterfall
monthlySold comps — $/sqft
last 12 mo · ≤1 miLoading sold comps…