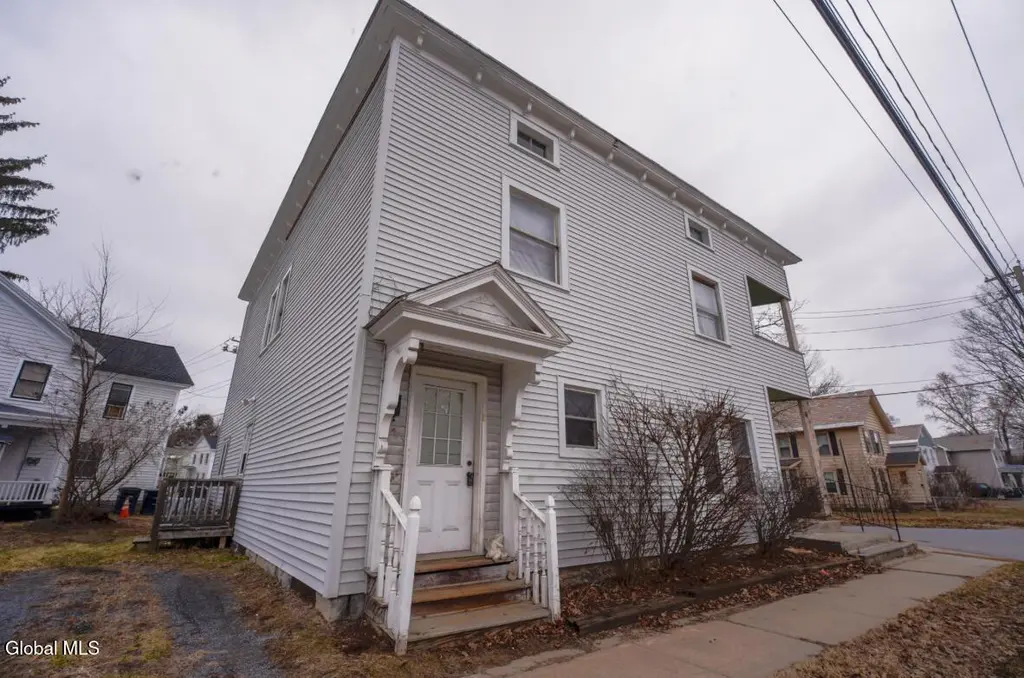
 Triplex
187 South St · Glens Falls, NY
Flood risk No data
- FEMA flood zone
- —
- Chance of flooding over 30 yrs
- —
- Est. flood insurance / yr
- —
Fire risk No data
- Est. fire insurance / yr
- —
Heat risk No data
- Hot days now (above threshold)
- —
- Hot days in 30 yrs
- —
Wind risk No data
- Chance of severe wind over 30 yrs
- —
Air-quality risk No data
- Unhealthy air days now
- —
- Unhealthy air days in 30 yrs
- —
Risk factors via First Street. Map © Google.
Why this score? — see what drove the B+ grade
The composite is a weighted blend of 9 inputs, each scored 0–100. Each bar is that input's sub-score; the figure is the points it added to the 100-point composite (weight × sub-score).
- Cash flow +30.0/30.0
- ARV discount +15.0/15.0
- 1% rule +10.0/10.0
- DSCR +10.0/10.0
- Livability +4.2/5.0
- Schools +4.1/10.0
- Rent growth +2.5/5.0
- Condition / age +2.2/5.0
- Appreciation +0.0/10.0
$259,900
🖨 Deal sheet (PDF) 📄 Offer letter ✓ Due diligence
Multi-family units
County records classify this as Multi-Family (2-4 Unit). Listing-text estimate: 3 units. confirmed
Listing remarks MLS
Well-maintained two-family home located on a convenient city street in Glens Falls. Offering approximately 2,478 square feet of living space, this property presents a strong opportunity for investors or owner-occupants. Unit 1 features 1 bedroom and 1 full bath, while Unit 2 offers 3 bedrooms and 1 full bath. Additional potential for a third unit provides added value and income possibilities. Ideally situated just minutes from downtown, shopping, dining, and local amenities, this property combines space, flexibility, and location.
Key facts
- Two-family home
- Local amenities
- 2,613 sq ft lot
Tags
Neighborhood map
What this means for you Summary
Snapshot
- This is a 3 × 5-bed/?-bath units multifamily listed at $260k. Condition is rated fair.
Deal economics
- At list price, monthly cash flow is $3k ($35k/yr) — positive. Per door: $979/mo.
- The deal already cash-flows at list — no discount required.
- Meets the 1% rule at list price ($6k rent vs $260k).
- Recommended offer: $244k (6.0% below list) — sets the bar for market timing.
- Cap rate 19.9% vs local median 4.8% in Glens Falls — top-decile yield for the area; either an underpriced asset or a hidden risk that comps aren't pricing in. Stress-test before assuming the spread holds.
Location & tenants
- Location reads 83/100 on livability (#60 in NY, #894 nationally) — a professional / high-income tenant draw. Strengths: crime A+, amenities A+, housing A+.
- Glens Falls City School District (urban): math 44% / reading 53% proficiency, ranked #416 of 590 in NY (top 70%) — families likely to look elsewhere, expect single-tenant / working-renter base with shorter leases.
- Market conditions: 56 active listings in the ZIP; 180 units permitted in Warren County in 2024 (40 in 5+ unit buildings).
- At $5,991/mo this rent would consume 106% of the median local household income ($68k/yr) (locally 866% of renters already pay >50% of income on rent) — very limited rent-growth headroom before tenants either downsize or default.
Forward outlook
- Local home prices are declining (-3.0%/yr); year-one equity from $2k of loan paydown is wiped out by about $8k of value loss. Plan a longer hold.
- Warren County population projected at -19% by 2050 — secular population decline; favor cash flow + early exit over multi-decade hold.
- At projected returns (-3.0% appreciation + 3.0% rent growth), your $73k cash investment doubles in ~3 years — after that, you're playing with house money.
Negotiation context
- It's been on market 85 days — a 6% lower offer ($244k) is reasonable based on typical stale-listing flexibility.
Questions for the listing agent
- It's been on market 85 days. Have you received any prior offers? Is the seller open to a 6% concession, seller financing, or rate buy-down credit?
- Can we see the unit-by-unit rent roll, current vacancy, and any below-market leases? What's the average tenancy length?
- What capital expenditures (roof, boiler, parking lot, exteriors) have been made in the last 5 years, and what's planned in the next 2?
- Have any recent inspections been done? Can we get a copy of the seller's disclosures and any deferred-maintenance estimates?
- Built in 1965 — when were the roof, HVAC, electrical panel, plumbing, and water heater last replaced?
- Why hasn't it sold? Are there any deal-killer items the seller is aware of (foundation, flood, title, zoning, code violations)?
- Is there a deadline driving the sale (1031 exchange, divorce, estate, relocation)? That informs how much negotiation room exists.
- What's the average days-on-market for RENTAL listings here right now (not sales)? A rising rental-DOM trend means longer vacancies and softer asking-rent achievability than the comps imply.
- What's the recent tenant-quality profile in this submarket — average credit score on applications, eviction rate, late-payment / NSF rate, and stable-employment percentage? A property-management company in the area should have these aggregated.
- How much new apartment / multifamily construction is in the pipeline within 1–3 miles? Heavy new supply (>2% of stock underway) typically softens rents 12–24 months out; light construction supports rent growth.
Investment metrics
- 1% rule
- 2.31% ✓
- Cap rate
- 19.85%
- Cash-on-cash
- 48.43%
- DSCR
- 3.15
- GRM
- 3.6
CMA / ARV
- ARV (median comp)
- $457,983
- List price
- $259,900
- Delta
- -43.25%
- Verdict
- UNDERPRICED
- Comps
- 20 within 1.0 mi
Projected returns pro-forma
-3.0% appreciation · 3.0% rent growth · sell at horizon
- IRR
- 46.0%
- Equity multiple
- 2.99×
- Total profit
- $145,020
- Equity at exit
- $38,752
- IRR
- 51.8%
- Equity multiple
- 6.05×
- Total profit
- $367,499
- Equity at exit
- $22,471
Cash invested: $72,772 (down + closing). Projections, not guarantees.
Landlord ↔ Tenant lean methodology
- Overall (STATE)
- 15 Strongly Tenant-Friendly
- State New York
- 15 Strongly Tenant-Friendly · D+10
- County
- — inherits STATE
- City
- — inherits STATE
ZIP-level market 12801
- Home prices YoY
- -13.7%
- Active inventory
- 56
- Price-to-rent
- 10.8×
Monthly cashflow live
- Estimated rent
- $5,991 medium interval (Pro) →
- Mortgage (P&I)
- −$1,363
- Tax est. 1.5%
- −$325 /mo · $3,898/yr
- Insurance
- −$108
- HOA
- −$0
- Vacancy / Maint / Mgmt
- −$1,258
- Net cashflow
- $2,937
Break-even live
Sensitivity live
| Price | -10% $3,116 | -5% $3,027 | +0% $2,937 | +5% $2,847 | +10% $2,757 |
|---|---|---|---|---|---|
| Rent | -10% $2,463 | -5% $2,700 | +0% $2,937 | +5% $3,173 | +10% $3,410 |
| Rate | -1.0pp $3,068 | -0.5pp $3,003 | base $2,937 | +0.5pp $2,869 | +1.0pp $2,801 |
3-unit breakdown (identical units grouped — click to expand)
| Units | Beds | Baths | Est. rent |
|---|---|---|---|
| 3× units | 5 | — | $5,991 |
| #1 | 5 | — | $1,997 |
| #2 | 5 | — | $1,997 |
| #3 | 5 | — | $1,997 |
| Total (3 units) | $5,991 | ||
UW: 25.0% down · 7.5% · 30yr · 1.5% tax · 5.0% vac · 8.0% maint · 8.0% mgmt
Financing live
Cash to close
- Down payment
- $64,975
- Closing costs
- $7,797
- Reserves months
- —
- Total cash needed
- —
Loan-product check · same deal, 3 products live
Conventional
25% down · 7.5% · 30yr
- Down + closing
- —
- Monthly P&I
- —
- Monthly cashflow
- —
- DSCR
- —
- Eligible?
- —
Personal DTI + credit; lowest rate.
DSCR
20% down · 8.5% · 30yr
- Down + closing
- —
- Monthly P&I
- —
- Monthly cashflow
- —
- DSCR
- —
- Eligible?
- —
No personal income docs; deal must DSCR.
Hard money
10% down · 12.0% · 12mo
- Down + closing
- —
- Monthly P&I
- —
- Monthly cashflow
- —
- DSCR
- —
- Eligible?
- —
Short-term bridge; refi at stabilization.
Listing history 17 events
-
2026-06-19days on market $259,900 Active 85 DOM
-
2026-06-18days on market $259,900 Active 84 DOM
-
2026-06-17days on market $259,900 Active 83 DOM
-
2026-06-16days on market $259,900 Active 82 DOM
-
2026-06-15days on market $259,900 Active 81 DOM
-
2026-06-14days on market $259,900 Active 79 DOM
-
2026-06-12days on market $259,900 Active 78 DOM
-
2026-06-09days on market $259,900 Active 75 DOM
-
2026-06-08days on market $259,900 Active 74 DOM
-
2026-06-07days on market $259,900 Active 73 DOM
-
2026-06-04days on market $259,900 Active 69 DOM
-
2026-06-03price $259,900 Active 68 DOM
-
2026-06-02days on market $274,900 Active 68 DOM
-
2026-06-01days on market $274,900 Active 67 DOM
-
2026-05-31days on market $274,900 Active 66 DOM
-
2026-05-31days on market $274,900 Active 65 DOM
-
2026-03-24$274,900 Active 536-char remark
Show marketing remark (536 chars)
Well-maintained two-family home located on a convenient city street in Glens Falls. Offering approximately 2,478 square feet of living space, this property presents a strong opportunity for investors or owner-occupants. Unit 1 features 1 bedroom and 1 full bath, while Unit 2 offers 3 bedrooms and 1 full bath. Additional potential for a third unit provides added value and income possibilities. Ideally situated just minutes from downtown, shopping, dining, and local amenities, this property combines space, flexibility, and location.
ⓘ Source: listings_history table (triggers on properties + properties_extension) + one-shot
backfill from property_details.listing_events for pre-trigger history.
Nearby sold comps map
Loading sold comps map…
Walkable amenities ~0.75 mi
Loading nearby amenities…
Taxation est. · year 1
- Rental income
- $71,892
- − Mortgage interest
- −$14,558
- − Property taxes
- −$3,898
- − Insurance
- −$1,300
- − Repairs & maintenance
- −$5,751
- − Management
- −$5,751
- − Depreciation
- −$7,561
- Taxable income
- $33,072
- Est. tax owed @ 24.0%
- −$7,937
- After-tax cash flow
- $27,304/yr
For passive investors: Depreciation is non-cash, so a rental often shows a tax loss while cash-flowing — sheltering income. Rental losses are passive: they offset passive income freely, and up to $25,000/yr can offset ordinary (W-2) income if you actively participate and your MAGI is under $100k (phasing out to $0 by $150k); unused losses carry forward. On sale, claimed depreciation is recaptured at up to 25%, and gains may owe capital-gains tax (a 1031 exchange can defer both). Figures are a year-1 estimate at your 24.0% rate — not tax advice; consult a CPA.
Condition & rehab AI · 12 photos
This 3-family home requires extensive renovations to improve its condition and increase its value. The exterior, interior, and mechanical systems all need significant work, and the property's curb appeal is lacking. With proper updates, this property has the potential to become a valuable investment.
Repairs flagged
- Major Exterior siding — Severe peeling and damage.
- Major Exterior paint — Peeling and chipping.
- Major Kitchen cabinets — Outdated and worn-out.
- Major Kitchen appliances — Old and outdated.
- Major Kitchen flooring — Worn-out and in need of replacement.
- Major Bathroom fixtures — Old and outdated.
- Major Bathroom flooring — Worn-out and in need of replacement.
- Major Interior walls — Painted walls with visible wear and tear.
- Major Windows — Older windows with visible wear and tear.
- Major Foundation — Exposed structural issues and potential foundation damage.
- Unknown HVAC system — No visible damage, but cannot confirm condition from exterior view.
- Major Landscaping — Overgrown bushes and unkempt landscaping.
Value-add opportunities
- Both Exterior siding and paint — Improves curb appeal and property value.
- Both Kitchen and bathroom updates — Modernizes the living spaces and increases value.
- Both HVAC system replacement — Improves comfort and energy efficiency.
- Both Landscaping and curb appeal — Enhances the overall appearance and value of the property.
Renovation cost estimate screening
| Repair item | Severity | Est. cost |
|---|---|---|
| Exterior siding · Severe peeling and damage. | Major | $15,000–50,000 |
| Exterior paint · Peeling and chipping. | Major | $15,000–50,000 |
| Kitchen cabinets · Outdated and worn-out. | Major | $15,000–50,000 |
| Kitchen appliances · Old and outdated. | Major | $15,000–50,000 |
| Kitchen flooring · Worn-out and in need of replacement. | Major | $15,000–50,000 |
| Bathroom fixtures · Old and outdated. | Major | $15,000–50,000 |
| Bathroom flooring · Worn-out and in need of replacement. | Major | $15,000–50,000 |
| Interior walls · Painted walls with visible wear and tear. | Major | $15,000–50,000 |
| Windows · Older windows with visible wear and tear. | Major | $15,000–50,000 |
| Foundation · Exposed structural issues and potential foundation damage. | Major | $15,000–50,000 |
| HVAC system · No visible damage, but cannot confirm condition from exterior view. | Unknown | $500–3,000 |
| Landscaping · Overgrown bushes and unkempt landscaping. | Major | $15,000–50,000 |
| Total estimated repair cost · 12 items | $165,500–553,000 |
Value-add ROI direction
- Both Exterior siding and paint — Improves curb appeal and property value. ↑
- Both Kitchen and bathroom updates — Modernizes the living spaces and increases value. ↑
- Both HVAC system replacement — Improves comfort and energy efficiency. ↑
- Both Landscaping and curb appeal — Enhances the overall appearance and value of the property. ↑
ⓘ Cost ranges are severity-bucket heuristics (US national rule-of-thumb). Get contractor quotes + a written scope before underwriting a rehab budget.
Schools (NCES district)
- District
- Glens Falls City School District
- NCES district ID
- 3612240
- Math proficiency
- 44% ▼ -8.00%
- Reading proficiency
- 53% ▲ 6.00%
- Median HH income
- $48,216
- Composite
- 41.34/100
- National rank
- #3499
- State rank
- #416 of 590 in NY
Livability — Glens Falls
- Score
- 83/100
- State rank
- #60
- US rank
- #894
Category grades
Schools grade is shown separately in the Schools card above.
Census & demographics
- Census place
- Glens Falls, NY
- County
- Warren County · 14,628 people
- City population
- 14,628
- Metro
- Glens Falls, NY
- Population (ZIP)
- 14,628
- Household income
- $67,577
- Rent vs Own
- Severe rent burden
- 866.0
Population outlook (Warren County) Hauer SSP2
- Today (2025)
- 62,372 people
- By 2030
- 60,491 · -3.0%
- By 2040
- 55,616 · -10.8%
- By 2050
- 50,437 · -19.1%
- By 2075
- 40,843 · -34.5%
- By 2100
- 31,159 · -50.0%
Race, ethnicity, and origin ACS 2023
- Neighborhood character
- Predominantly White (90%)
- Race & ethnicity
- White 90% Two or more races 6% Hispanic / Latino 3% Black 2%
- Common ancestry
- Lithuanian 9% Romanian 5% Slovak 5%
- Foreign-born
- 3% · Canada, Dominican Republic
- Languages at home
- 97% English-only · Spanish 1% German/W. Germanic 1%
Political lean MEDSL · Warren
- 2024 margin
- Toss-up / Even · D 47.9% · R 52.1%
- 2008→2024 swing
- -6.9pp toward R · 2008: 2.6pp · 2024: -4.2pp
- All cycles
- 2024: R+4.2 2020: R+0.2 2016: R+10.6 2012: D+2.1 2008: D+2.6
Not yet ingested
- Civics
- —
Market trends
- HPI YoY
- ▼ -52.28%
- Current HPI
- 330.581
- Rent YoY
- —
- Metro
- Glens Falls, NY
- State GDP YoY
- ▲ 2.60%
- F500 in state
- 92
Industry mix (Fortune 500 HQ in NY)
| Industry | F500 HQs | Revenue |
|---|---|---|
| Financial Services | 10 | $950B |
|
||
| Consumer Goods | 9 | $162B |
|
||
| Insurance | 4 | $225B |
|
||
| Telecommunications | 2 | $144B |
|
||
| Pharmaceuticals | 2 | $112B |
|
||
| Media / Entertainment | 2 | $69B |
|
||
Price history
1 event — show timeline
- 2026-03-24 Listed $274,900 Global MLS
Cash-flow waterfall
monthlySold comps — $/sqft
last 12 mo · ≤1 miLoading sold comps…