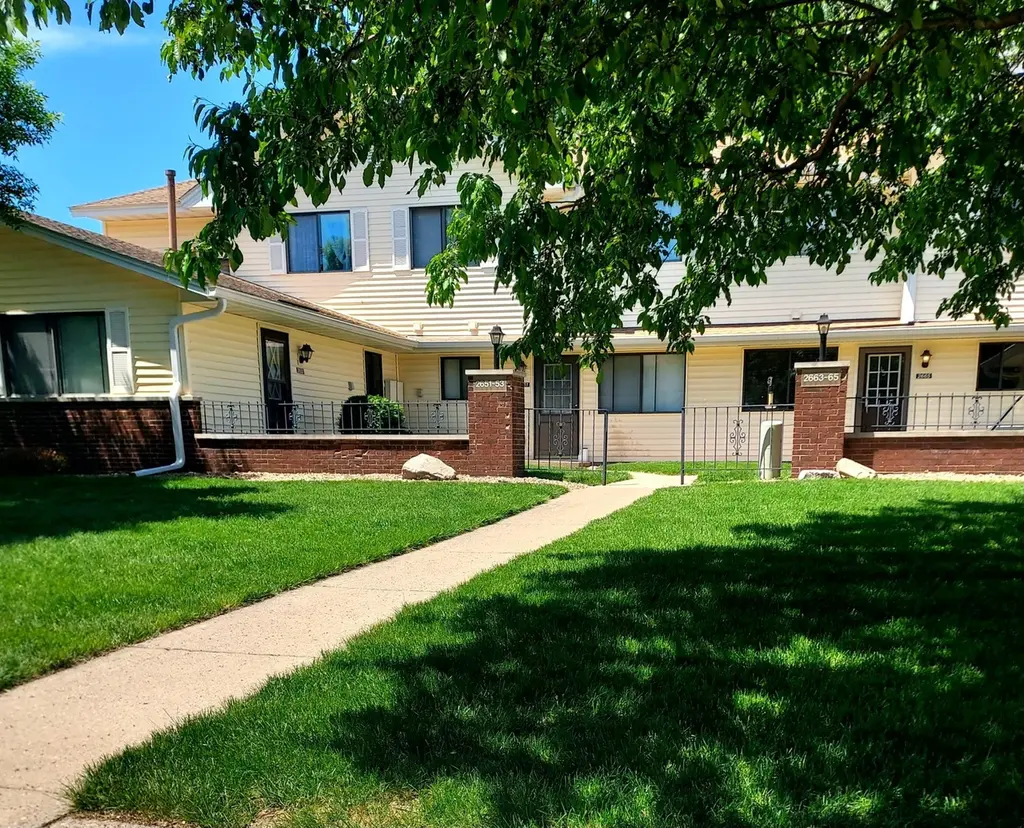
2653 Brookdale Ln · Brooklyn Park, MN
Flood risk 1/10 · Minimal
- FEMA flood zone
- X (unshaded)
- Chance of flooding over 30 yrs
- 0.0%
- Est. flood insurance / yr
- $473 – $860
Fire risk 2/10 · Minimal
- Est. fire insurance / yr
- $888 – $1,650
Heat risk 2/10 · Minimal
- Hot days now (above 100°F)
- 7 days/yr
- Hot days in 30 yrs
- 14 days/yr
Wind risk 2/10 · Minimal
- Chance of severe wind over 30 yrs
- —
Air-quality risk 2/10 · Minimal
- Unhealthy air days now
- 2 days/yr
- Unhealthy air days in 30 yrs
- 2 days/yr
Risk factors via First Street. Map © Google.
Why this score? — see what drove the C- grade
The composite is a weighted blend of 9 inputs, each scored 0–100. Each bar is that input's sub-score; the figure is the points it added to the 100-point composite (weight × sub-score).
- Cash flow +17.2/30.0
- ARV discount +7.5/15.0
- 1% rule +7.4/10.0
- DSCR +5.3/10.0
- Schools +4.2/10.0
- Livability +4.0/5.0
- Rent growth +2.5/5.0
- Condition / age +2.5/5.0
- Appreciation +0.0/10.0
$119,900
🖨 Deal sheet 📄 Offer letter ✓ Due diligence
Key facts
- $251 HOA
- Garage
- Built 1984
Property features AI
Finance
- Financial info: Property is free and clear
- HOA & community: HOA: Shingle Creek Manor; Monthly HOA fee of $251 covering hazard insurance, lawn care, grounds maintenance, professional management, and snow removal
Exterior
- Parking: Attached garage with garage door opener (1 garage space); Asphalt driveway
- Utilities: City water (connected); City sewer (connected); 100 amp electric service (Xcel Energy); Natural gas
- Home design: Residential attached property; One story; Entry on main level
- Construction: Concrete construction; Shingle roof (age over 8 years); Slab foundation; Built area approx. 780 (main level finished area)
- Exterior features: Vinyl exterior; Patio/porch (other); No pool; No fencing; Public transit within 6 blocks; Medium tree coverage; Other detached structures
Interior
- Kitchen: Dishwasher; Microwave; Refrigerator
- Bedrooms: 2 bedrooms (both on the main level)
- Flooring: Hardwood floors
- Bathrooms: 1 full bathroom (main level)
- Heating & cooling: Forced air heating; Central air conditioning
- Interior features: Informal dining area; Fireplace (other); Water softener (owned); In-ground sprinkler
- Laundry & utility: Washer; Dryer; Gas water heater; Laundry on main level
Neighborhood map
What this means for you Summary
Snapshot
- This is a 2-bed/1.0-bath condo listed at $120k.
Deal economics
- At list price, monthly cash flow is $85 ($1k/yr) — positive.
- The deal already cash-flows at list — no discount required.
- Meets the 1% rule at list price ($1k rent vs $120k).
- Cap rate 7.1% vs local median 3.3% in Brooklyn Park — top-decile yield for the area; either an underpriced asset or a hidden risk that comps aren't pricing in. Stress-test before assuming the spread holds.
Location & tenants
- Location reads 81/100 on livability (#50 in MN, #1,308 nationally) — a professional / high-income tenant draw. Strengths: commute A+, employment A+, housing A+; Watch: crime C-, schools D, amenities F.
- Osseo Public School District (suburban): math 42% / reading 51% proficiency, ranked #129 of 301 in MN (top 43%) — families likely to look elsewhere, expect single-tenant / working-renter base with shorter leases.
- Market conditions: 53 active listings in the ZIP; 12 comparable units currently listed for rent nearby; rentals lingering (median 44d on market — plan ~5-8 weeks vacancy on turnover, expect pricing pressure); 50% of comp listings sitting > 30 days — soft ceiling on asking rent; 4,651 units permitted in Hennepin County in 2024 (2,443 in 5+ unit buildings).
Forward outlook
- Local home prices are declining (-3.0%/yr); year-one equity from $829 of loan paydown is wiped out by about $4k of value loss. Plan a longer hold.
- Hennepin County population projected at +30% by 2050 — long-run rental-demand tailwind backs the buy-and-hold thesis.
Negotiation context
- Only 1 days on market — expect competitive offers; lowballing is unlikely to land.
- Current owner paid $54k; list at $120k implies a 124% gain — meaningful room to come down on a strong offer.
Questions for the listing agent
- What does the HOA fee cover, when was the last increase, and are there any pending special assessments or reserve-fund shortfalls?
- Any open or pending special assessments — roof, HVAC, plumbing, elevator, façade? What's the per-unit balance and payoff schedule, and is the seller paying it off at close or rolling it to the buyer?
- Is there a deadline driving the sale (1031 exchange, divorce, estate, relocation)? That informs how much negotiation room exists.
- Schools are D-rated, which usually means shorter tenancies and higher turnover. Who's the typical renter profile here, and what's been the actual vacancy rate?
- What's the average days-on-market for RENTAL listings here right now (not sales)? A rising rental-DOM trend means longer vacancies and softer asking-rent achievability than the comps imply.
- What's the recent tenant-quality profile in this submarket — average credit score on applications, eviction rate, late-payment / NSF rate, and stable-employment percentage? A property-management company in the area should have these aggregated.
- How much new apartment / multifamily construction is in the pipeline within 1–3 miles? Heavy new supply (>2% of stock underway) typically softens rents 12–24 months out; light construction supports rent growth.
Investment metrics
- 1% rule
- 1.24% ✓
- Cap rate
- 7.14%
- Cash-on-cash
- 3.03%
- DSCR
- 1.13
- GRM
- 6.7
CMA / ARV
No comps found within radius.
Projected returns pro-forma
-3.0% appreciation · 3.0% rent growth · sell at horizon
- IRR
- -11.4%
- Equity multiple
- 0.59×
- Total profit
- $-13,853
- Equity at exit
- $17,877
- IRR
- -1.9%
- Equity multiple
- 0.87×
- Total profit
- $-4,370
- Equity at exit
- $10,367
Cash invested: $33,572 (down + closing). Projections, not guarantees.
Landlord ↔ Tenant lean methodology
- Overall (STATE)
- 46 Balanced
- State Minnesota
- 46 Balanced · D+2
- County
- — inherits STATE
- City
- — inherits STATE
ZIP-level market 55444
- Active inventory
- 53
- Price-to-rent
- 6.7×
Monthly cashflow live
- Estimated rent
- $1,490 high interval (Pro) →
- Mortgage (P&I)
- −$629
- Tax from tax record
- −$163 /mo · $1,956/yr
- Insurance
- −$50
- HOA
- −$251
- Vacancy / Maint / Mgmt
- −$313
- Net cashflow
- $85
Break-even live
UW: 25.0% down · 7.5% · 30yr · 1.5% tax · 5.0% vac · 8.0% maint · 8.0% mgmt
Financing live
Cash to close
- Down payment
- $29,975
- Closing costs
- $3,597
- Reserves months
- —
- Total cash needed
- —
Loan-product check · same deal, 3 products live
Conventional
25% down · 7.5% · 30yr
- Down + closing
- —
- Monthly P&I
- —
- Monthly cashflow
- —
- DSCR
- —
- Eligible?
- —
Personal DTI + credit; lowest rate.
DSCR
20% down · 8.5% · 30yr
- Down + closing
- —
- Monthly P&I
- —
- Monthly cashflow
- —
- DSCR
- —
- Eligible?
- —
No personal income docs; deal must DSCR.
Hard money
10% down · 12.0% · 12mo
- Down + closing
- —
- Monthly P&I
- —
- Monthly cashflow
- —
- DSCR
- —
- Eligible?
- —
Short-term bridge; refi at stabilization.
Rent comps 12 comps
| Address | Beds | Baths | Sqft | Rent | $/sqft | DOM | Units | Dist |
|---|---|---|---|---|---|---|---|---|
| 6910 Humboldt Ave N Minneapolis, MN | 1.0–2.0 | 1.0 | 775 | $1,450 | $1.87 | 2d | 9 | 1.11mi |
| 6844 Grimes Pl N Brooklyn Center, MN | 3.0 | 1.0 | 1000 | $1,850 | $1.85 | 44d | 1 | 1.17mi |
| 6808 Grimes Pl N Brooklyn Center, MN | 3.0 | 1.0 | 1000 | $1,850 | $1.85 | 15d | 1 | 1.18mi |
| 6817 Grimes Pl N Brooklyn Center, MN | 3.0 | 1.0 | 1000 | $1,850 | $1.85 | 44d | 1 | 1.20mi |
| 6813 Grimes Pl N Brooklyn Center, MN | 3.0 | 1.0 | 1000 | $1,850 | $1.85 | 13d | 2 | 1.21mi |
| 1100 69th Ave N Unit 101 Brooklyn Center, MN | 1.0 | 1.0 | 675 | $1,095 | $1.62 | 18d | 1 | 1.28mi |
| 7021 Brooklyn Blvd Unit 7021-219 Brooklyn Center, MN | 1.0 | 1.0 | 725 | $1,149 | $1.58 | 44d | 1 | 1.36mi |
| 7021 Brooklyn Blvd Unit 7021-216 Brooklyn Center, MN | 2.0 | 1.0 | 825 | $1,399 | $1.70 | 44d | 1 | 1.36mi |
| 7206 Camden Ave N Unit 115 Minneapolis, MN | 2.0 | 1.0 | 770 | $1,195 | $1.55 | 15d | 1 | 1.42mi |
| 7206 Camden Ave N Unit 213 Minneapolis, MN | 2.0 | 1.0 | 770 | $1,225 | $1.59 | 24d | 1 | 1.42mi |
| 3417 65th Ave N Unit 06_102 Brooklyn Center, MN | 2.0 | 1.0 | 850 | $1,449 | $1.70 | 44d | 1 | 1.43mi |
| 3417 65th Ave N Minneapolis, MN | 2.0 | 1.0 | 850 | $1,425 | $1.68 | 44d | 1 | 1.43mi |
HOA detail condo
- Monthly dues
- $251 · $3,012/yr
- Assessments
- None detected in remarks — confirm with the listing agent.
Listing history 4 events
-
2026-05-27status Pending
-
2026-05-20$119,900 Active
-
1995-12-29soldstatus $53,500
-
1995-12-12soldstatus $53,500
ⓘ Source: listings_history table (triggers on properties + properties_extension) + one-shot
backfill from property_details.listing_events for pre-trigger history.
Tax reassessment forecast MN · Partial reset (capped growth)
- Current annual tax
- $1,956 · $163/mo
- Projected year-2 tax
- $1,956 · $163/mo
- Expected delta
- $0/yr ($0/mo · 0.0%)
ⓘ Screening estimate from a state-policy table — verify with the county assessor before closing.
Climate risk First Street
- Flood 1/10 Low FEMA zone X (unshaded) · 0% chance over 30 yrs
- Wildfire 2/10 Low
- Heat 2/10 Low 7 d/yr ≥100°F today · 14 d/yr by 30 yrs out
- Wind 2/10 Low
- Air quality 2/10 Low 2 unhealthy d/yr today · 2 by 30 yrs out
Nearby sold comps map
Loading sold comps map…
Walkable amenities ~0.75 mi
Loading nearby amenities…
Taxation est. · year 1
- Rental income
- $17,885
- − Mortgage interest
- −$6,716
- − Property taxes
- −$1,956
- − Insurance
- −$600
- − Repairs & maintenance
- −$1,431
- − Management
- −$1,431
- − HOA
- −$3,012
- − Depreciation
- −$3,488
- Taxable loss
- −$749
- Est. tax savings @ 24.0%
- +$180
- After-tax cash flow
- $1,196/yr
For passive investors: Depreciation is non-cash, so a rental often shows a tax loss while cash-flowing — sheltering income. Rental losses are passive: they offset passive income freely, and up to $25,000/yr can offset ordinary (W-2) income if you actively participate and your MAGI is under $100k (phasing out to $0 by $150k); unused losses carry forward. On sale, claimed depreciation is recaptured at up to 25%, and gains may owe capital-gains tax (a 1031 exchange can defer both). Figures are a year-1 estimate at your 24.0% rate — not tax advice; consult a CPA.
Schools (NCES district)
- District
- Osseo Public School District
- NCES district ID
- 2725200
- Math proficiency
- 42% ▼ -7.00%
- Reading proficiency
- 51% ▼ -4.00%
- Median HH income
- $76,168
- Composite
- 42.35/100
- National rank
- #3250
- State rank
- #129 of 301 in MN
Livability — Brooklyn Park
- Score
- 81/100
- State rank
- #50
- US rank
- #1308
Category grades
Schools grade is shown separately in the Schools card above.
Census & demographics
- Census place
- Brooklyn Park, MN
- City population
- 33,660
- Population (ZIP)
- 17,428
Population outlook (Hennepin County) Hauer SSP2
- Today (2025)
- 1,405,227 people
- By 2030
- 1,492,650 · +6.2%
- By 2040
- 1,660,157 · +18.1%
- By 2050
- 1,823,498 · +29.8%
- By 2075
- 2,221,283 · +58.1%
- By 2100
- 2,509,976 · +78.6%
Race, ethnicity, and origin ACS 2023
- Neighborhood character
- Highly diverse neighborhood (Simpson 0.74)
- Race & ethnicity
- White 35% Asian 27% Black 25% Two or more races 9% Hispanic / Latino 4%
- Common ancestry
- Portuguese 5% Italian 2% Romanian 1%
- Foreign-born
- 24% · Canada, Vietnam
- Languages at home
- 64% English-only · Other Asian/Pacific 20% Spanish 3% Vietnamese 1%
Political lean MEDSL · Hennepin
- 2024 margin
- Solid D (+42.6) · D 70.2% · R 27.5% · Other 2.3%
- 2008→2024 swing
- +14.0pp toward D · 2008: 28.6pp · 2024: 42.6pp
- All cycles
- 2024: D+42.6 2020: D+43.2 2016: D+35.3 2012: D+27.1 2008: D+28.6
Not yet ingested
- Civics
- —
Market trends
- HPI YoY
- ▼ -263.18%
- Current HPI
- 242.8606
- Rent YoY
- —
- Metro
- —
- State GDP YoY
- ▲ 2.41%
- F500 in state
- 34
Industry mix (Fortune 500 HQ in MN)
| Industry | F500 HQs | Revenue |
|---|---|---|
| Healthcare | 2 | $407B |
|
||
| Retail | 2 | $150B |
|
||
| Consumer Goods | 2 | $32B |
|
||
| Industrial Machinery | 2 | $6B |
|
||
| Agriculture | 1 | $40B |
|
||
| Healthcare / Medical Devices | 1 | $32B |
|
||
Price history
+124.1% since first listed4 events — show timeline
- 2026-05-27 Pending — NORTHSTARMLS as Distributed by MLS Grid
- 2026-05-20 Listed $119,900 NORTHSTARMLS as Distributed by MLS Grid
- 1995-12-29 Sold (Public Records) $53,500 Public Records
- 1995-12-12 Sold (Public Records) $53,500 Public Records
Property tax history
+4.4%/yrLatest (2025): $1,956 · +1.5% YoY. Source: county tax records.
Cash-flow waterfall
monthlySold comps — $/sqft
last 12 mo · ≤1 miLoading sold comps…