10311 Cedar Lake Rd #103 · Minnetonka, MN
Flood risk 7/10 · Major
- FEMA flood zone
- X (unshaded)
- Chance of flooding over 30 yrs
- 0.78%
- Est. flood insurance / yr
- $507 – $1,088
Fire risk 1/10 · Minimal
- Est. fire insurance / yr
- $888 – $1,650
Heat risk 2/10 · Minimal
- Hot days now (above 98°F)
- 7 days/yr
- Hot days in 30 yrs
- 14 days/yr
Wind risk 2/10 · Minimal
- Chance of severe wind over 30 yrs
- —
Air-quality risk 2/10 · Minimal
- Unhealthy air days now
- 2 days/yr
- Unhealthy air days in 30 yrs
- 2 days/yr
Risk factors via First Street. Map © Google.
Why this score? — see what drove the D- grade
The composite is a weighted blend of 9 inputs, each scored 0–100. Each bar is that input's sub-score; the figure is the points it added to the 100-point composite (weight × sub-score).
- ARV discount +7.5/15.0
- Cash flow +7.1/30.0
- 1% rule +6.0/10.0
- Schools +4.6/10.0
- Livability +3.8/5.0
- Rent growth +3.3/5.0
- Condition / age +2.5/5.0
- DSCR +1.3/10.0
- Appreciation +0.0/10.0
$159,900
🖨 Deal sheet 📄 Offer letter ✓ Due diligence
Listing remarks MLS
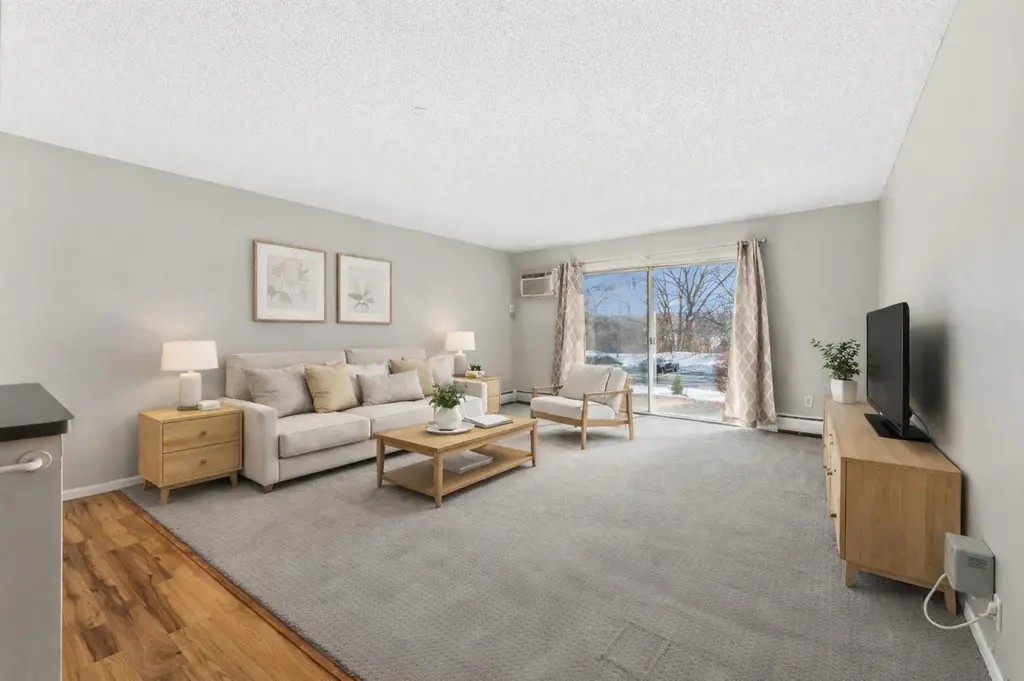
Spacious 2-bed, 2-bath Cedar Lake condo includes spacious living room, patio, open kitchen with stainless steel appliances, informal dining room and walkout patio. Sizable bedrooms, private primary bath with walk-in closet. Shared amenities include pool, hot tub, sauna, entertainment room, heated garage, and more. Recent updates include kitchen appliances, backsplash and countertops. Don't miss this one!
Key facts
- Private primary bath
- Patio
- Informal dining room
Tags
Neighborhood map
What this means for you Summary
Snapshot
- This is a 2-bed/2.0-bath condo listed at $160k.
Deal economics
- At list price, monthly cash flow is $-295 ($-4k/yr) — negative.
- To cash-flow at today's rent, offer at most $108k (32.6% below list).
- Meets the 1% rule at list price ($2k rent vs $160k).
- Recommended offer: $108k (32.6% below list) — sets the bar for cash-flow.
- Cap rate 4.6% vs local median 2.5% in Minnetonka — top-decile yield for the area; either an underpriced asset or a hidden risk that comps aren't pricing in. Stress-test before assuming the spread holds.
Location & tenants
- Location reads 75/100 on livability (#187 in MN, #3,994 nationally) — a middle-class / working-renter tenant base. Strengths: schools A+, employment A+, housing A+; Watch: amenities F, cost of living F, health & safety F.
- Hopkins Public School District (suburban): math 48% / reading 57% proficiency, ranked #75 of 301 in MN (top 25%) — acceptable for families but not a draw, mixed tenant base, ~2y average lease.
- Market conditions: Rents rising (+3.3%/yr); 123 active listings in the ZIP; 34 comparable units currently listed for rent nearby; rentals leasing fast (median 5d on market — plan ~1-2 weeks tenant-placement turnaround); solid renter incomes; 4,651 units permitted in Hennepin County in 2024 (2,443 in 5+ unit buildings).
Forward outlook
- Local home prices are declining (-3.0%/yr); year-one equity from $1k of loan paydown is wiped out by about $5k of value loss. Plan a longer hold.
- Hennepin County population projected at +30% by 2050 — long-run rental-demand tailwind backs the buy-and-hold thesis.
Negotiation context
- Only 14 days on market — expect competitive offers; lowballing is unlikely to land.
- 9 sale attempts since 32y ago with the ask held roughly flat each time — persistent listings suggest the price (not the market) is what's stuck; bring a comps-based counter.
Risks & watch-outs
- Watch-outs: flood insurance adds $66/mo; HOA is 32% of rent.
- Climate carrying-cost: major flood risk — expect insurance premiums to compound above CPI over the hold.
Questions for the listing agent
- What do current leases actually rent for vs. the listed asking? Can we see a recent rent roll and the last 12 months of T-12 income?
- Built in 1969 — when were the roof, HVAC, electrical panel, plumbing, and water heater last replaced?
- What's the actual annual flood-insurance premium (NFIP or private), and is the property in a SFHA with mandatory coverage?
- What does the HOA fee cover, when was the last increase, and are there any pending special assessments or reserve-fund shortfalls?
- Any open or pending special assessments — roof, HVAC, plumbing, elevator, façade? What's the per-unit balance and payoff schedule, and is the seller paying it off at close or rolling it to the buyer?
- Is there a deadline driving the sale (1031 exchange, divorce, estate, relocation)? That informs how much negotiation room exists.
- Schools are A-rated — typically a magnet for longer-tenancy family renters. What's the average tenant stay here, and is there a school-zone premium baked into asking?
- The area grade is low — what's the realistic commute time and amenity access for the typical tenant pool here? Any planned neighborhood developments (good or bad) we should know about?
- What's the average days-on-market for RENTAL listings here right now (not sales)? A rising rental-DOM trend means longer vacancies and softer asking-rent achievability than the comps imply.
- What's the recent tenant-quality profile in this submarket — average credit score on applications, eviction rate, late-payment / NSF rate, and stable-employment percentage? A property-management company in the area should have these aggregated.
- How much new apartment / multifamily construction is in the pipeline within 1–3 miles? Heavy new supply (>2% of stock underway) typically softens rents 12–24 months out; light construction supports rent growth.
Investment metrics
- 1% rule
- 1.10% ✓
- Cap rate
- 4.58%
- Cash-on-cash
- -6.12%
- DSCR
- 0.73
- GRM
- 7.6
CMA / ARV
- ARV (median comp)
- $378,172
- List price
- $159,900
- Delta
- -56.37%
- Verdict
- UNDERPRICED
- Comps
- 1 within 2.0 mi
Projected returns pro-forma
-3.0% appreciation · 3.28% rent growth · sell at horizon
- IRR
- -29.2%
- Equity multiple
- 0.02×
- Total profit
- $-43,811
- Equity at exit
- $23,842
- IRR
- -26.5%
- Equity multiple
- -0.31×
- Total profit
- $-58,731
- Equity at exit
- $13,825
Cash invested: $44,772 (down + closing). Projections, not guarantees.
Landlord ↔ Tenant lean methodology
- Overall (STATE)
- 46 Balanced
- State Minnesota
- 46 Balanced · D+2
- County
- — inherits STATE
- City
- — inherits STATE
ZIP-level market 55305
- Rents YoY
- 3.3%
- Active inventory
- 123
- Price-to-rent
- 7.6×
Monthly cashflow live
- Estimated rent
- $1,757 high interval (Pro) →
- Mortgage (P&I)
- −$839
- Tax from tax record
- −$141 /mo · $1,695/yr
- Insurance
- −$67
- Flood insurance flood zone
- −$66 /mo · $798/yr
- HOA
- −$570
- Vacancy / Maint / Mgmt
- −$369
- Net cashflow
- $-295
Break-even live
UW: 25.0% down · 7.5% · 30yr · 1.5% tax · 5.0% vac · 8.0% maint · 8.0% mgmt
Financing live
Cash to close
- Down payment
- $39,975
- Closing costs
- $4,797
- Reserves months
- —
- Total cash needed
- —
Loan-product check · same deal, 3 products live
Conventional
25% down · 7.5% · 30yr
- Down + closing
- —
- Monthly P&I
- —
- Monthly cashflow
- —
- DSCR
- —
- Eligible?
- —
Personal DTI + credit; lowest rate.
DSCR
20% down · 8.5% · 30yr
- Down + closing
- —
- Monthly P&I
- —
- Monthly cashflow
- —
- DSCR
- —
- Eligible?
- —
No personal income docs; deal must DSCR.
Hard money
10% down · 12.0% · 12mo
- Down + closing
- —
- Monthly P&I
- —
- Monthly cashflow
- —
- DSCR
- —
- Eligible?
- —
Short-term bridge; refi at stabilization.
Rent comps 34 comps
| Address | Beds | Baths | Sqft | Rent | $/sqft | DOM | Units | Dist |
|---|---|---|---|---|---|---|---|---|
| 10201 Cedar Lake Rd S Unit 201-101 Minnetonka, MN | 2.0 | 1.5 | 1038 | $1,499 | $1.44 | 17d | 1 | 0.06mi |
| 10411 Cedar Lake Rd #312 Hopkins, MN | 2.0 | 2.0 | 1196 | $1,770 | $1.48 | 43d | 1 | 0.15mi |
| 2828 Jordan Ave S Minnetonka, MN | 1.0–3.0 | 1.0–2.0 | 1008 | $1,859 | $1.84 | 4d | 9 | 0.38mi |
| 9700 Waterstone Pl Hopkins, MN | 2.0 | 1.0–2.0 | 909 | $2,233 | $2.46 | 1d | 15 | 0.63mi |
| 10100 Minnetonka Blvd Hopkins, MN | 2.0 | 1.0 | 950 | $1,400 | $1.47 | 43d | 1 | 0.64mi |
| 10213 W 34th St Minnetonka, MN | 1.0 | 1.0 | 707 | $1,295 | $1.83 | 3d | 1 | 0.83mi |
| 10213 W 34th St Unit 10213-204 Minnetonka, MN | 2.0 | 1.0 | 948 | $1,850 | $1.95 | 3d | 1 | 0.83mi |
| 10213 W 34th St Unit 10233-103 Minnetonka, MN | 3.0 | 1.0 | 1500 | $1,950 | $1.30 | 43d | 1 | 0.83mi |
| 10213 W 34th St Unit 10213-302 Minnetonka, MN | 2.0 | 1.0 | 948 | $1,995 | $2.10 | 3d | 1 | 0.83mi |
| 10213 W 34th St Unit 10233-302 Minnetonka, MN | 2.0 | 1.0 | 953 | $1,650 | $1.73 | 3d | 1 | 0.83mi |
| 10213 W 34th St Unit 10253-103 Minnetonka, MN | 1.0 | 1.0 | 707 | $1,350 | $1.91 | 4d | 1 | 0.83mi |
| 10213 W 34th St Unit 10213-202 Minnetonka, MN | 2.0 | 1.0 | 948 | $1,795 | $1.89 | 3d | 1 | 0.83mi |
| 10213 W 34th St Unit 10233-304 Minnetonka, MN | 1.0 | 1.0 | 700 | $1,350 | $1.93 | 3d | 1 | 0.83mi |
| 3620 Independence Ave S St Louis Park, MN | 2.0 | 2.5 | 1307 | $2,250 | $1.72 | 43d | 1 | 1.10mi |
| 3033 Xylon Ave S Minneapolis, MN | 2.0 | 1.0 | 837 | $1,262 | $1.51 | 4d | 2 | 1.26mi |
| 8824 W 35th St Unit 9 Minneapolis, MN | 1.0 | 1.0 | 700 | $1,065 | $1.52 | 24d | 1 | 1.30mi |
| 8817 W 35th St Minneapolis, MN | 1.0–2.0 | 1.0 | 787 | $1,350 | $1.71 | 4d | 2 | 1.31mi |
| 8216 W 31st St Unit 07 Minneapolis, MN | 2.0 | 1.0 | 950 | $1,250 | $1.32 | 24d | 1 | 1.33mi |
| 8216 W 31st St Unit 08 Minneapolis, MN | 2.0 | 1.0 | 950 | $1,250 | $1.32 | 4d | 1 | 1.33mi |
| 1919 Ymca Ln Hopkins, MN | 1.0–2.0 | 1.0–2.0 | 1023 | $2,180 | $2.13 | 1d | 5 | 1.35mi |
| 8201 W 30 1/2 St Minneapolis, MN | 2.0 | 1.0 | 850 | $1,295 | $1.52 | 4d | 1 | 1.35mi |
| 3544 Aquila Cir Unit 8 St Louis Park, MN | 2.0 | 1.0 | 800 | $1,299 | $1.62 | 43d | 1 | 1.35mi |
| 704 Robinwood Ln Hopkins, MN | 3.0 | 2.0 | 1200 | $2,095 | $1.75 | 21d | 1 | 1.38mi |
| 3601 Phillips Pkwy Minneapolis, MN | 3.0 | 1.0–2.0 | 920 | $2,122 | $2.31 | 1d | 9 | 1.39mi |
| 3055 Virginia Ave S Unit 3063-18 St Louis Park, MN | 1.0 | 1.0 | 700 | $1,075 | $1.54 | 4d | 1 | 1.39mi |
| 3063 Virginia Ave S Minneapolis, MN | 1.0 | 1.0 | 700 | $1,075 | $1.54 | 4d | 1 | 1.39mi |
| 3101 Virginia Ave S Minneapolis, MN | 2.0 | 1.0–1.5 | 850 | $1,360 | $1.60 | 1d | 4 | 1.40mi |
| 3117 Virginia Ave S Unit 102 Minneapolis, MN | 2.0 | 1.0 | 970 | $1,425 | $1.47 | 43d | 1 | 1.42mi |
| 9920 Wayzata Blvd Minneapolis, MN | 2.0 | 1.0–2.5 | 942 | $3,236 | $3.43 | 1d | 28 | 1.42mi |
| 1155 Ford Rd #307 Minneapolis, MN | 1.0 | 1.0 | 1403 | $1,900 | $1.35 | 12d | 1 | 1.42mi |
| 1301 Highway 7 Hopkins, MN | 1.0–2.0 | 1.0 | 786 | $1,910 | $2.43 | 1d | 14 | 1.43mi |
| 7920 Minnetonka Blvd Minneapolis, MN | 2.0 | 1.0–2.0 | 865 | $2,902 | $3.35 | 1d | 13 | 1.47mi |
| 460 5th Ave N Hopkins, MN | 1.0–2.0 | 1.0–2.0 | 1003 | $1,565 | $1.56 | 3d | 6 | 1.49mi |
| 11700 Wayzata Blvd Hopkins, MN | 1.0–3.0 | 1.0–2.0 | 1170 | $2,740 | $2.34 | 1d | 14 | 1.49mi |
HOA detail condo
- Monthly dues
- $570 · $6,840/yr
- Likely covers
- pool
- Assessments
- None detected in remarks — confirm with the listing agent.
Listing history 41 events
-
2026-06-18days on market $159,900 Active 14 DOM
-
2026-06-17days on market $159,900 Active 13 DOM
-
2026-06-16days on market $159,900 Active 12 DOM
-
2026-06-15days on market $159,900 Active 11 DOM
-
2026-06-13days on market $159,900 Active 9 DOM
-
2026-06-13days on market $159,900 Active 8 DOM
-
2026-06-09days on market $159,900 Active 5 DOM
-
2026-06-08days on market $159,900 Active 4 DOM
-
2026-06-07pricedays on market $159,900 Active 3 DOM
-
2026-06-04days on market $165,000 Active 140 DOM
-
2026-06-03days on market $165,000 Active 139 DOM
-
2026-06-02days on market $165,000 Active 138 DOM
-
2026-06-01days on market $165,000 Active 137 DOM
-
2026-05-31days on market $165,000 Active 136 DOM
-
2026-01-16$165,000 Active 407-char remark
Show marketing remark (407 chars)
Spacious 2-bed, 2-bath Cedar Lake condo includes spacious living room, patio, open kitchen with stainless steel appliances, informal dining room and walkout patio. Sizable bedrooms, private primary bath with walk-in closet. Shared amenities include pool, hot tub, sauna, entertainment room, heated garage, and more. Recent updates include kitchen appliances, backsplash and countertops. Don't miss this one!
-
2026-01-15historical $165,000 407-char remark
Show marketing remark (407 chars)
Spacious 2-bed, 2-bath Cedar Lake condo includes spacious living room, patio, open kitchen with stainless steel appliances, informal dining room and walkout patio. Sizable bedrooms, private primary bath with walk-in closet. Shared amenities include pool, hot tub, sauna, entertainment room, heated garage, and more. Recent updates include kitchen appliances, backsplash and countertops. Don't miss this one!
-
2025-01-01historical
-
2024-10-25$165,000 Active
-
2024-10-24historical
-
2021-03-12soldstatus $140,000
-
2017-10-31soldstatus $127,500
-
2017-10-12soldstatus $127,500 Sold
-
2017-09-28status Pending
-
2017-09-11historical Contingent - Inspection
-
2017-08-29$129,500 Active
-
2011-04-07soldstatus $55,000
-
2011-03-02historical
-
2011-01-14$61,875
-
2010-08-11historical
-
2010-06-15$79,900
-
2010-06-14historical
-
2010-03-15$79,900
-
2003-04-01soldstatus $118,000
-
1997-12-04soldstatus $70,000
-
1997-10-29soldstatus $72,900
-
1997-09-06historical
-
1997-09-05$72,900
-
1997-09-05historical
-
1997-07-07$72,900
-
1994-08-16soldstatus $57,900
-
1994-08-09$57,900
ⓘ Source: listings_history table (triggers on properties + properties_extension) + one-shot
backfill from property_details.listing_events for pre-trigger history.
Tax reassessment forecast MN · Partial reset (capped growth)
- Current annual tax
- $1,695 · $141/mo
- Projected year-2 tax
- $1,743 · $145/mo
- Expected delta
- +$48/yr (+$4/mo · 2.8%)
ⓘ Screening estimate from a state-policy table — verify with the county assessor before closing.
Climate risk First Street
- Flood 7/10 Severe FEMA zone X (unshaded) · 78% chance over 30 yrs
- Wildfire 1/10 Low
- Heat 2/10 Low 7 d/yr ≥98°F today · 14 d/yr by 30 yrs out
- Wind 2/10 Low
- Air quality 2/10 Low 2 unhealthy d/yr today · 2 by 30 yrs out
Nearby sold comps map
Loading sold comps map…
Walkable amenities ~0.75 mi
Loading nearby amenities…
Taxation est. · year 1
- Rental income
- $21,084
- − Mortgage interest
- −$8,957
- − Property taxes
- −$1,695
- − Insurance
- −$1,597
- − Repairs & maintenance
- −$1,687
- − Management
- −$1,687
- − HOA
- −$6,840
- − Depreciation
- −$4,652
- Taxable loss
- −$6,030
- Est. tax savings @ 24.0%
- +$1,447
- After-tax cash flow
- $-2,091/yr
For passive investors: Depreciation is non-cash, so a rental often shows a tax loss while cash-flowing — sheltering income. Rental losses are passive: they offset passive income freely, and up to $25,000/yr can offset ordinary (W-2) income if you actively participate and your MAGI is under $100k (phasing out to $0 by $150k); unused losses carry forward. On sale, claimed depreciation is recaptured at up to 25%, and gains may owe capital-gains tax (a 1031 exchange can defer both). Figures are a year-1 estimate at your 24.0% rate — not tax advice; consult a CPA.
Schools (NCES district)
- District
- Hopkins Public School District
- NCES district ID
- 2714260
- Math proficiency
- 48% ▼ -6.00%
- Reading proficiency
- 57% ▼ -2.00%
- Median HH income
- $66,915
- Composite
- 46.44/100
- National rank
- #2448
- State rank
- #75 of 301 in MN
Livability — Minnetonka
- Score
- 75/100
- State rank
- #187
- US rank
- #3994
Category grades
Schools grade is shown separately in the Schools card above.
Census & demographics
- Census place
- Minnetonka, MN
- County
- Hennepin County · 1,150,272 people
- City population
- 41,857
- Metro
- Minneapolis-St. Paul-Bloomington, MN-WI
- Population (ZIP)
- 21,068
- Household income
- $104,914
- Rent vs Own
- Severe rent burden
- 949.0
Population outlook (Hennepin County) Hauer SSP2
- Today (2025)
- 1,405,227 people
- By 2030
- 1,492,650 · +6.2%
- By 2040
- 1,660,157 · +18.1%
- By 2050
- 1,823,498 · +29.8%
- By 2075
- 2,221,283 · +58.1%
- By 2100
- 2,509,976 · +78.6%
Race, ethnicity, and origin ACS 2023
- Neighborhood character
- Predominantly White (78%)
- Race & ethnicity
- White 78% Asian 10% Two or more races 5% Hispanic / Latino 4% Black 4%
- Common ancestry
- Portuguese 11% Lithuanian 3% Romanian 3%
- Foreign-born
- 14% · Canada, China, South Korea
- Languages at home
- 84% English-only · Other Asian/Pacific 6% Other Indo-European 2% Spanish 2%
Political lean MEDSL · Hennepin
- 2024 margin
- Solid D (+42.6) · D 70.2% · R 27.5% · Other 2.3%
- 2008→2024 swing
- +14.0pp toward D · 2008: 28.6pp · 2024: 42.6pp
- All cycles
- 2024: D+42.6 2020: D+43.2 2016: D+35.3 2012: D+27.1 2008: D+28.6
Not yet ingested
- Civics
- —
Market trends
- HPI YoY
- ▼ -358.96%
- Current HPI
- 231.3421
- Rent YoY
- ▲ 3.28%
- Metro
- Minneapolis-St. Paul-Bloomington, MN-WI
- State GDP YoY
- ▲ 2.41%
- F500 in state
- 34
Industry mix (Fortune 500 HQ in MN)
| Industry | F500 HQs | Revenue |
|---|---|---|
| Healthcare | 2 | $407B |
|
||
| Retail | 2 | $150B |
|
||
| Consumer Goods | 2 | $32B |
|
||
| Industrial Machinery | 2 | $6B |
|
||
| Agriculture | 1 | $40B |
|
||
| Healthcare / Medical Devices | 1 | $32B |
|
||
Price history
+185.0% since first listed27 events — show timeline
- 2026-01-16 Listed $165,000 NORTHSTARMLS as Distributed by MLS Grid
- 2026-01-15 Coming Soon $165,000 NORTHSTARMLS as Distributed by MLS Grid
- 2025-01-01 Listing Removed — NORTHSTARMLS as Distributed by MLS Grid
- 2024-10-25 Listed $165,000 NORTHSTARMLS as Distributed by MLS Grid
- 2024-10-24 Coming Soon — NORTHSTARMLS as Distributed by MLS Grid
- 2021-03-12 Sold (Public Records) $140,000 Public Records
- 2017-10-31 Sold (Public Records) $127,500 Public Records
- 2017-10-12 Sold (MLS) $127,500 NORTHSTARMLS as Distributed by MLS Grid
- 2017-09-28 Pending — NORTHSTARMLS as Distributed by MLS Grid
- 2017-09-11 Contingent — NORTHSTARMLS as Distributed by MLS Grid
- 2017-08-29 Listed $129,500 NORTHSTARMLS as Distributed by MLS Grid
- 2011-04-07 Sold (MLS) $55,000 NORTHSTARMLS as Distributed by MLS Grid
- 2011-03-02 Listing Removed — NORTHSTARMLS as Distributed by MLS Grid
- 2011-01-14 Listed $61,875 NORTHSTARMLS as Distributed by MLS Grid
- 2010-08-11 Listing Removed — NORTHSTARMLS as Distributed by MLS Grid
- 2010-06-15 Listed $79,900 NORTHSTARMLS as Distributed by MLS Grid
- 2010-06-14 Listing Removed — NORTHSTARMLS as Distributed by MLS Grid
- 2010-03-15 Listed $79,900 NORTHSTARMLS as Distributed by MLS Grid
- 2003-04-01 Sold (Public Records) $118,000 Public Records
- 1997-12-04 Sold (Public Records) $70,000 Public Records
- 1997-10-29 Sold (MLS) $72,900 NORTHSTARMLS as Distributed by MLS Grid
- 1997-09-06 Listing Removed — NORTHSTARMLS as Distributed by MLS Grid
- 1997-09-05 Listing Removed — NORTHSTARMLS as Distributed by MLS Grid
- 1997-09-05 Listed $72,900 NORTHSTARMLS as Distributed by MLS Grid
- 1997-07-07 Listed $72,900 NORTHSTARMLS as Distributed by MLS Grid
- 1994-08-16 Sold (MLS) $57,900 NORTHSTARMLS as Distributed by MLS Grid
- 1994-08-09 Listed $57,900 NORTHSTARMLS as Distributed by MLS Grid
Property tax history
+6.2%/yrLatest (2025): $1,695 · -12.7% YoY. Source: county tax records.
Cash-flow waterfall
monthlySold comps — $/sqft
last 12 mo · ≤1 miLoading sold comps…