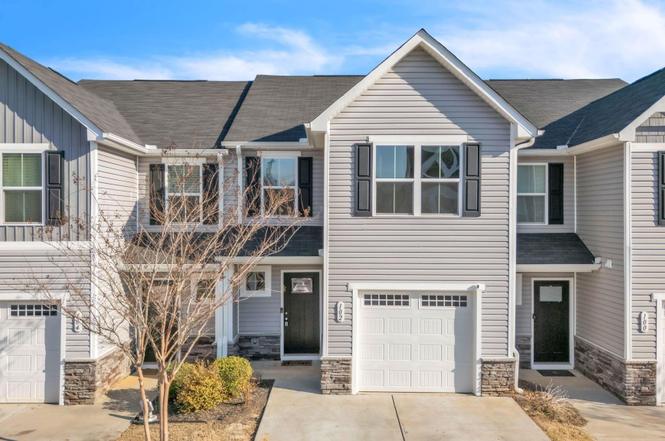
102 Englefield Dr · Fountain Inn, SC
Flood risk 1/10 · Minimal
- FEMA flood zone
- X (unshaded)
- Chance of flooding over 30 yrs
- 0.0%
- Est. flood insurance / yr
- $507 – $1,088
Fire risk 4/10 · Minor
- Est. fire insurance / yr
- $783 – $1,453
Heat risk 6/10 · Moderate
- Hot days now (above 104°F)
- 7 days/yr
- Hot days in 30 yrs
- 17 days/yr
Wind risk 2/10 · Minimal
- Chance of severe wind over 30 yrs
- 3.0%
Air-quality risk 3/10 · Minor
- Unhealthy air days now
- 3 days/yr
- Unhealthy air days in 30 yrs
- 3 days/yr
Risk factors via First Street. Map © Google.
Why this score? — see what drove the D+ grade
The composite is a weighted blend of 9 inputs, each scored 0–100. Each bar is that input's sub-score; the figure is the points it added to the 100-point composite (weight × sub-score).
- ARV discount +15.0/15.0
- Cash flow +7.9/30.0
- Appreciation +5.0/10.0
- Schools +4.2/10.0
- Livability +4.1/5.0
- 1% rule +2.9/10.0
- Rent growth +2.5/5.0
- Condition / age +2.5/5.0
- DSCR +2.0/10.0
$215,000
🖨 Deal sheet 📄 Offer letter ✓ Due diligence
Listing remarks
Built in 2021, this well-maintained 3-bedroom, 2-bath townhome offers a thoughtful layout and modern finishes throughout. The home includes a 1-car garage and a full suite of stainless steel appliances that convey with the property. Located in Fountain Inn, it provides convenient access to both Downtown Fountain Inn and Downtown Simpsonville, offering shopping, dining, and entertainment just minutes away. With quick and easy access to I-385, commuting to surrounding areas is simple and efficient. This townhome is an excellent opportunity for comfortable, low-maintenance living in a desirable location.
Key facts
- Desirable location
- $200 HOA
- Garage
Tags
Property features AI
Finance
- HOA & community: Homeowners association in place; HOA covers exterior maintenance, lawn maintenance, street lights, termite contract, and enforces restrictive covenants; Community amenities include common areas, lighting, some sidewalks, and pets allowed
Exterior
- Parking: Attached 1-car garage; Paved driveway; Garage provides storage space
- Utilities: Public water; Public sewer; Public garbage pickup; Gas water heater; Natural gas available; Attached garage (power available through property utilities)
- Home design: Two-story residential home; Built in 2021; Built by Ryan Homes; Slab foundation
- Construction: Vinyl siding exterior; Composition shingle roof; Slab foundation; Constructed in 2021
- Exterior features: Composition shingle roof; Vinyl siding; Lot described as Other/See Remarks; Approximately 1/2 acre or less lot
Interior
- Kitchen: Dishwasher; Refrigerator; Electric cooktop; Built-in microwave
- Bedrooms: Primary bedroom on the 2nd level (approx. 11 x 18); Second bedroom approx. 10 x 13; Third bedroom approx. 9 x 13
- Flooring: Vinyl
- Bathrooms: Two full bathrooms; One half bathroom
- Heating & cooling: Natural gas heating; Central forced cooling; Gas water heater
- Interior features: Granite countertops; Open floor plan; No fireplace
- Laundry & utility: Laundry on 2nd floor
Neighborhood map
What this means for you Summary
Snapshot
- This is a 3-bed/2.5-bath single-family listed at $215k.
Deal economics
- At list price, monthly cash flow is $-230 ($-3k/yr) — negative.
- To cash-flow at today's rent, offer at most $174k (18.9% below list).
- To meet the 1% rule (rent ≥ 1% of price), the offer needs to be $170k (21.1% below list).
- Recommended offer: $170k (21.1% below list) — sets the bar for 1% rule.
Location & tenants
- Location reads 82/100 on livability (#4 in SC, #1,162 nationally) — a professional / high-income tenant draw. Strengths: crime A+, cost of living A+, housing A+; Watch: commute F.
- Greenville 01 (suburban): math 44% / reading 54% proficiency, ranked #10 of 80 in SC (top 12%) — families likely to look elsewhere, expect single-tenant / working-renter base with shorter leases.
- Zoned schools: Fountain Inn Elementary (math 48% / reading 47%, grade D, #199 of 597 statewide, top 35%, 835 students, 100% FRL) — zoned schools average 100% FRL vs 42% district-wide (58 pts higher); higher-poverty schools than district average — tighter screening recommended.
- Market conditions: 1 active listings in the ZIP; 11 comparable units currently listed for rent nearby; rentals leasing fast (median 3d on market — plan ~1-2 weeks tenant-placement turnaround); 5,595 units permitted in Greenville County in 2024 (566 in 5+ unit buildings).
Forward outlook
- In year one you build about $8k of equity ($1k loan paydown + $6k appreciation (3.0% local appreciation)).
- Greenville County population projected at +34% by 2050 — long-run rental-demand tailwind backs the buy-and-hold thesis.
- By year 5, paydown + projected appreciation supports a ~$34k cash-out refi (75% LTV) — recoverable capital for the next deal without selling this one.
Negotiation context
- It's been on market 128 days — a 12% lower offer ($189k) is reasonable based on typical stale-listing flexibility.
- 2 sale attempts since 5y ago; this cycle's ask has dropped $30k (12%) from the opening price — seller is motivated, your offer sets the floor, not the list.
Risks & watch-outs
- Climate carrying-cost: extreme-heat days projected 7→17/yr by 2055 (HVAC capex compounding) — expect insurance premiums to compound above CPI over the hold.
Questions for the listing agent
- What do current leases actually rent for vs. the listed asking? Can we see a recent rent roll and the last 12 months of T-12 income?
- It's been on market 128 days. Have you received any prior offers? Is the seller open to a 21% concession, seller financing, or rate buy-down credit?
- What does the HOA fee cover, when was the last increase, and are there any pending special assessments or reserve-fund shortfalls?
- Why hasn't it sold? Are there any deal-killer items the seller is aware of (foundation, flood, title, zoning, code violations)?
- Is there a deadline driving the sale (1031 exchange, divorce, estate, relocation)? That informs how much negotiation room exists.
- The area grade is low — what's the realistic commute time and amenity access for the typical tenant pool here? Any planned neighborhood developments (good or bad) we should know about?
- What's the average days-on-market for RENTAL listings here right now (not sales)? A rising rental-DOM trend means longer vacancies and softer asking-rent achievability than the comps imply.
- What's the recent tenant-quality profile in this submarket — average credit score on applications, eviction rate, late-payment / NSF rate, and stable-employment percentage? A property-management company in the area should have these aggregated.
- How much new for-sale + rental construction is in the pipeline within 1–3 miles? Heavy new supply typically softens prices + rents 12–24 months out; constrained supply supports both.
Investment metrics
- 1% rule
- 0.79% ✗
- Cap rate
- 5.01%
- Cash-on-cash
- -4.59%
- DSCR
- 0.80
- GRM
- 10.6
CMA / ARV
- ARV (on-the-fly)
- $384,826
- Comps found
- 2
Show comp detail 2 sales within ~0.75 mi
| Address | Dist | Beds/Ba | Sqft | Sold | Price | $/sf | Match |
|---|---|---|---|---|---|---|---|
| 203 Moorish Cir | 0.59mi | 3/2.0 | 1,553 (-0%) | 3mo | $384,179 | $247 | 67 |
| 12 Fortson Way | 0.61mi | 3/2.0 | 1,344 (-14%) | 10mo | $270,000 | $201 | 38 |
Match score weights: distance 35% · size 25% · config 20% · recency 20%. Top-matched comps best support the ARV.
Projected returns pro-forma
3.0% appreciation · 3.0% rent growth · sell at horizon
- IRR
- 3.3%
- Equity multiple
- 1.19×
- Total profit
- $11,312
- Equity at exit
- $96,673
- IRR
- 6.6%
- Equity multiple
- 2.01×
- Total profit
- $60,964
- Equity at exit
- $148,985
Cash invested: $60,200 (down + closing). Projections, not guarantees.
Landlord ↔ Tenant lean methodology
- Overall (STATE)
- 90 Strongly Landlord-Friendly
- State South Carolina
- 90 Strongly Landlord-Friendly · R+6
- County
- — inherits STATE
- City
- — inherits STATE
ZIP-level market 29644-1353
- Active inventory
- 1
- Price-to-rent
- 10.6×
Monthly cashflow live
- Estimated rent
- $1,697 high interval (Pro) →
- Mortgage (P&I)
- −$1,127
- Tax from tax record
- −$154 /mo · $1,845/yr
- Insurance
- −$90
- HOA
- −$200
- Vacancy / Maint / Mgmt
- −$356
- Net cashflow
- $-230
Break-even live
UW: 25.0% down · 7.5% · 30yr · 1.5% tax · 5.0% vac · 8.0% maint · 8.0% mgmt
Financing live
Cash to close
- Down payment
- $53,750
- Closing costs
- $6,450
- Reserves months
- —
- Total cash needed
- —
Loan-product check · same deal, 3 products live
Conventional
25% down · 7.5% · 30yr
- Down + closing
- —
- Monthly P&I
- —
- Monthly cashflow
- —
- DSCR
- —
- Eligible?
- —
Personal DTI + credit; lowest rate.
DSCR
20% down · 8.5% · 30yr
- Down + closing
- —
- Monthly P&I
- —
- Monthly cashflow
- —
- DSCR
- —
- Eligible?
- —
No personal income docs; deal must DSCR.
Hard money
10% down · 12.0% · 12mo
- Down + closing
- —
- Monthly P&I
- —
- Monthly cashflow
- —
- DSCR
- —
- Eligible?
- —
Short-term bridge; refi at stabilization.
Rent comps 11 comps
| Address | Beds | Baths | Sqft | Rent | $/sqft | DOM | Units | Dist |
|---|---|---|---|---|---|---|---|---|
| 201 Bryland Way Fountain Inn, SC | 3.0–5.0 | 2.5–3.5 | 2109 | $1,695 | $0.80 | 3d | 30 | 0.15mi |
| 116 Aspen Valley Trl Fountain Inn, SC | 3.0 | 2.5 | 1422 | $1,681 | $1.18 | 3d | 13 | 0.52mi |
| 1216 N Main St Fountain Inn, SC | 2.0 | 2.0 | 1100 | $1,249 | $1.14 | 3d | 1 | 0.82mi |
| 1216 N Main St Fountain Inn, SC | 2.0 | 2.0 | 1100 | $1,245 | $1.13 | 23d | 1 | 0.82mi |
| 1216 N Main St Unit B8 Fountain Inn, SC | 2.0 | 2.5 | 1100 | $1,249 | $1.14 | 3d | 1 | 0.82mi |
| 105 Cobden Ct Simpsonville, SC | 3.0 | 2.5 | 1600 | $1,995 | $1.25 | 23d | 1 | 0.83mi |
| 217 N Nelson Dr Fountain Inn, SC | 3.0–4.0 | 2.5–3.5 | 2115 | $2,100 | $0.99 | 2d | 12 | 1.32mi |
| 101 Fennec Dr Fountain Inn, SC | 3.0 | 3.0 | 1735 | $2,099 | $1.21 | 3d | 1 | 1.34mi |
| 124 Keel Ln Simpsonville, SC | 3.0 | 2.5 | 1587 | $1,800 | $1.13 | 23d | 1 | 1.36mi |
| 104 Keel Ln Unit 1 Fountain Inn, SC | 3.0 | 3.0 | 1310 | $1,660 | $1.27 | 23d | 1 | 1.37mi |
| 7 Gramercy Woods Ln Fountain Inn, SC | 3.0–5.0 | 2.5–3.0 | 1967 | $2,224 | $1.13 | 2d | 13 | 1.38mi |
HOA detail
- Monthly dues
- $200 · $2,400/yr
Listing history 20 events
-
2026-06-18days on market $215,000 Active 128 DOM
-
2026-06-17days on market $215,000 Active 127 DOM
-
2026-06-16days on market $215,000 Active 126 DOM
-
2026-06-15days on market $215,000 Active 125 DOM
-
2026-06-13days on market $215,000 Active 123 DOM
-
2026-06-13days on market $215,000 Active 122 DOM
-
2026-06-10days on market $215,000 Active 120 DOM
-
2026-06-09days on market $215,000 Active 119 DOM
-
2026-06-08days on market $215,000 Active 118 DOM
-
2026-06-07days on market $215,000 Active 117 DOM
-
2026-06-03days on market $215,000 Active 113 DOM
-
2026-06-03days on market $215,000 Active 112 DOM
-
2026-06-01days on market $215,000 Active 111 DOM
-
2026-05-31days on market $215,000 Active 110 DOM
-
2026-04-11price $215,000
-
2026-04-03price $228,000
-
2026-02-10$245,000 Active
-
2021-04-29historical
-
2021-03-27price $199,990
-
2021-02-23$198,990 Active
ⓘ Source: listings_history table (triggers on properties + properties_extension) + one-shot
backfill from property_details.listing_events for pre-trigger history.
Tax reassessment forecast SC · Resets to sale price
- Current annual tax
- $1,845 · $154/mo
- Projected year-2 tax
- $1,845 · $154/mo
- Expected delta
- $0/yr ($0/mo · -0.0%)
ⓘ Screening estimate from a state-policy table — verify with the county assessor before closing.
Climate risk First Street
- Flood 1/10 Low FEMA zone X (unshaded) · 0% chance over 30 yrs
- Wildfire 4/10 Moderate
- Heat 6/10 Major 7 d/yr ≥104°F today · 17 d/yr by 30 yrs out
- Wind 2/10 Low 3% chance of damaging wind over 30 yrs
- Air quality 3/10 Moderate 3 unhealthy d/yr today · 3 by 30 yrs out
Nearby sold comps map
Loading sold comps map…
Walkable amenities ~0.75 mi
Loading nearby amenities…
Taxation est. · year 1
- Rental income
- $20,363
- − Mortgage interest
- −$12,043
- − Property taxes
- −$1,845
- − Insurance
- −$1,075
- − Repairs & maintenance
- −$1,629
- − Management
- −$1,629
- − HOA
- −$2,400
- − Depreciation
- −$6,255
- Taxable loss
- −$6,513
- Est. tax savings @ 24.0%
- +$1,563
- After-tax cash flow
- $-1,200/yr
For passive investors: Depreciation is non-cash, so a rental often shows a tax loss while cash-flowing — sheltering income. Rental losses are passive: they offset passive income freely, and up to $25,000/yr can offset ordinary (W-2) income if you actively participate and your MAGI is under $100k (phasing out to $0 by $150k); unused losses carry forward. On sale, claimed depreciation is recaptured at up to 25%, and gains may owe capital-gains tax (a 1031 exchange can defer both). Figures are a year-1 estimate at your 24.0% rate — not tax advice; consult a CPA.
Schools (NCES district)
- District
- Greenville 01
- NCES district ID
- 4502310
- Math proficiency
- 44% ▼ -10.00%
- Reading proficiency
- 54% ▼ -2.00%
- Median HH income
- $49,596
- Composite
- 41.88/100
- National rank
- #3370
- State rank
- #10 of 80 in SC
Livability — Fountain Inn
- Score
- 82/100
- State rank
- #4
- US rank
- #1162
Category grades
Schools grade is shown separately in the Schools card above.
Census & demographics
- Census place
- Fountain Inn, SC
Population outlook (Greenville County) Hauer SSP2
- Today (2025)
- 574,580 people
- By 2030
- 615,615 · +7.1%
- By 2040
- 695,373 · +21.0%
- By 2050
- 769,367 · +33.9%
- By 2075
- 933,296 · +62.4%
- By 2100
- 1,029,196 · +79.1%
Not yet ingested
- Political lean
- —
- Race & ethnicity
- —
- Common origin
- —
- Civics
- —
Market trends
- HPI YoY
- —
- Current HPI
- —
- Rent YoY
- —
- Metro
- —
- State GDP YoY
- ▲ 4.51%
- F500 in state
- 2
Industry mix (Fortune 500 HQ in SC)
| Industry | F500 HQs | Revenue |
|---|---|---|
| Packaging | 1 | $7B |
|
||
Price history
+8.0% since first listed6 events — show timeline
- 2026-04-11 Price Changed $215,000 Greater Greenville MLS
- 2026-04-03 Price Changed $228,000 Greater Greenville MLS
- 2026-02-10 Listed $245,000 Greater Greenville MLS
- 2021-04-29 Listing Removed — Greater Greenville MLS
- 2021-03-27 Price Changed $199,990 Greater Greenville MLS
- 2021-02-23 Listed $198,990 Greater Greenville MLS
Property tax history
+37.6%/yrLatest (2025): $1,845 · +9.6% YoY. Source: county tax records.
Cash-flow waterfall
monthlySold comps — $/sqft
last 12 mo · ≤1 miLoading sold comps…